
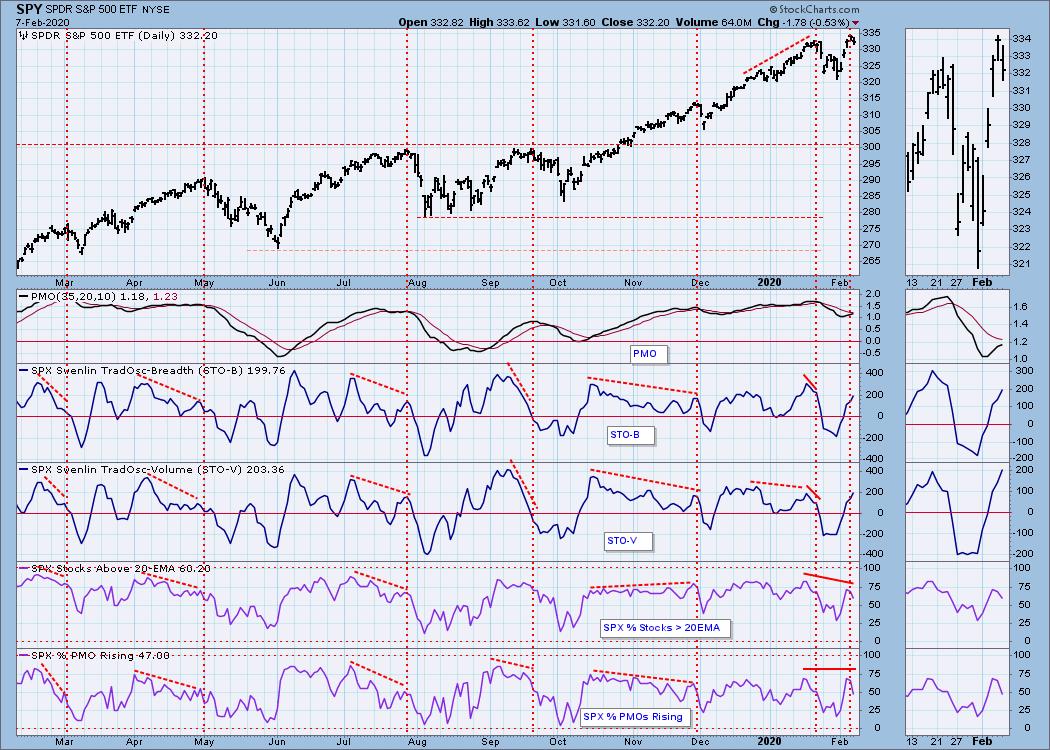
As the S&P 500 Index was hitting new highs this week, I couldn't help but notice the negative divergence caused by the contracting number of individual S&P 500 stocks making new highs. To clarify, a negative divergence occurs when an indicator fails to confirm price movement, and as you can see, new high negative divergences occur frequently and are useful in telling us when fading participation cautions us that some kind of correction is probably approaching.
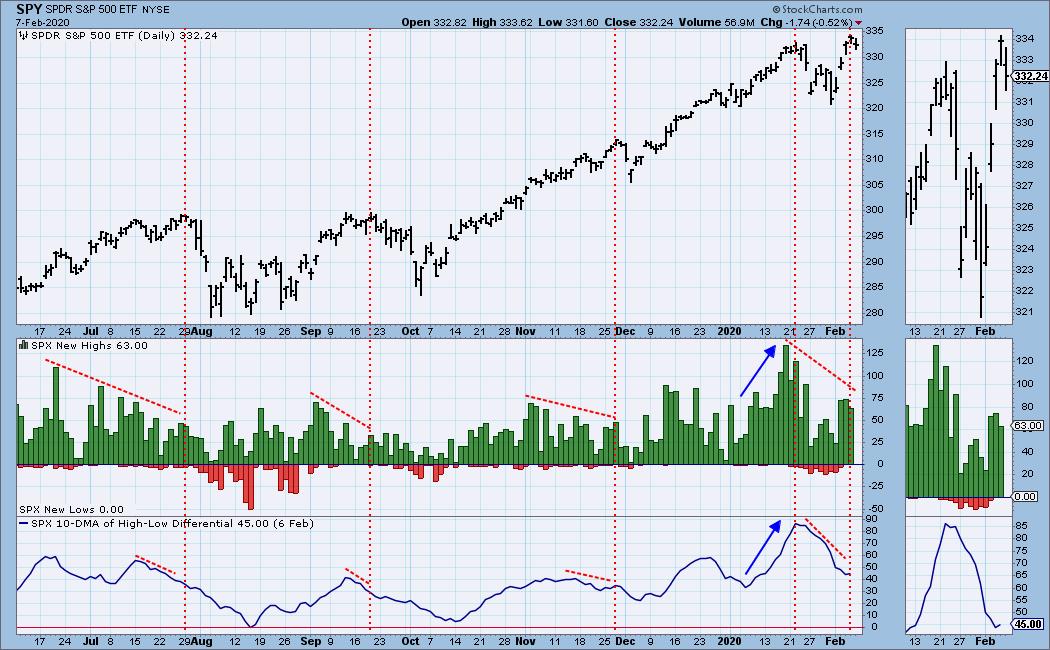
If failure to confirm is a bad thing, confirming indicators must be a good thing, right? Unfortunately, no. Just because internals are in gear with price movement doesn't immunize the market from price reversals. The blue arrows in January show the indicators confirming a healthy price advance, but a pullback eventually took place, a pullback that was confirmed by contracting new highs.
The DecisionPoint Alert Weekly Wrap presents an end-of-week assessment of the trend and condition of the Stock Market, the U.S. Dollar, Gold, Crude Oil, and Bonds. The DecisionPoint Alert daily report (Monday through Thursday) is abbreviated and gives updates on the Weekly Wrap assessments.
Watch the latest episode of DecisionPoint on StockCharts TV's YouTube channel here!
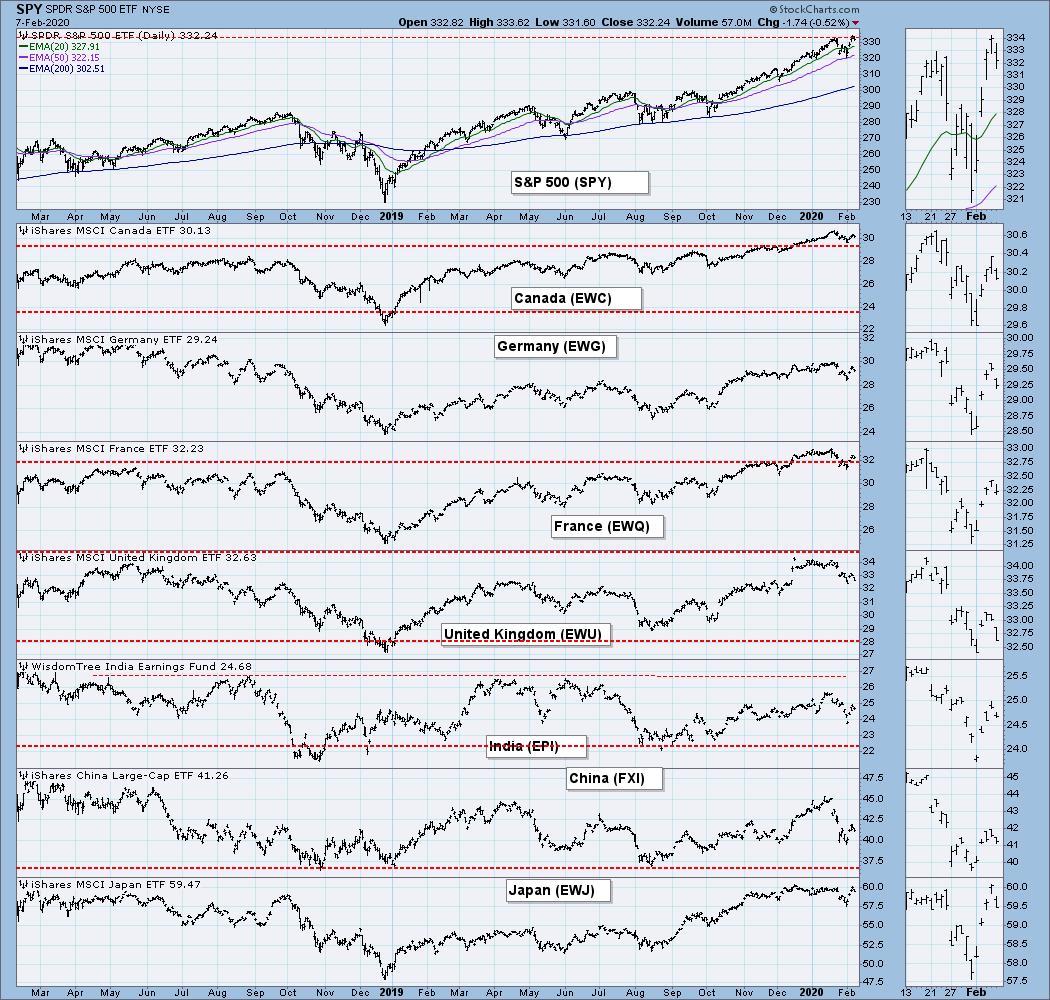
GLOBAL MARKETS
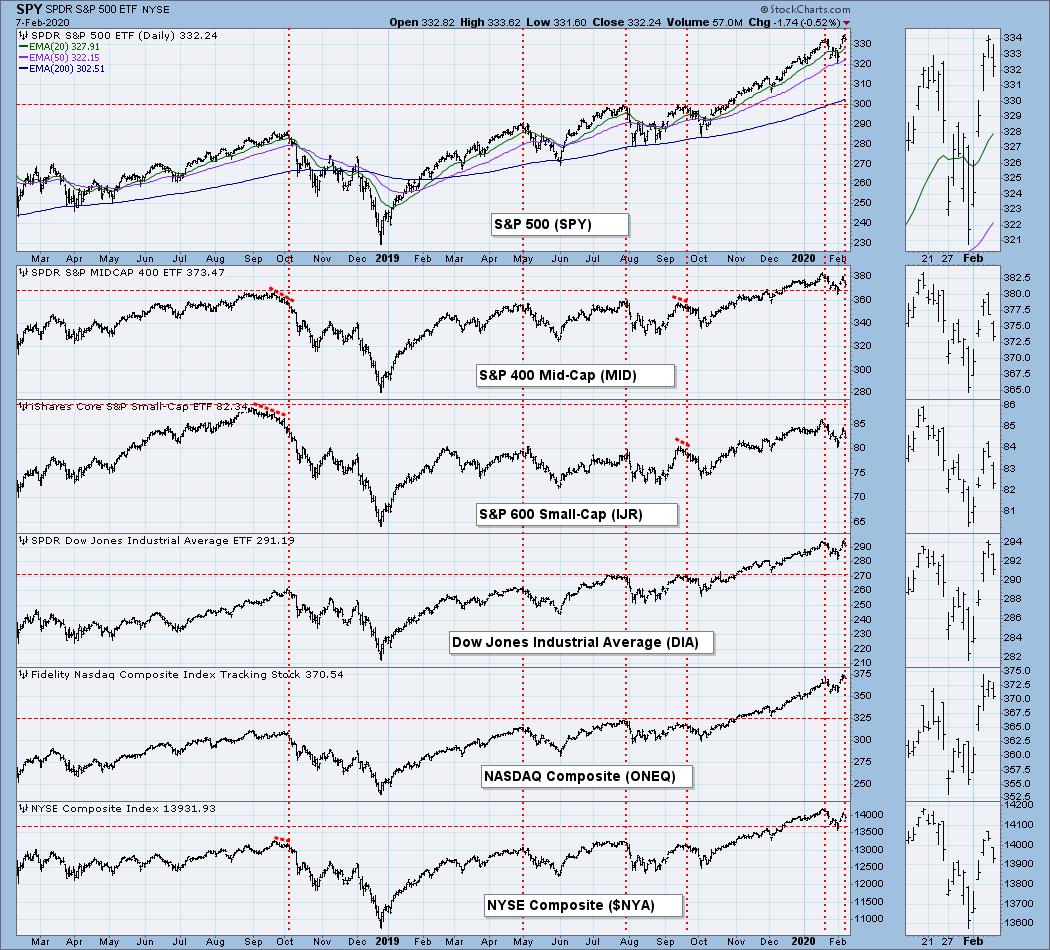
BROAD MARKET INDEXES
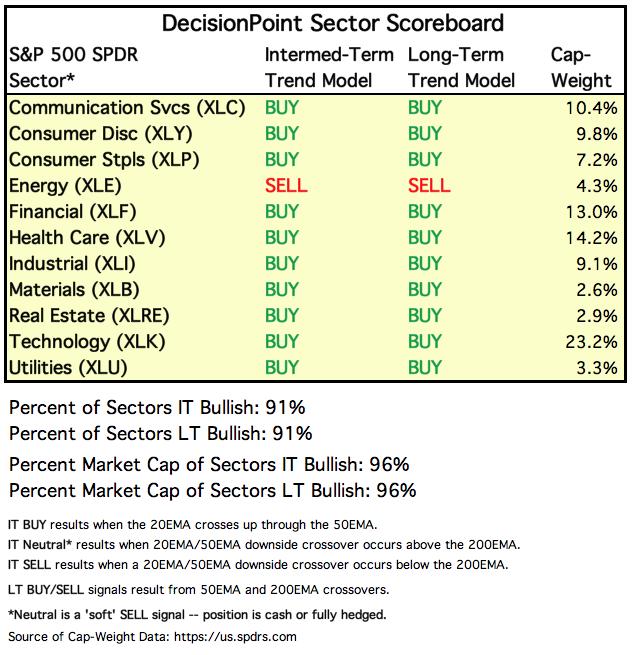
SECTORS
Each S&P 500 Index component stock is assigned to one, and only one, of 11 major sectors. This is a snapshot of the Intermediate-Term (Silver Cross) and Long-Term (Golden Cross) Trend Model signal status for those sectors.
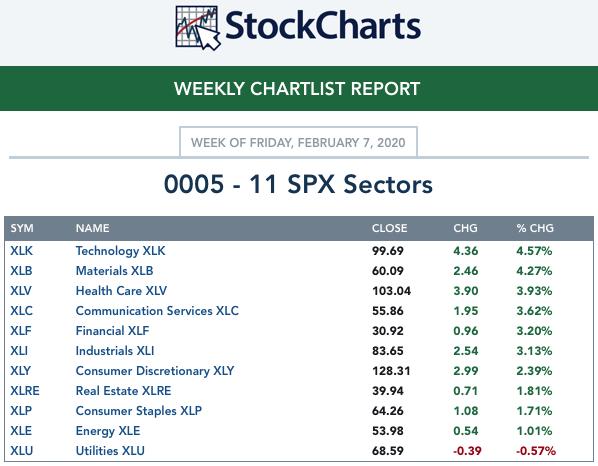
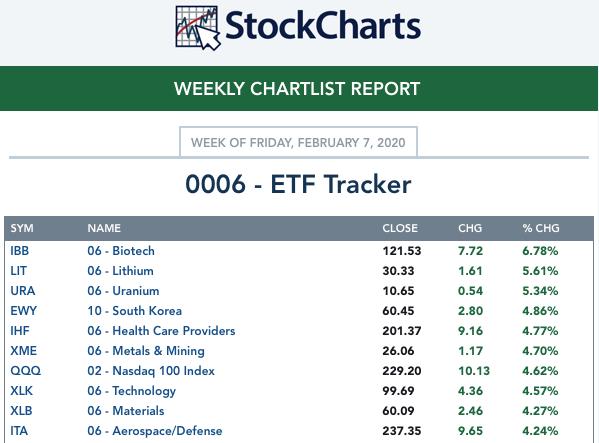
ETF TRACKER: This is a list of about 100 ETFs intended to track a wide range of U.S. market indexes, sectors, global indexes, interest rates, currencies, and commodities. StockCharts.com subscribers can acquire it in the DecisionPoint Trend and Condition ChartPack.
Top 10 . . .
. . . and bottom 10: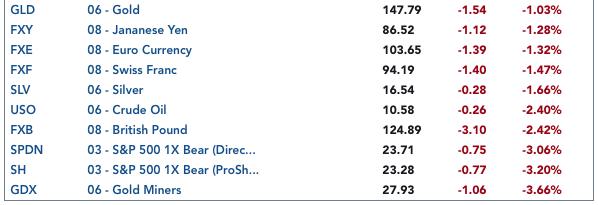
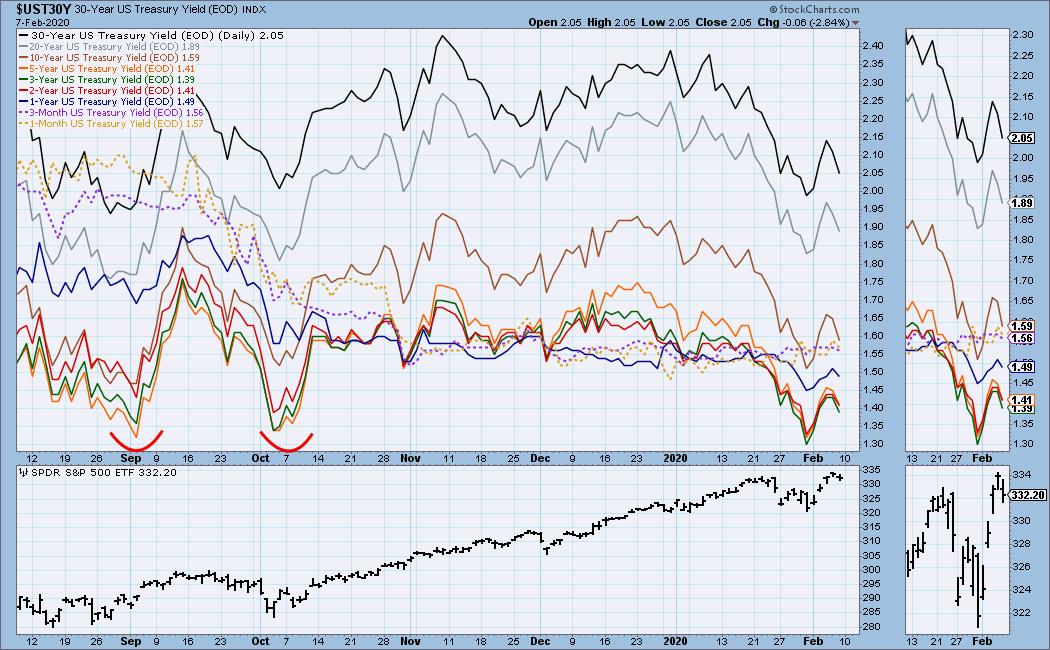
INTEREST RATES
This chart is included so we can monitor rate inversions. In normal circumstances the longer money is borrowed the higher the interest rate that must be paid. When rates are inverted, the reverse is true.
STOCKS
IT Trend Model: BUY as of 9/6/2019
LT Trend Model: BUY as of 2/26/2019
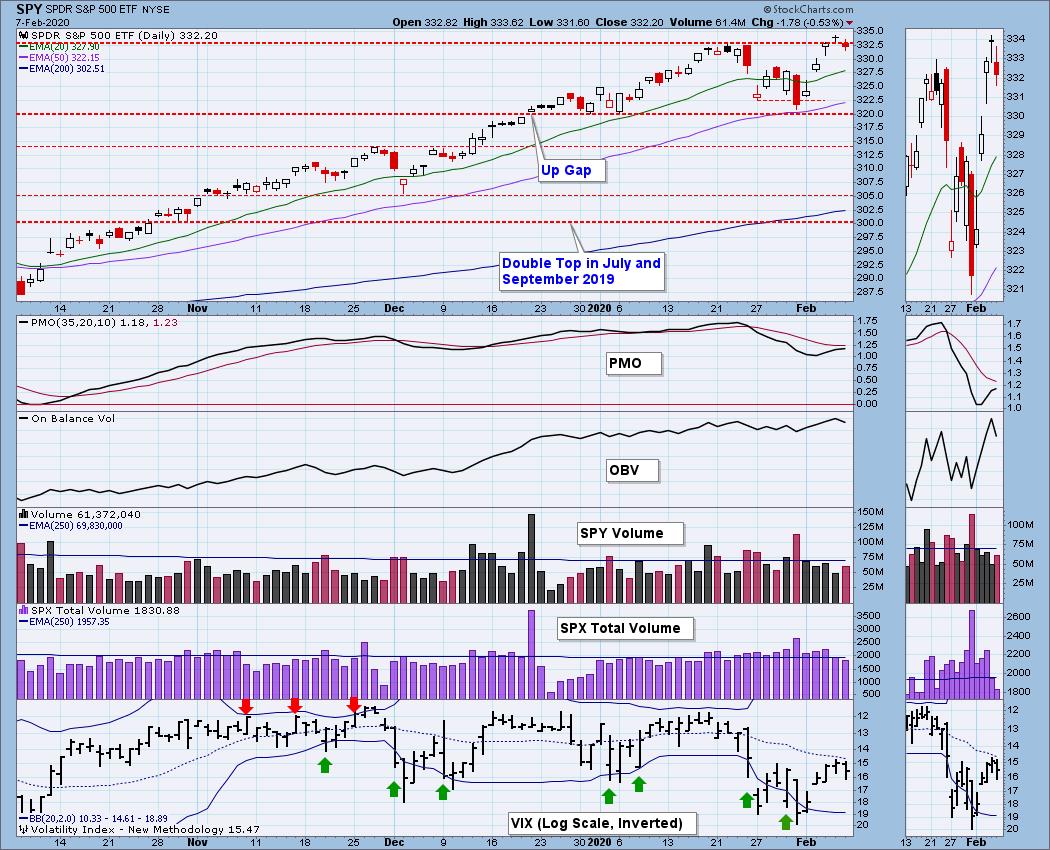
SPY Daily Chart: Another price top was formed this week, but only after a +4% advance. Volume continues to be strong.
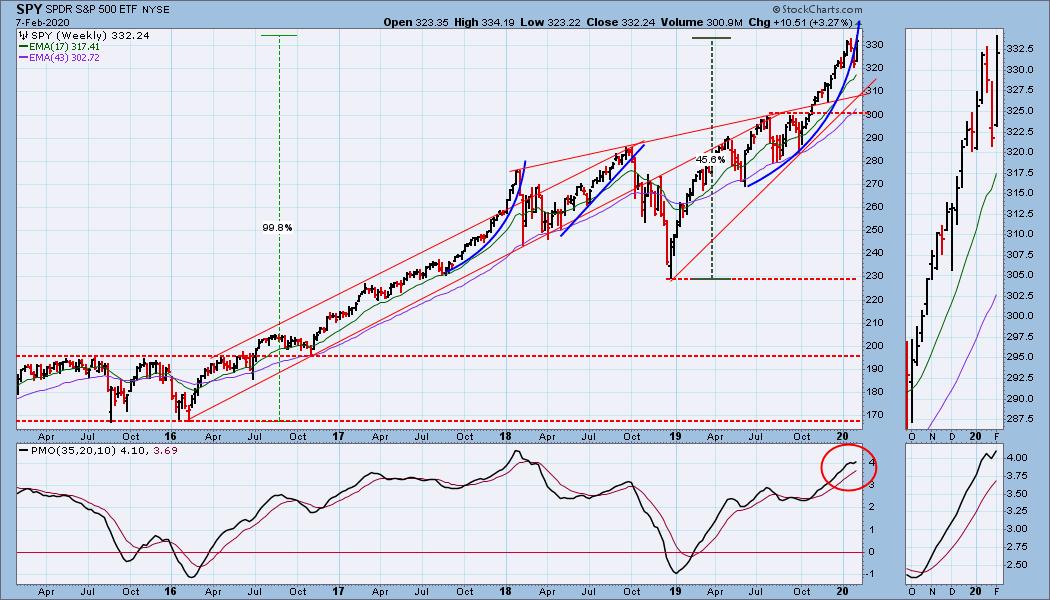
SPY Weekly Chart: The parabolic arc was penetrated to the downside last week, but it was recaptured this week, and the weekly PMO turned up again. Nevertheless, the PMO is overbought, and we'll have to keep an eye on this chart to see if there will be downside follow through.
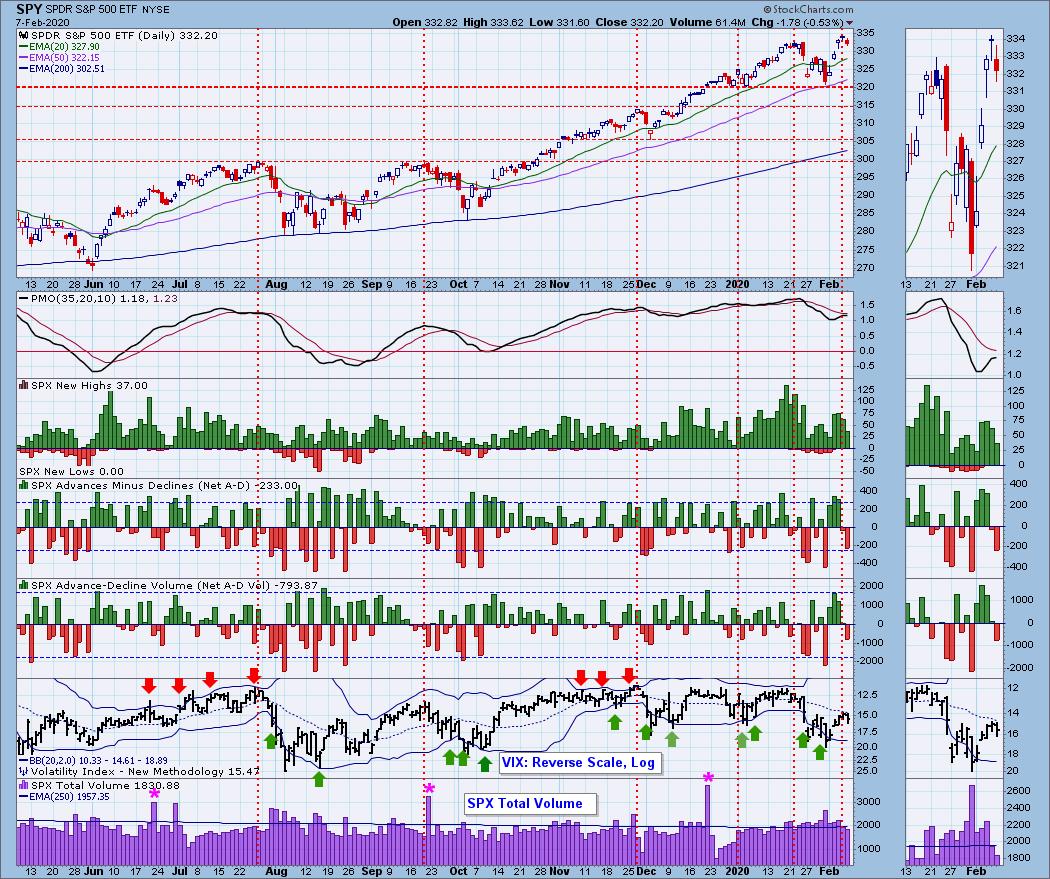
Climactic Market Indicators: Net breadth and net volume indicators reflected upside climaxes on Tuesday and Wednesday this week, but I can't decide if they were upside initiation or exhaustion climaxes.
Short-Term Market Indicators: The ST trend is UP and the market condition is MODESTLY OVERBOUGHT. Two of these indicators are falling, so I think more price decline is favored.
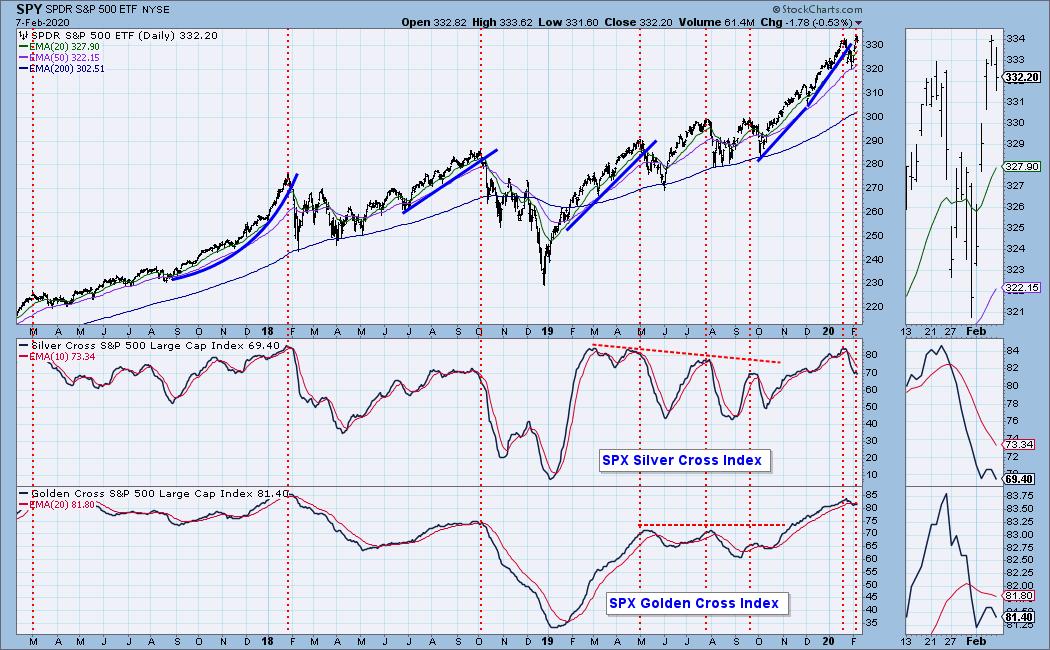
Intermediate-Term Market Indicators: The Silver Cross Index (% of SPX stocks 20EMA > 50EMA) closed down for the week in spite of the rally. The Golden Cross Index (percent of SPX stocks 50EMA > 200EMA) is overbought and is below the signal line and falling.
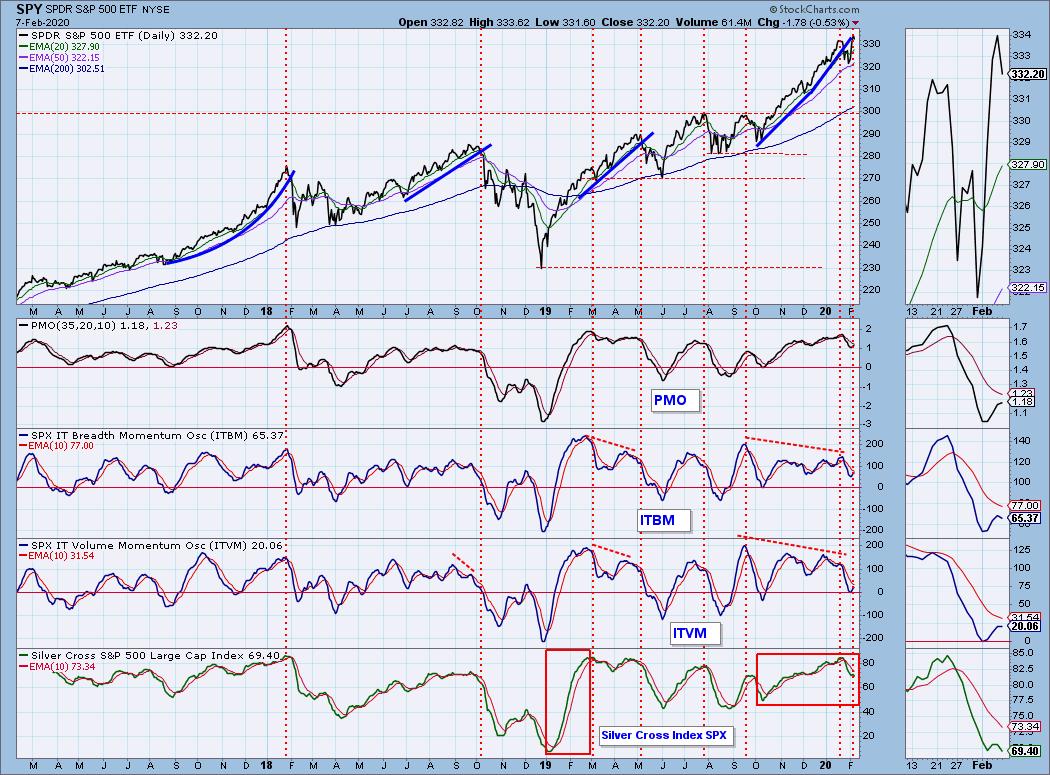
The IT trend is UP and the market condition is NEUTRAL based upon the ITBM and ITVM readings, and SOMEWHAT OVERBOUGHT based upon the PMO and Silver Cross Index. Three of the indicators are below their signal line and falling, so that favors more downside price movement.
CONCLUSION: Concern over the coronavirus seems to wax and wane depending on other news of the moment, but I still consider it to be a major issue. So far it appears that the market doesn't agree with that assessment. Many years ago I wrote that the market is a sociopath -- it only cares about itself and what can bring it pleasure or pain. It doesn't care about other people's death and destruction unless it is happening right next door or closer. That's neither good nor evil, it just is.
The ST and IT trend and condition are generally in gear with each other, that is to say, RISING and OVERBOUGHT, but they are not at extreme limits of overbought. Last week I thought we were finally going to get more than a feeble dip, but that didn't happen. After this week's bounce and Friday's topping, we again have a setup for a decline next week.
Have you subscribed the DecisionPoint Diamonds yet? DP does the work for you by providing handpicked stocks/ETFs from exclusive DP scans! Add it with a discount! Contact support@decisionpoint.com for more information!
DOLLAR (UUP)
IT Trend Model: BUY as of 1/22/2020
LT Trend Model: BUY as of 5/25/2018
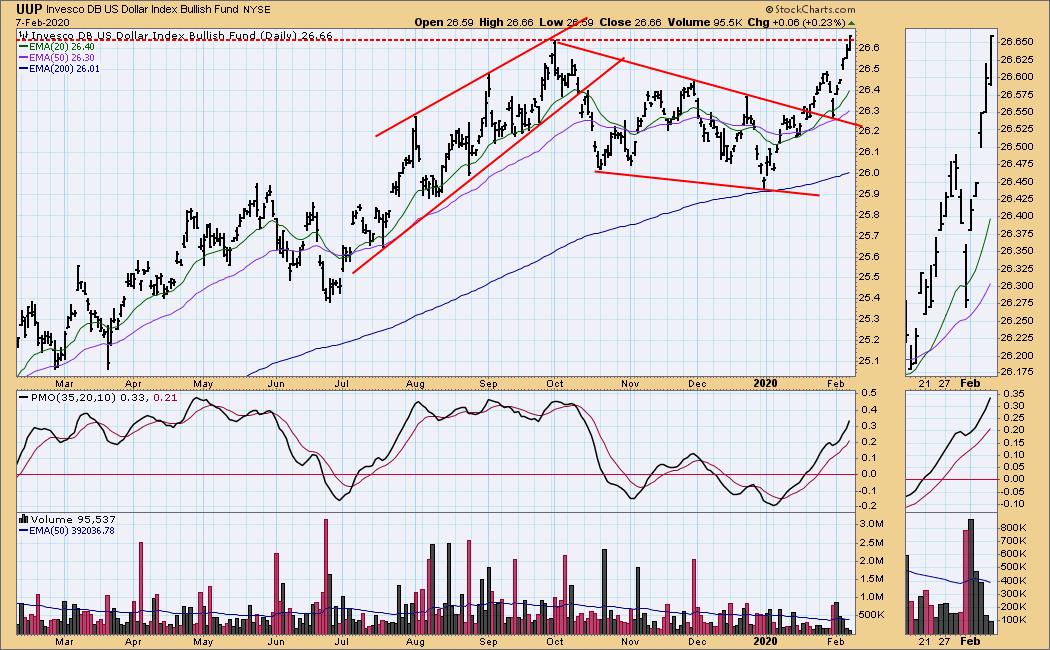
UUP Daily Chart: After a falling wedge breakout and pullback, UUP rallied strongly this week and is challenging the line of resistance drawn from the October top.
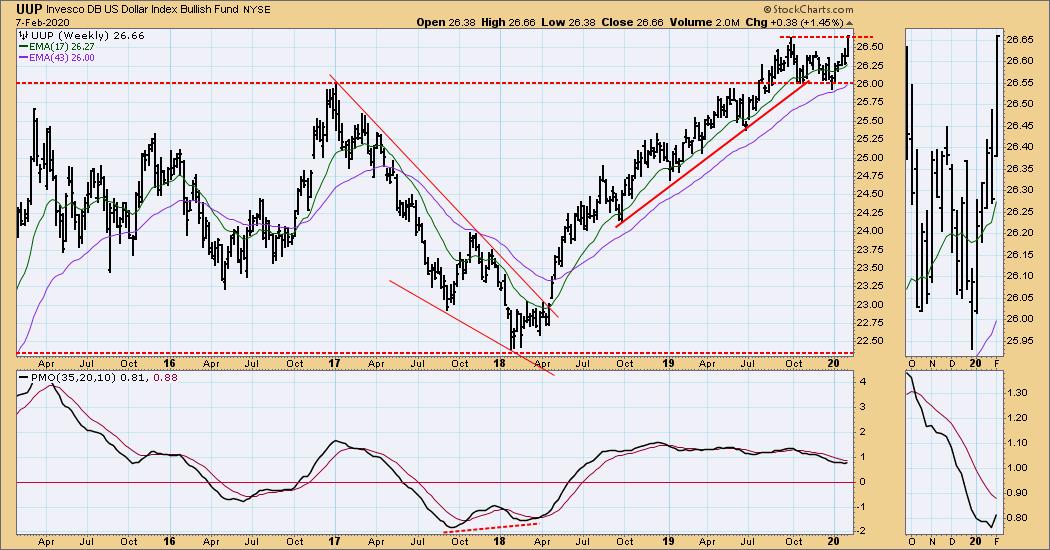
UUP Weekly Chart: The advance from the 2018 low may have been digested with the recent six-month churning just above the long-term line of support, and a breakout appears to be imminent.
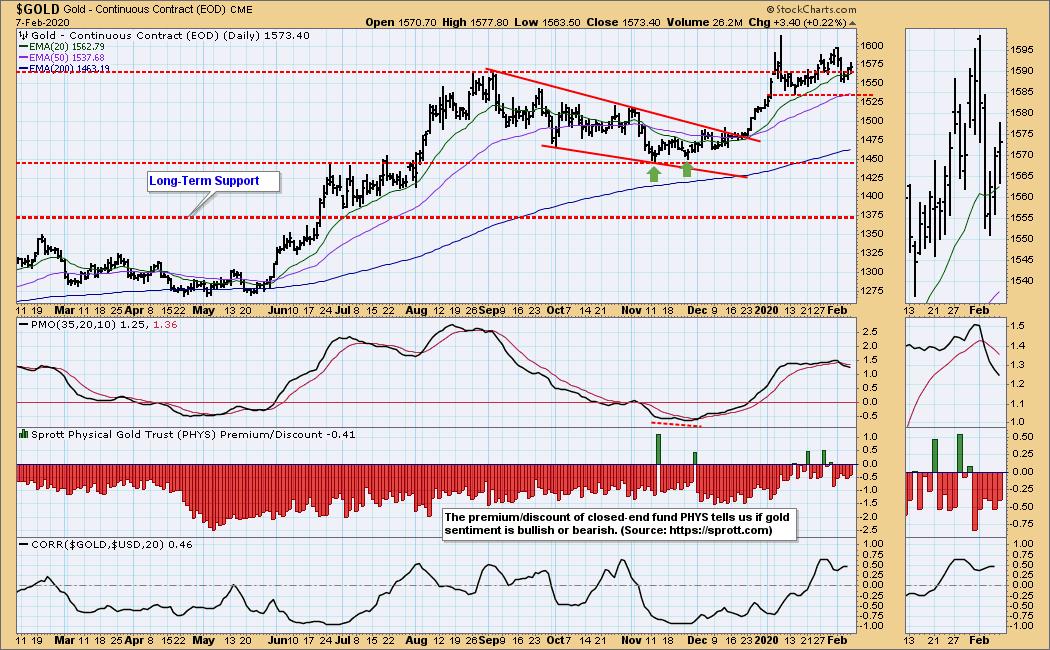
GOLD
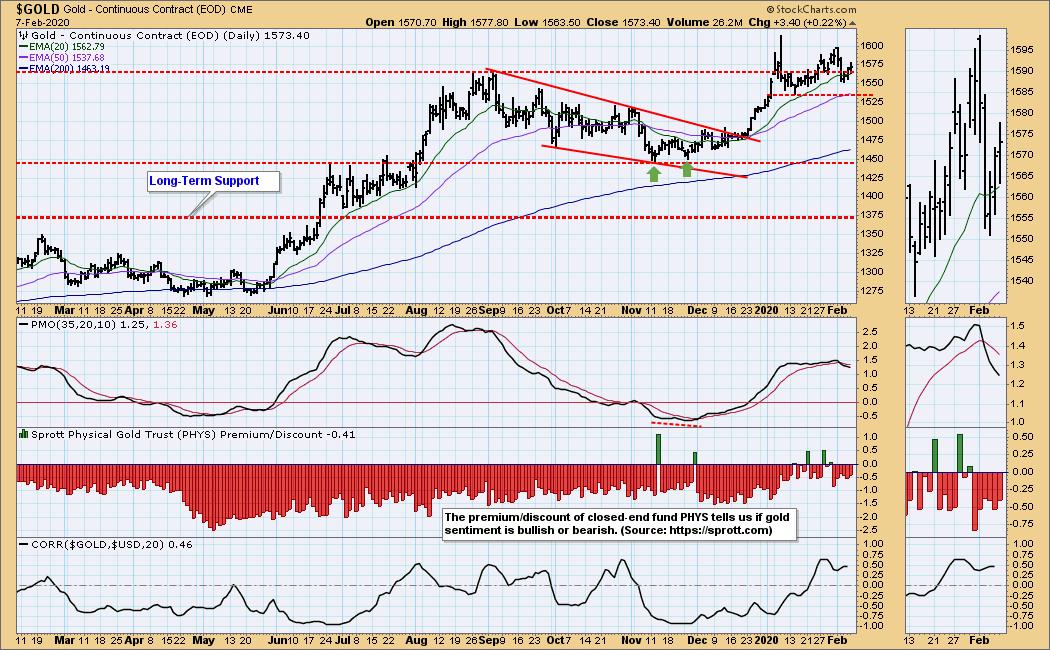
IT Trend Model: BUY as of 12/26/2019
LT Trend Model: BUY as of 1/8/2019
GOLD Daily Chart: The line drawn across the September top is acting as an impediment to up or down progress. Since gold's trend is up, I guess we must consider the line to be resistance. The daily PMO below the signal line and falling, a caution flag in this time frame.
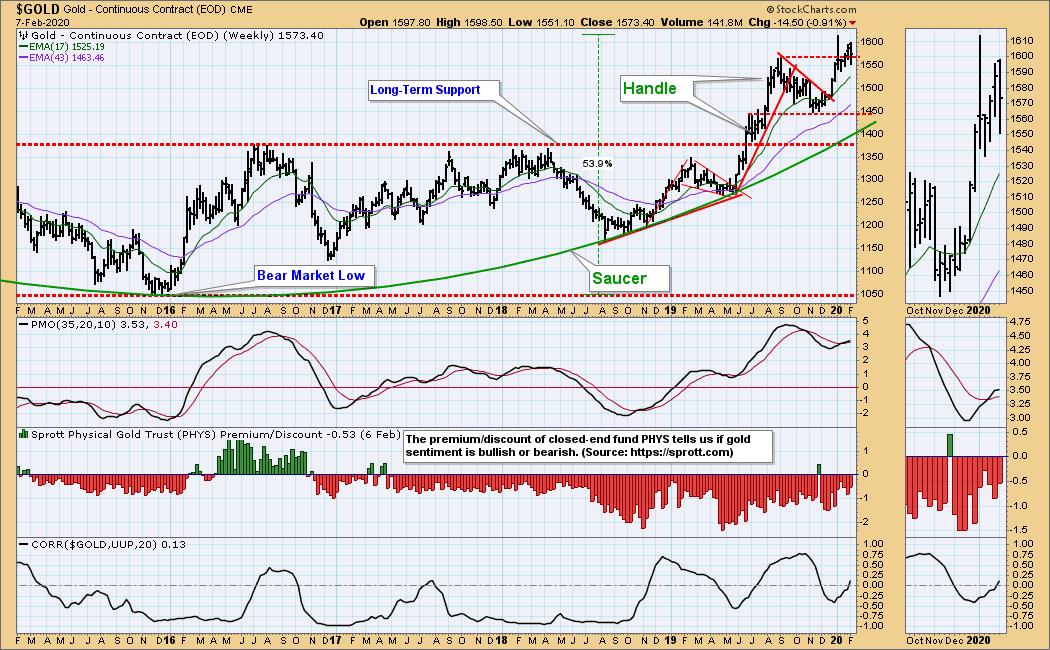
GOLD Weekly Chart: The weekly PMO turned down this week. There may be some more chopping around to form more of a handle, but the long-term support line at 1380 is crucial.
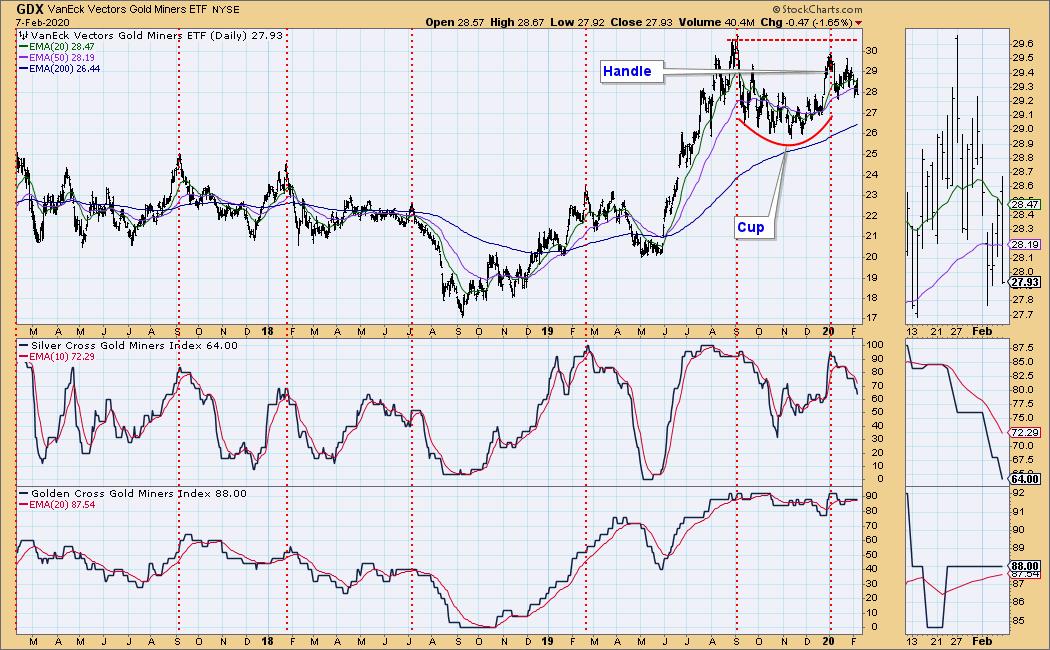
GOLD MINERS Golden and Silver Cross Indexes: The GDX Silver Cross Index continued to decline this week.
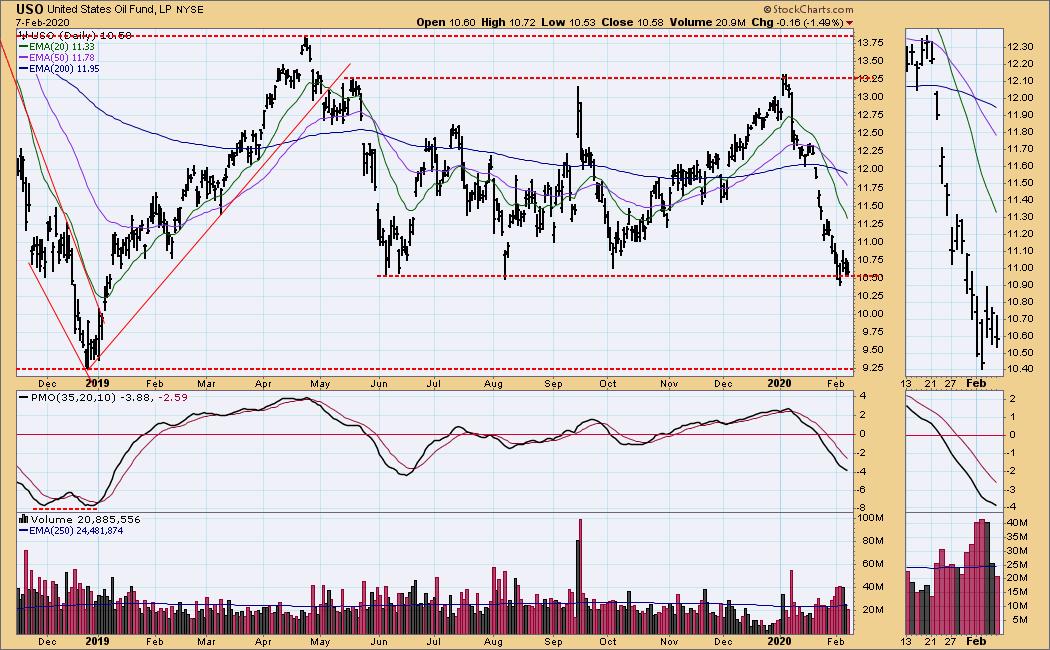
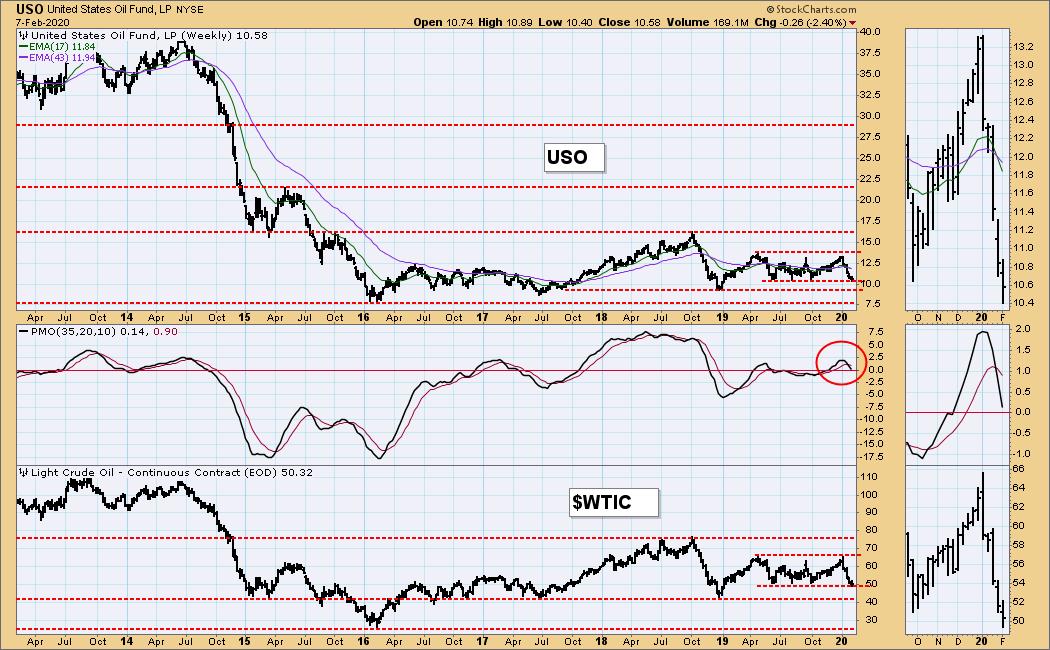
CRUDE OIL (USO)
IT Trend Model: NEUTRAL as of 1/27/2020
LT Trend Model: SELL as of 2/3/2020
USO Daily Chart: The bottom of the eight-month trading range continued to hold.
USO Weekly Chart: The weekly PMO is negative.
BONDS (TLT)
IT Trend Model: BUY as of 1/22/2020
LT Trend Model: BUY as of 1/2/2019
TLT Daily Chart: The daily PMO topped on the pullback, but it turned up again on Friday.
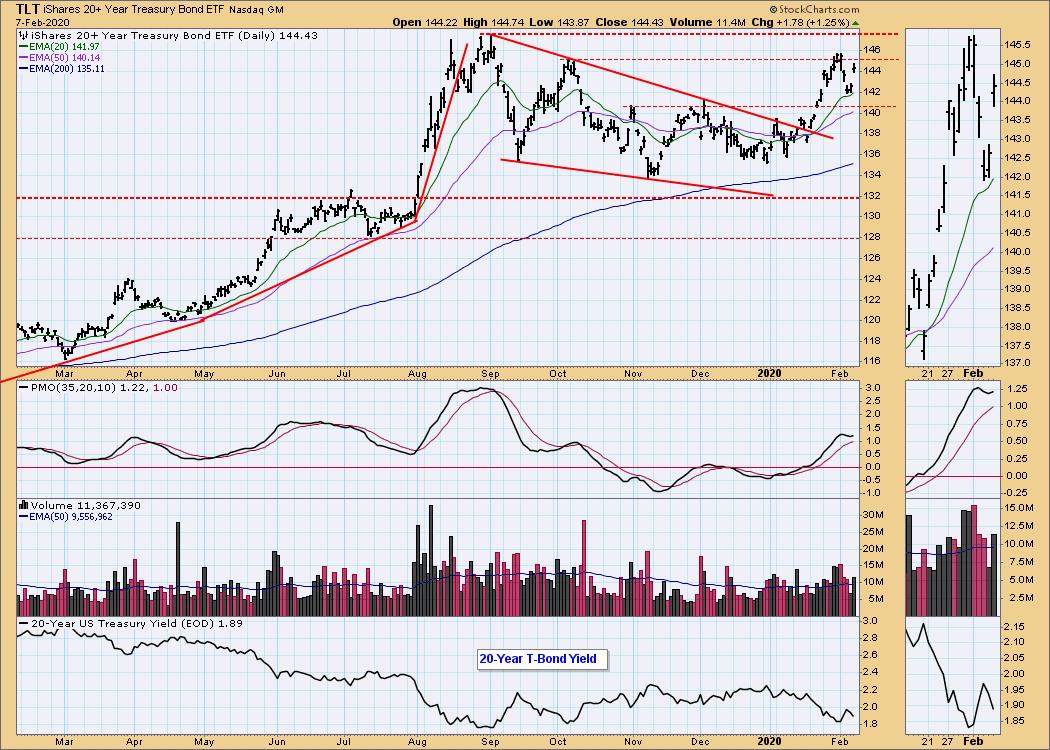
TLT Weekly Chart: This week's pullback has caused the weekly PMO to decelerate and hint at turning over, and the 20-year yield is close to a level of support.
Technical Analysis is a windsock, not a crystal ball.
Happy Charting! - Carl
NOTE: The signal status reported herein is based upon mechanical trading model signals, specifically, the DecisionPoint Trend Model. They define the implied bias of the price index based upon moving average relationships, but they do not necessarily call for a specific action. They are information flags that should prompt chart review. Further, they do not call for continuous buying or selling during the life of the signal. For example, a BUY signal will probably (but not necessarily) return the best results if action is taken soon after the signal is generated. Additional opportunities for buying may be found as price zigzags higher, but the trader must look for optimum entry points. Conversely, exit points to preserve gains (or minimize losses) may be evident before the model mechanically closes the signal.
Helpful DecisionPoint Links:
DecisionPoint Alert Chart List
DecisionPoint Golden Cross/Silver Cross Index Chart List
DecisionPoint Sector Chart List
Price Momentum Oscillator (PMO)
Swenlin Trading Oscillators (STO-B and STO-V)