
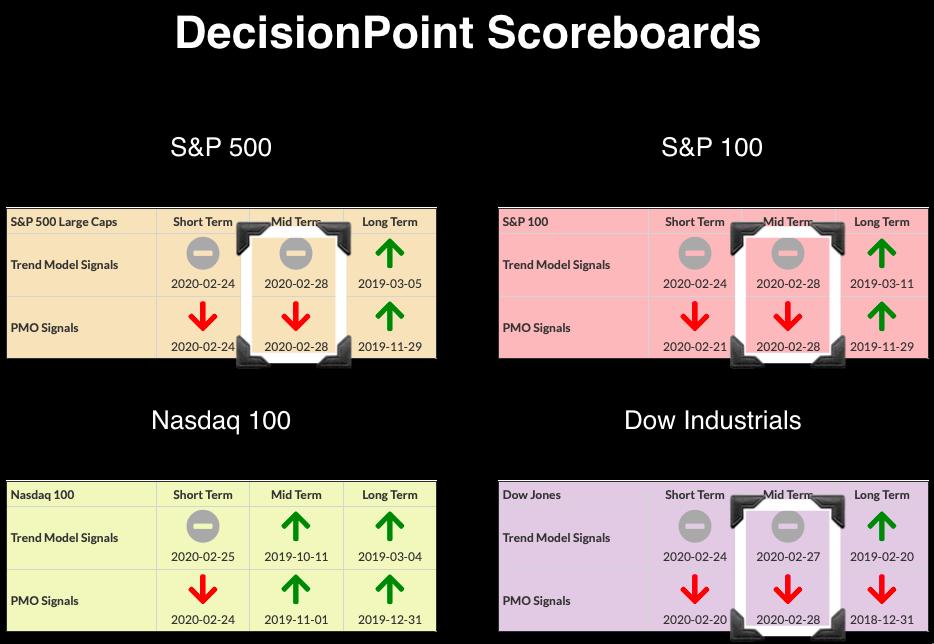
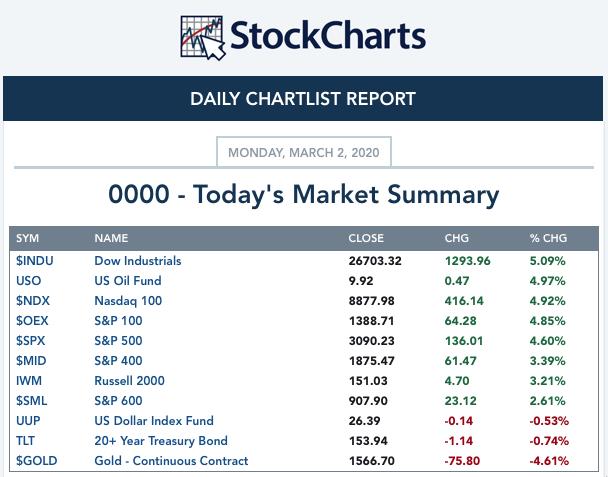
The financial news stations were giddy with excitement today as the Dow posted is highest point gain in history. I learned from my father, Carl, it is important to have a healthy dose of skepticism at times like these. As is generally the case, Apple (AAPL) was one of the driving forces that propelled the Dow 0.5% higher than the SPX. At the end of last week, the DecisionPoint Scoreboards had completely changed their landscape. For months there were BUY signals across the boards and now, we are seeing the damage of the correction. Essentially, all but the NDX had Silver "Death" Crosses, where the 20-EMA drops below its 50-EMA. Note that we didn't go into IT Trend Model SELL signals here. When the 50-EMAs are above the 200-EMAs these "silver death crosses" are Neutral signals, not SELL signals.
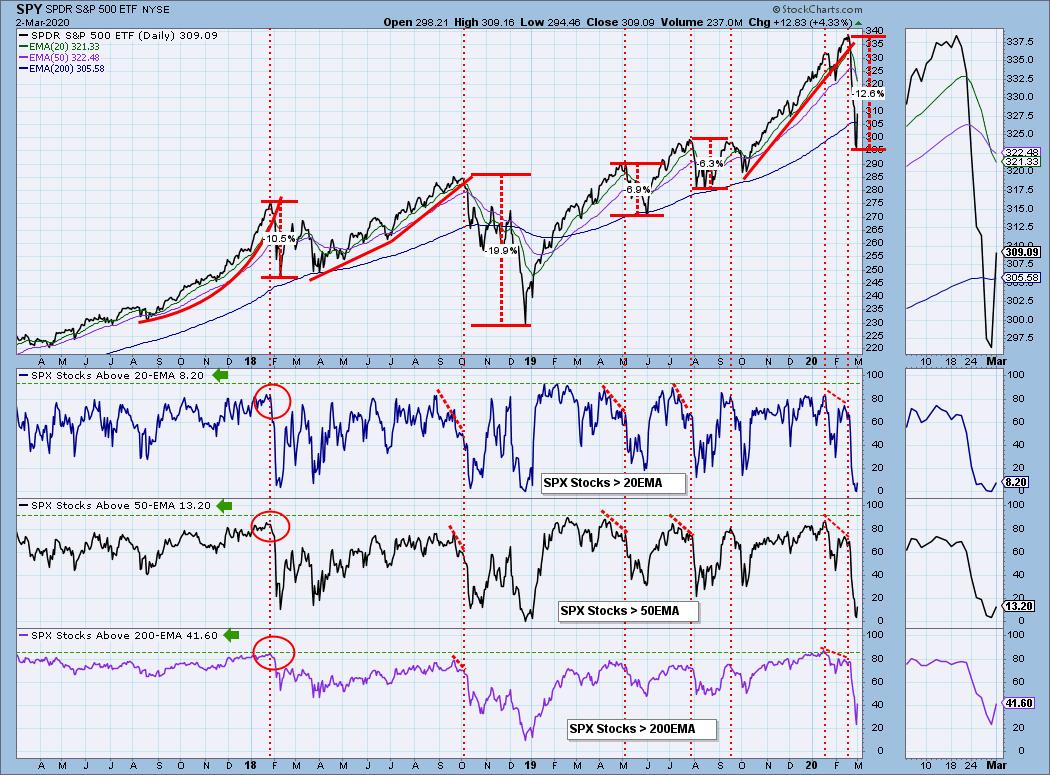
On today's DecisionPoint Show on StockCharts TV, the chart below hadn't updated yet and I promised subscribers we would evaluate it in today's report. We did see improvement in the number of stocks above their 20/50/200-EMAs, but the percentages are still very low. As Carl and I reiterated, oversold conditions in a bear market environment are not the best foundations for longer-term rallies.
TODAY'S Broad Market Action:
Past WEEK Results:
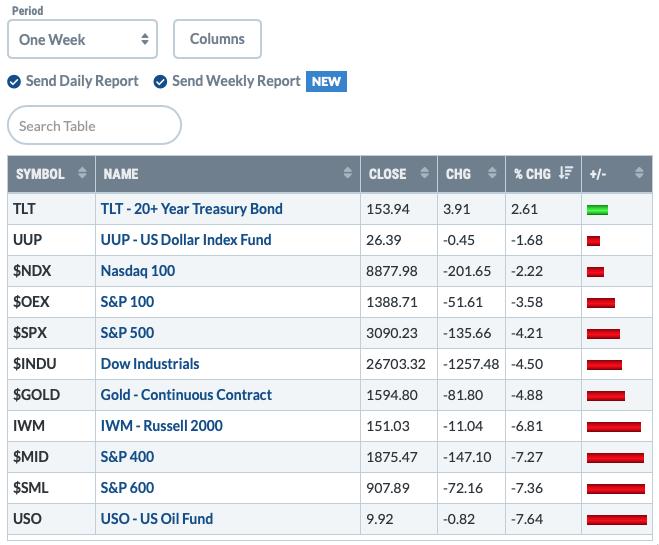
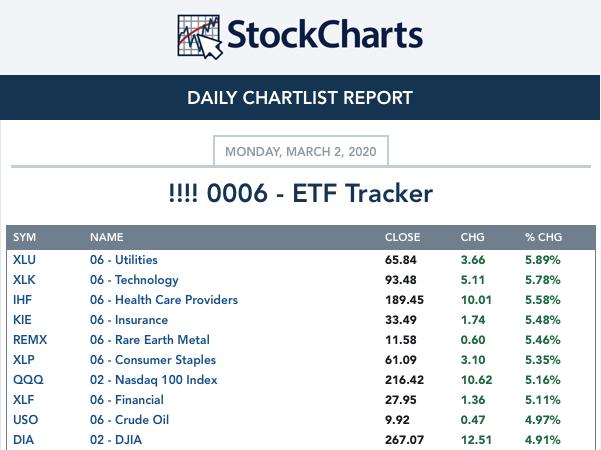
Top 10 from ETF Tracker:
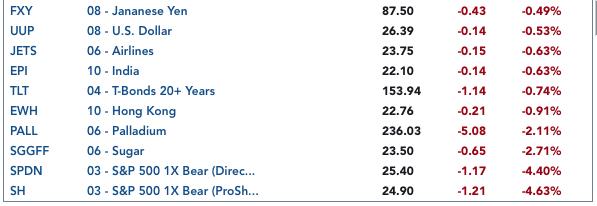
Bottom 10 from ETF Tracker:
On Friday, the DecisionPoint Alert Weekly Wrap presents an assessment of the trend and condition of the stock market (S&P 500), the U.S. Dollar, Gold, Crude Oil, and Bonds. Monday through Thursday the DecisionPoint Alert daily report is abbreviated and covers changes for the day.
Watch the latest episode of DecisionPoint on StockCharts TV's YouTube channel here!
SECTORS
SIGNALS:
Each S&P 500 Index component stock is assigned to one, and only one, of 11 major sectors. This is a snapshot of the Intermediate-Term (Silver Cross) and Long-Term (Golden Cross) Trend Model signal status for those sectors.
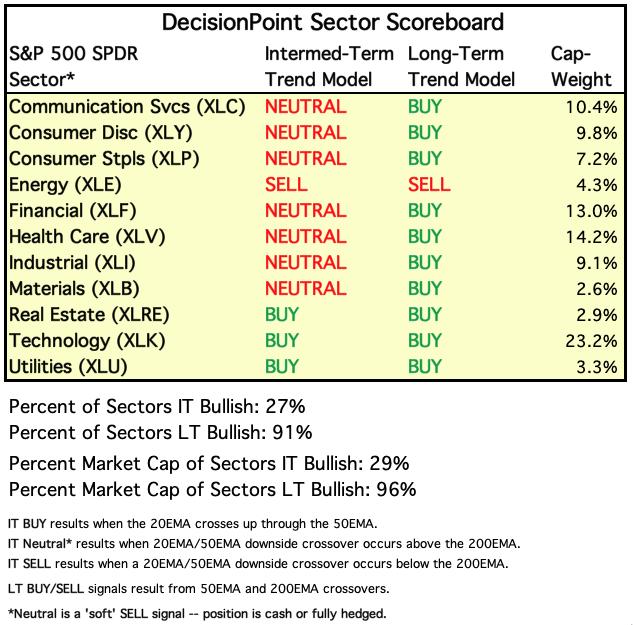
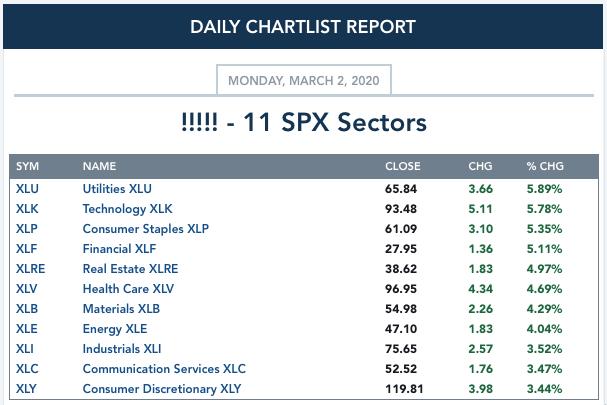
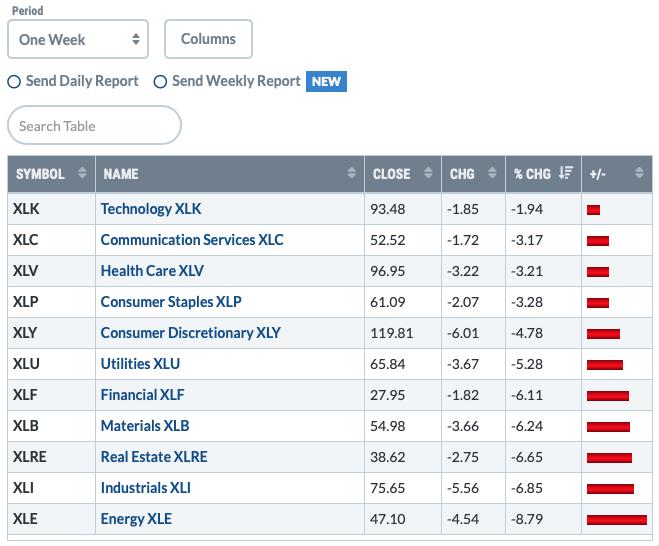
Another issue I have right now is the leadership of defensive sectors. Yes, Technology had a good day (thank you, Apple), but overall we are seeing the more defensive areas leading. In bear markets, the defensive sectors will carry most of the rallies.
TODAY'S RESULTS:
One WEEK Results:
STOCKS
IT Trend Model: BUY as of 9/6/2019
LT Trend Model: BUY as of 2/26/2019
SPY Daily Chart: Carl noted in Friday's "Weekly Wrap" that we were seeing a price recovery at the end of the day and could be signaling the beginning of a short-term bounce. I was disappointed to see less total volume on today's spectacular rally than we saw on Friday's decline. Notice that the OBV has turned up, but it is just a tick to the upside given the amount of negative volume from last week.
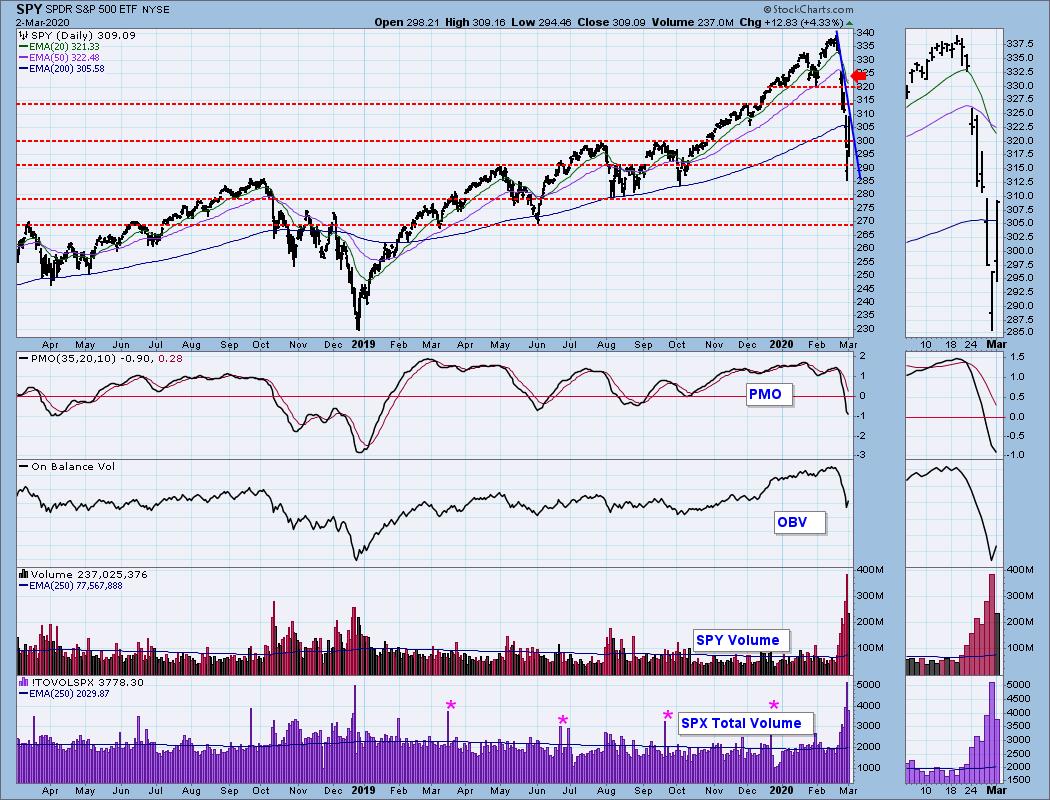
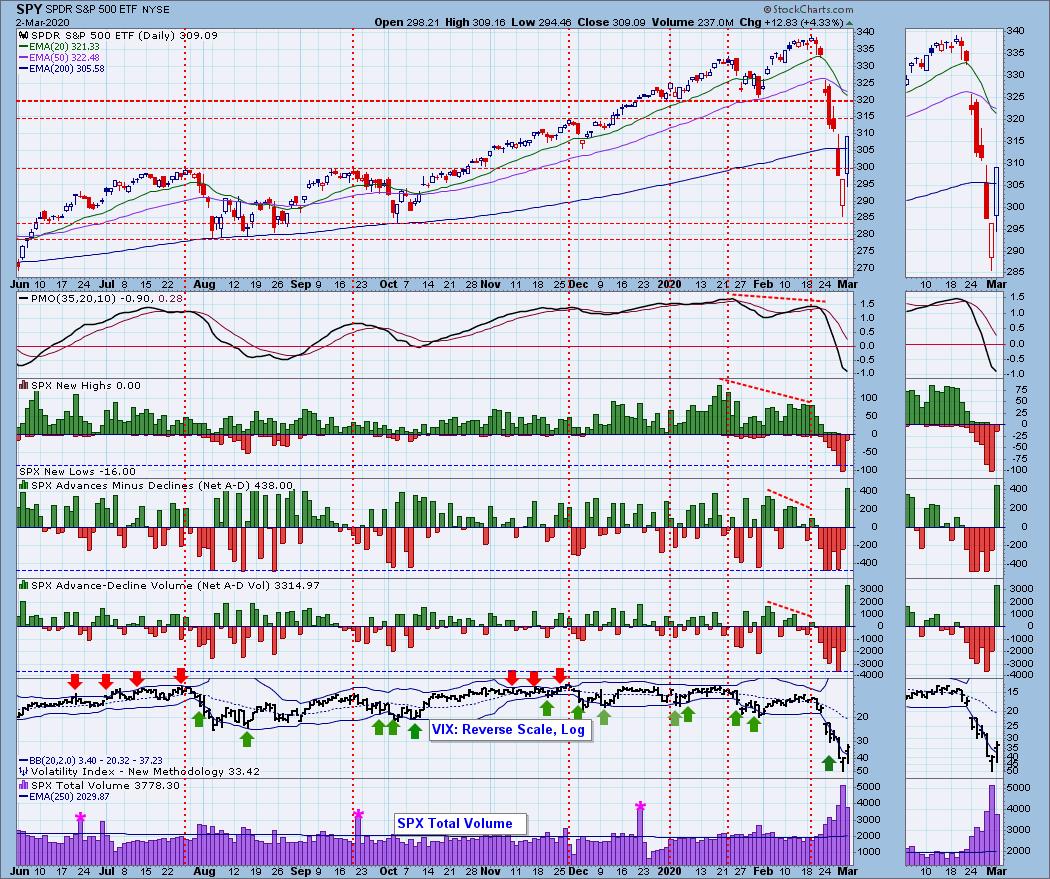
Climactic Market Indicators: Not surprisingly, we had very climactic readings on our ultra-short-term indicators. Carl and I were in agreement that this is a buying initiation to higher prices. The VIX is traveling back into the Bollinger Bands, though it is still reading very high, suggesting the fear is still there.
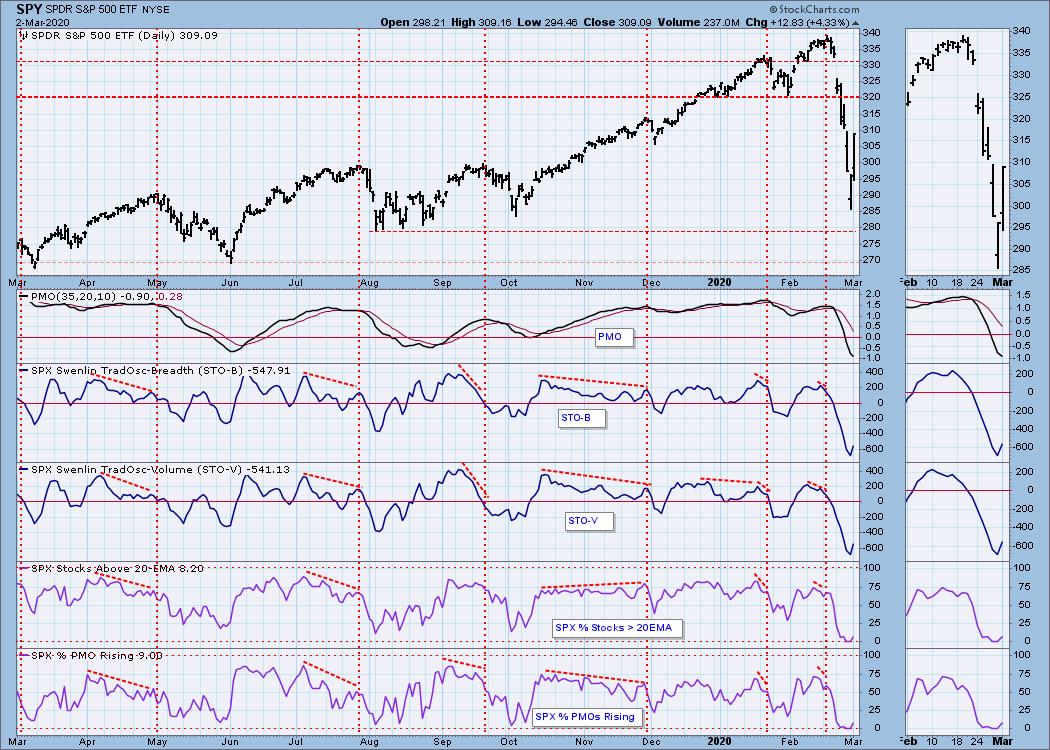
Short-Term Market Indicators: The ST trend is DOWN and the market condition is OVERSOLD based upon the Swenlin Trading Oscillator (STO) readings. The Swenlin Trading Oscillators (STOs) turned up today along with the %stocks above 20/EMAs and %PMO Rising. This is certainly bullish for the short term, but again, oversold conditions in a market like this only provide thin support.
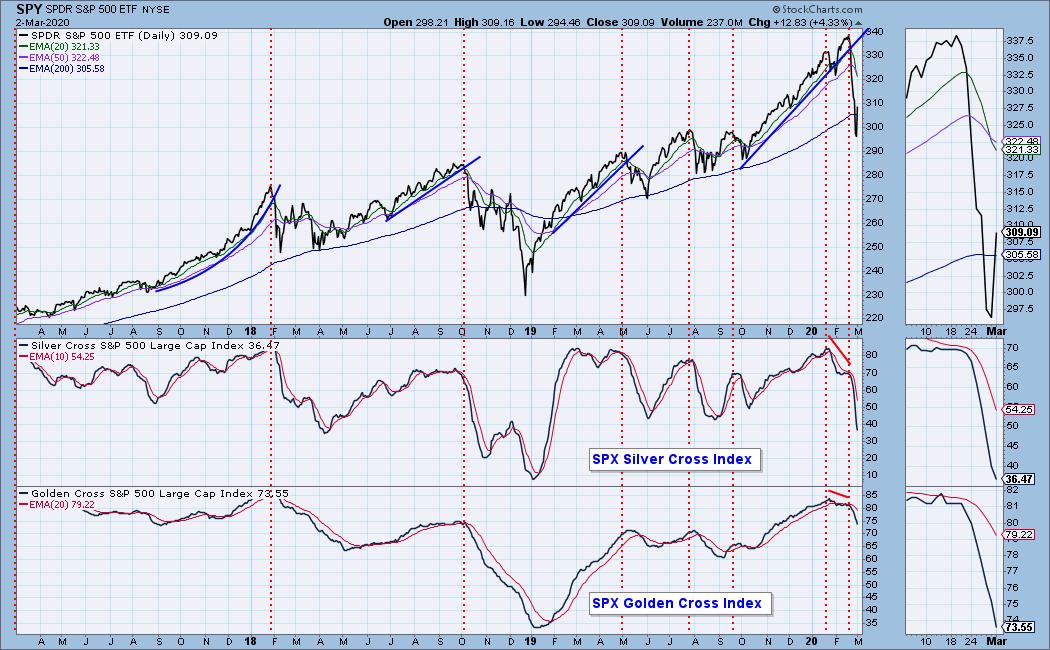
Intermediate-Term Market Indicators: The Silver Cross Index (% of SPX stocks 20EMA > 50EMA) and the Golden Cross Index (percent of SPX stocks 50EMA > 200EMA) continue to dive with price. The SCI took a deep dive with price and we finally are seeing damage being done to the Golden Cross Index. Hate to point it the obvious, but these indexes were well below their current levels before the secular bear market ended.
The IT trend is DOWN when measured by the green rising trendline and the market condition is OVERSOLD based upon the ITBM and ITVM readings, SOMEWHAT OVERSOLD based on the PMO and the Silver Cross/Golden Cross Index readings. The ITBM and ITVM continue lower. They are very oversold but weren't fazed by today's rally as they barely decelerated.
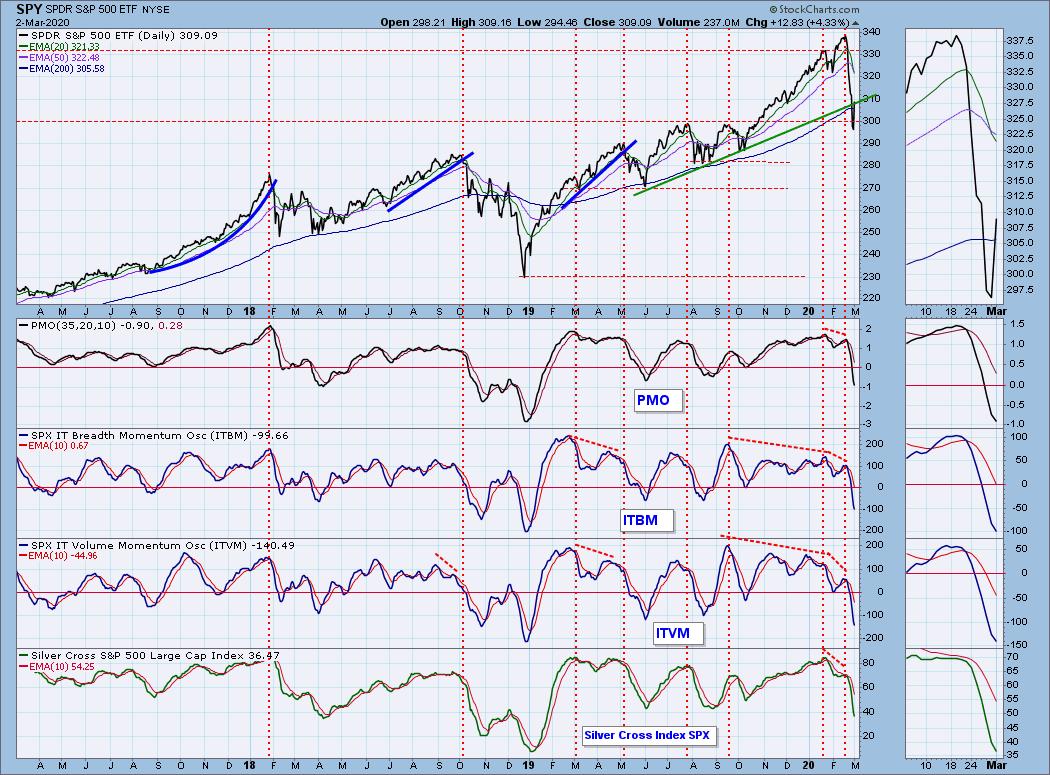
CONCLUSION: The ST and IT trends are DOWN. Market condition based on ST and IT indicators is OVERSOLD. It is encouraging to see oversold indicators. I expect some more upside this week, but I suspect there will be another leg down once short-term oversold conditions clear based on the neutral reading on the Golden Cross Index and continued decline on IT indicators.
(Not a Diamonds subscriber? Add it to your DP Alert subscription and get a discount! Contact support@decisionpoint.com for your limited time coupon code!)
DOLLAR (UUP)
IT Trend Model: BUY as of 1/22/2020
LT Trend Model: BUY as of 5/25/2018
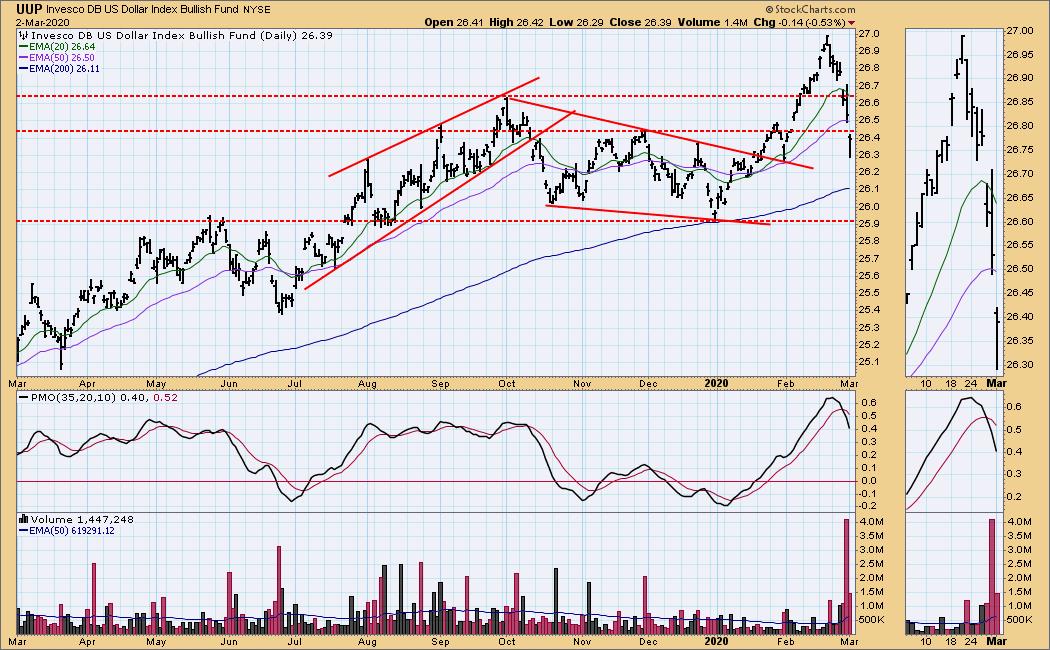
UUP Daily Chart: The Dollar was seriously harmed along with the rest of the market. UUP easily cut through two lines of support that really should have held if we were going to see a rally. The PMO is ugly and suggests a further decline in the Dollar.
GOLD
IT Trend Model: BUY as of 12/26/2019
LT Trend Model: BUY as of 1/8/2019
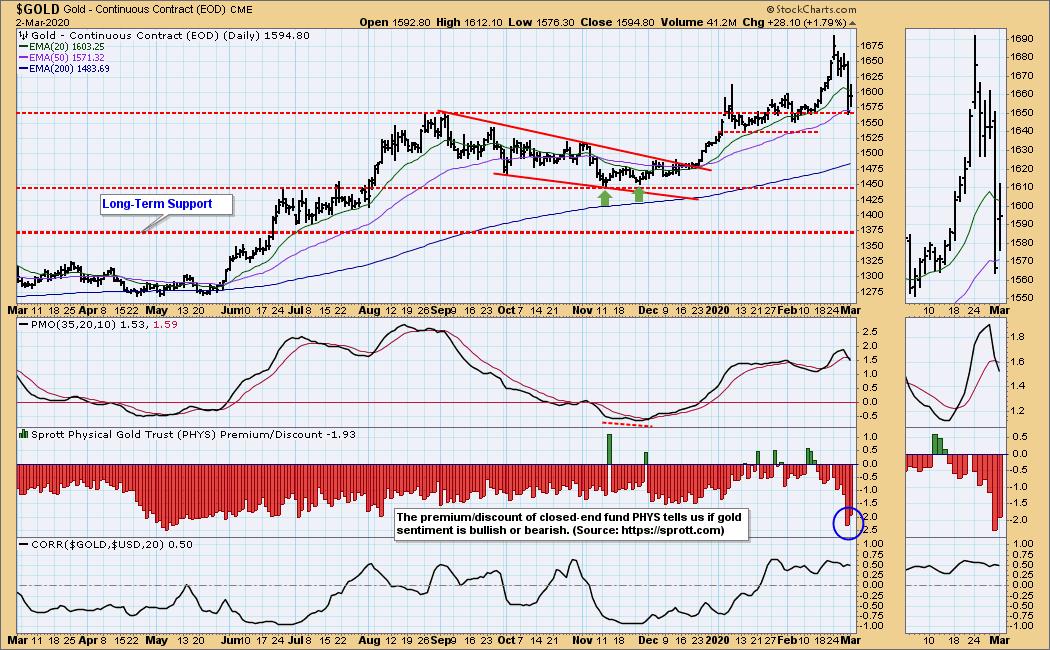
GOLD Daily Chart: Carl and I were surprised to see Gold prices damaged during the market decline given that it typically strengthens in corrections as investors usually consider it a safe choice. Hence the nomenclature of "flight to safety". Well, we didn't really see a flight to safety. Carl mentioned in today's DecisionPoint Show that he likes the performance of Gold today as it is holding support. The PMO isn't great given the new SELL signal, but I note that discounts are very high right now. This is a sign of bearishness among investors in Gold and that usually translates to a bullish environment for Gold to rally within.
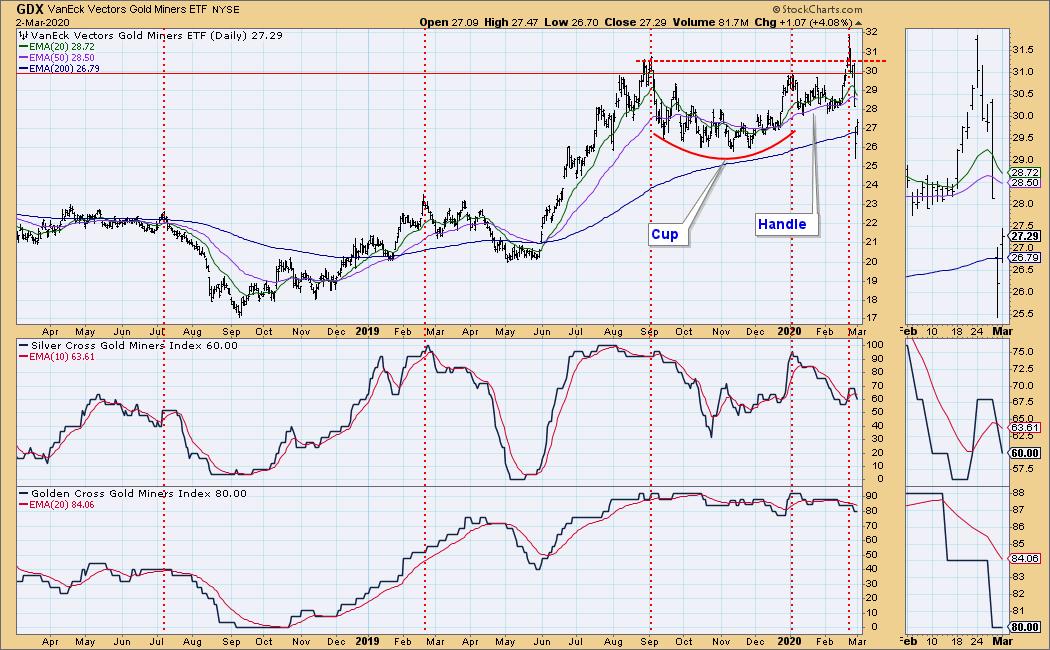
GOLD MINERS Golden and Silver Cross Indexes: Gold miners dove along with the market, but we do see that it did manage to get back above the 200-EMA. The Silver Cross Index is back in decline.
CRUDE OIL (USO)
IT Trend Model: Neutral as of 1/27/2020
LT Trend Model: BUY as of 12/16/2019
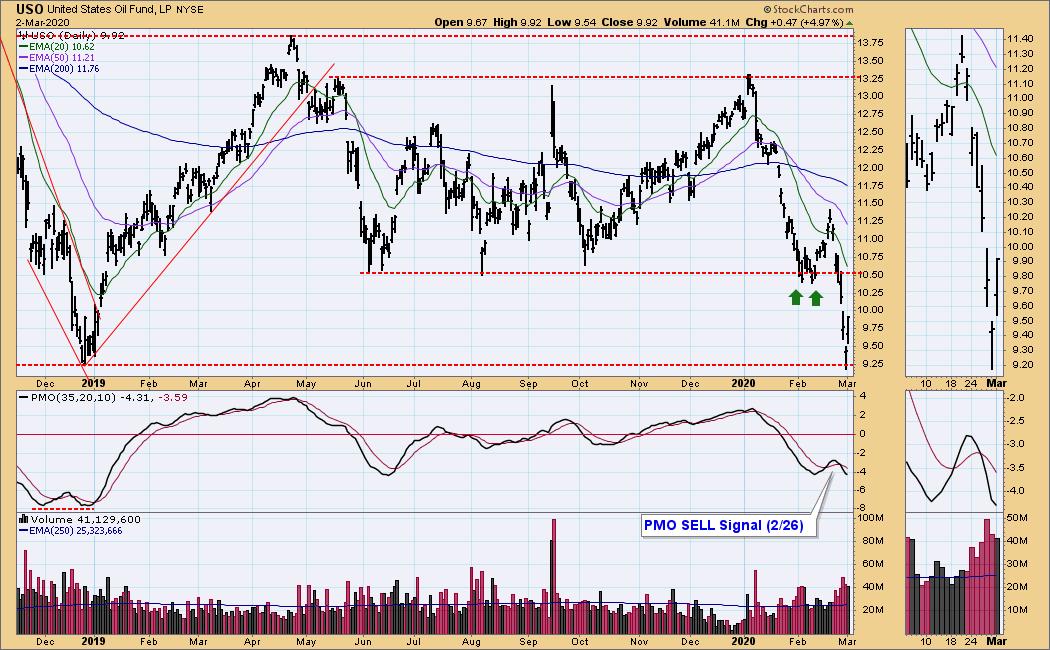
USO Daily Chart: This is the area of support I was looking at for a rally in Oil. Under 'normal' conditions, I would feel fairly confident in the strength of this support level. I don't given the backdrop of the coronavirus which is having an effect on China's industrial production.
BONDS (TLT)
IT Trend Model: BUY as of 1/22/2020
LT Trend Model: BUY as of 1/2/2019
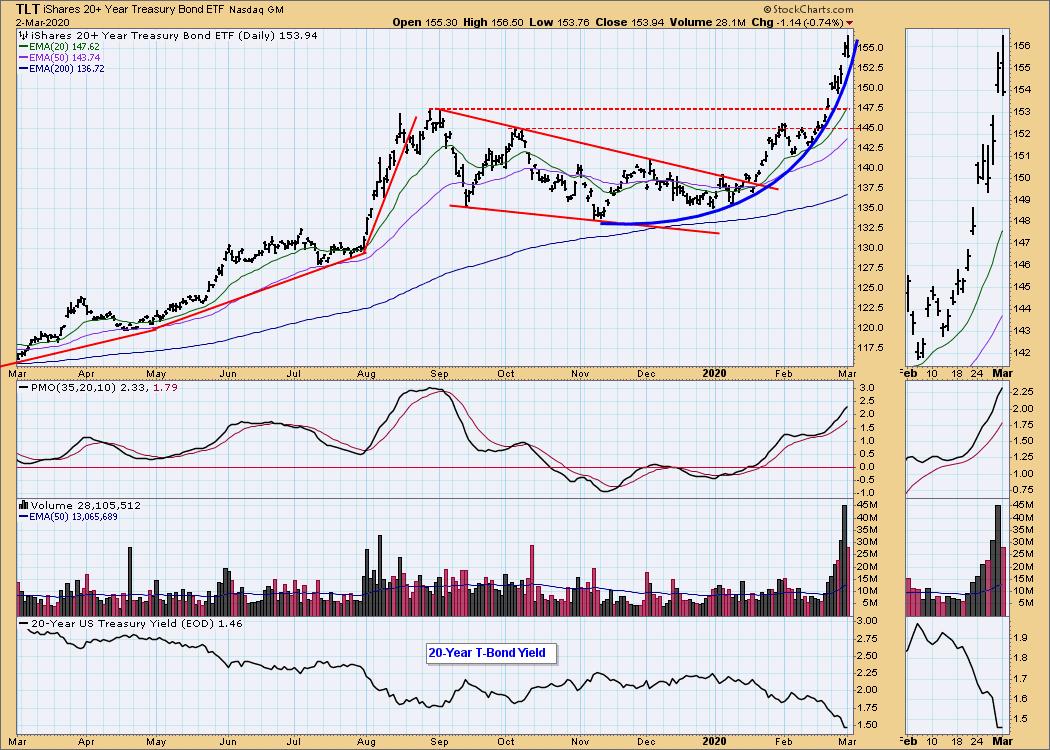
TLT Daily Chart: TLT continues to travel within a parabolic rally. We saw price pullback today, but the rising trend hasn't been compromised at all. This move is still vertical enough that I am expecting a breakdown, but given the fear factor in the market as a whole, this seems to be the one area that we are seeing a flight to safety. Yields are moving to historic lows and that bodes well for bond prices.
Have you subscribed the DecisionPoint Diamonds yet? DP does the work for you by providing handpicked stocks/ETFs from exclusive DP scans! Add it with a discount! Contact support@decisionpoint.com for more information!
Technical Analysis is a windsock, not a crystal ball.
Happy Charting! - Erin
Email: erin@decisionpoint.com

Erin Swenlin will be presenting at the The MoneyShow Las Vegas May 11-13, 2020! You'll have an opportunity to meet Erin and discuss the latest DecisionPoint news and Diamond Scans. The conference is free to attend or view online!
NOTE: The signal status reported herein is based upon mechanical trading model signals, specifically, the DecisionPoint Trend Model. They define the implied bias of the price index based upon moving average relationships, but they do not necessarily call for a specific action. They are information flags that should prompt chart review. Further, they do not call for continuous buying or selling during the life of the signal. For example, a BUY signal will probably (but not necessarily) return the best results if action is taken soon after the signal is generated. Additional opportunities for buying may be found as price zigzags higher, but the trader must look for optimum entry points. Conversely, exit points to preserve gains (or minimize losses) may be evident before the model mechanically closes the signal.
Helpful DecisionPoint Links (Can Be Found on DecisionPoint.com Links Page):
DecisionPoint Shared ChartList and DecisionPoint Chart Gallery
Price Momentum Oscillator (PMO)
Swenlin Trading Oscillators (STO-B and STO-V)