
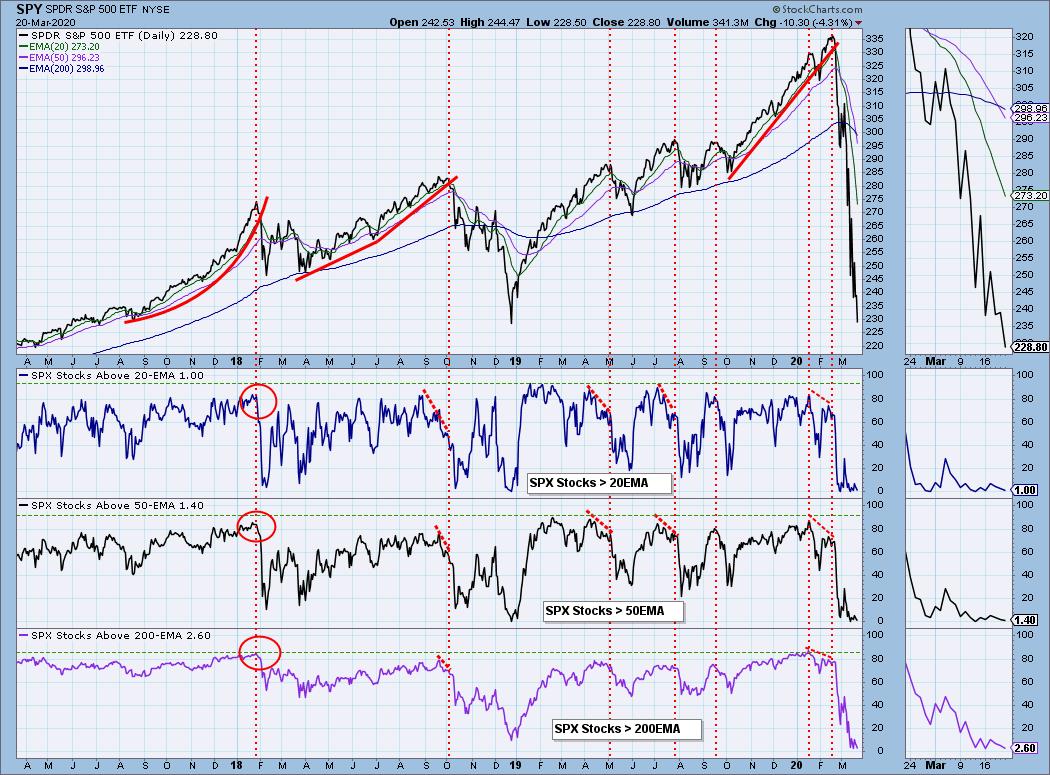
When internals get oversold, we normally expect a rally to materialize to at least clear the condition. I was looking at the chart showing oversold readings of the percentage of stocks above their 20/50/200EMA, and I realized here we have a different kind of oversold than with other indicators. The difference is that these indicators are based upon the "mechanical" movement of prices versus their moving averages, and once price crosses the EMA, it can stay there for a while as long as the trend persists. These indicators have finite ranges (zero to 100), and when they reach the bottom of the range, a relief rally in not an automatic outcome. In 2008-09 they were flat on the bottom for about five months.
Currently, all three indicators are near the bottom of their range. Because of this, they won't be giving us useful information until they start trending up. For now, they are telling us that all the switches are turned OFF, but they can't tell us if things will get worse. They can only tell us when the switches start turning back on. We have other indicators to give us clues for when a bottom may be in the cards.
The DecisionPoint Alert Weekly Wrap presents an end-of-week assessment of the trend and condition of the Stock Market, the U.S. Dollar, Gold, Crude Oil, and Bonds. The DecisionPoint Alert daily report (Monday through Thursday) is abbreviated and gives updates on the Weekly Wrap assessments.
Watch the latest episode of DecisionPoint on StockCharts TV's YouTube channel here!
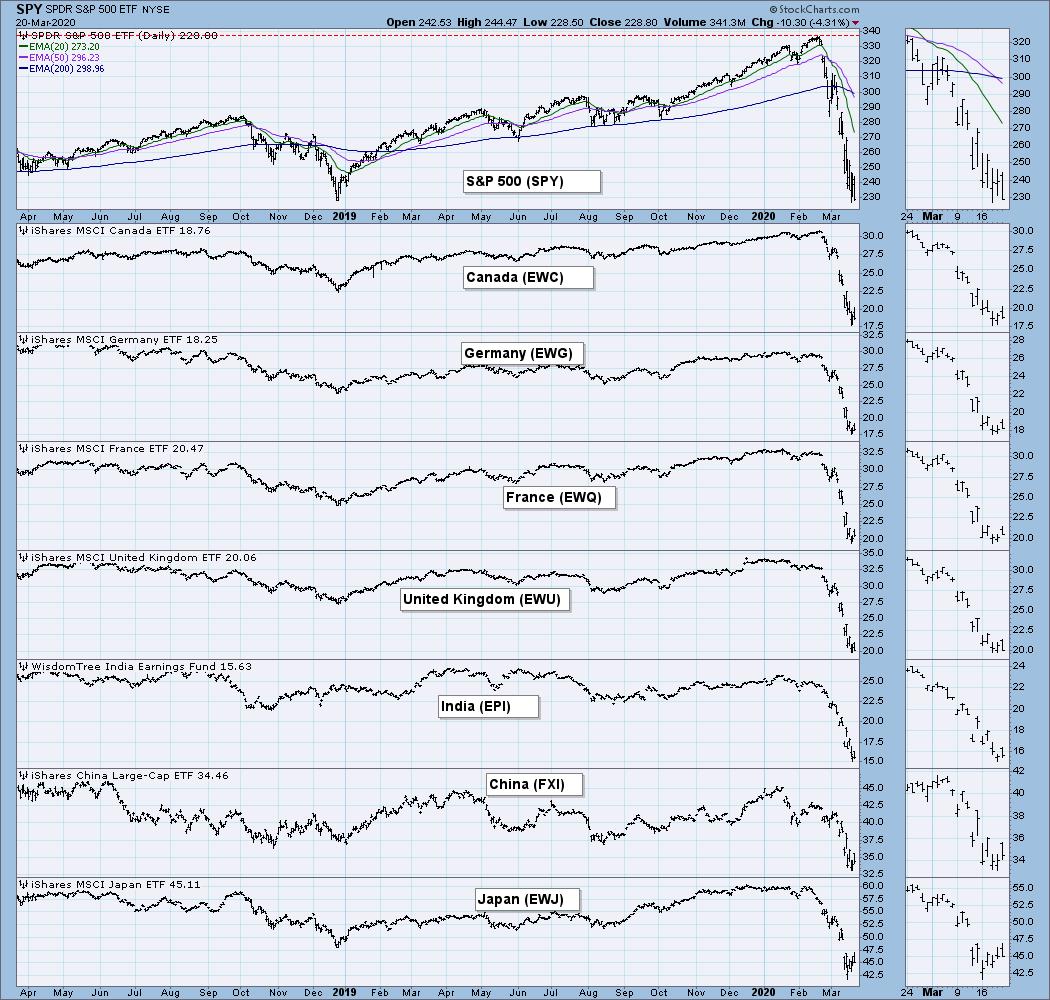
GLOBAL MARKETS
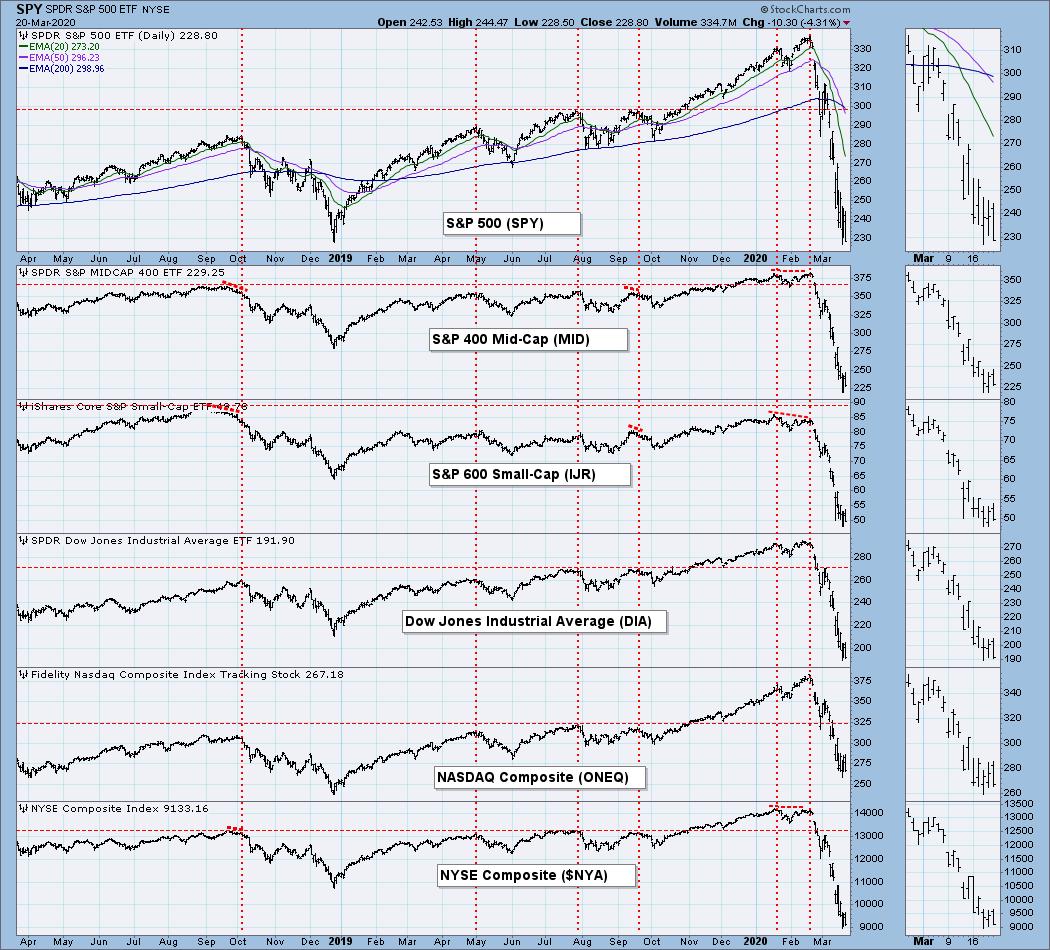
BROAD MARKET INDEXES
SECTORS
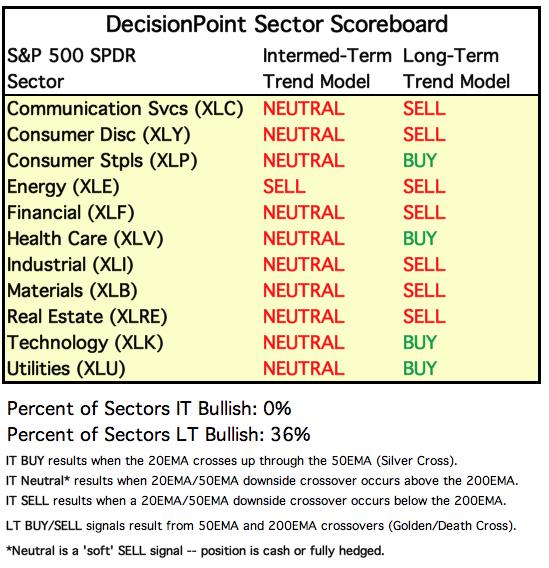
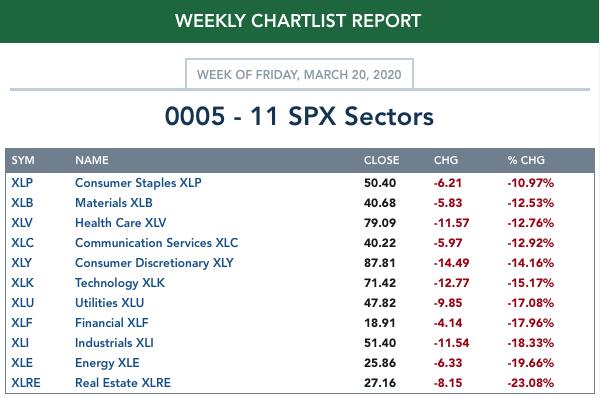
Each S&P 500 Index component stock is assigned to one, and only one, of 11 major sectors. This is a snapshot of the Intermediate-Term (Silver Cross) and Long-Term (Golden Cross) Trend Model signal status for those sectors.
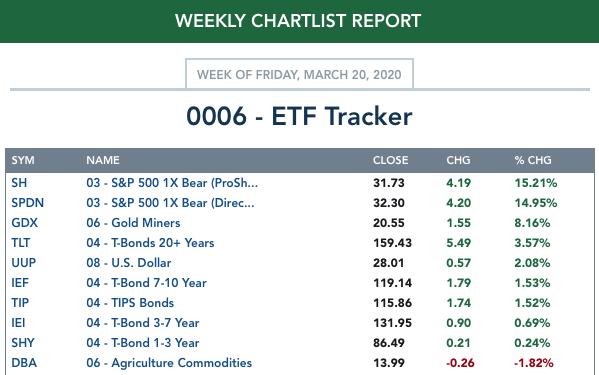
ETF TRACKER: This is a list of about 100 ETFs intended to track a wide range of U.S. market indexes, sectors, global indexes, interest rates, currencies, and commodities. StockCharts.com subscribers can acquire it in the DecisionPoint Trend and Condition ChartPack.
Top 10 . . .
. . . and bottom 10: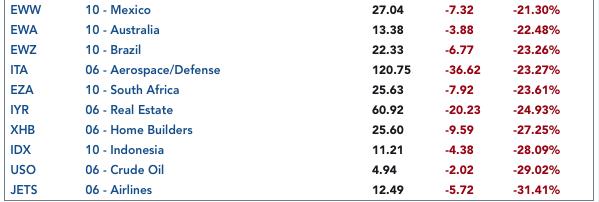
INTEREST RATES
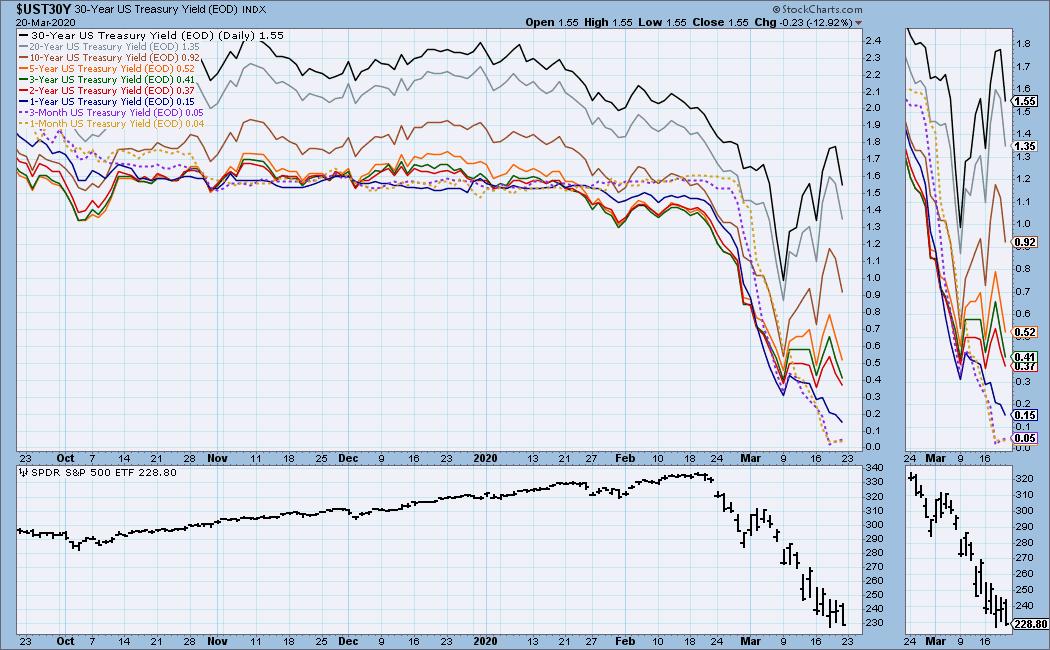
This chart is included so we can monitor rate inversions. In normal circumstances the longer money is borrowed the higher the interest rate that must be paid. When rates are inverted, the reverse is true.
STOCKS
IT Trend Model: NEUTRAL as of 2/28/2020
LT Trend Model: SELL as of 3/19/2020
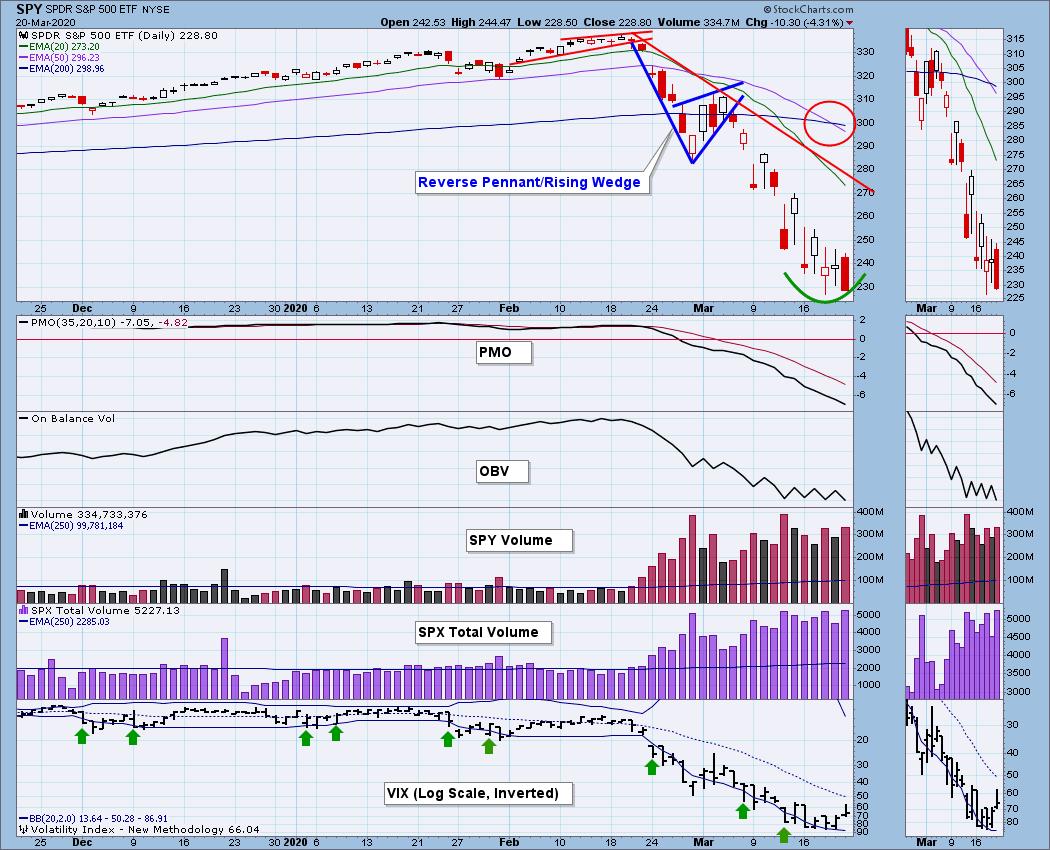
SPY Daily Chart: On Thursday the SPY 50EMA crossed down through the 200EMA (Death Cross), resulting in a LT Trend Model SELL signal. This was options expiration Friday, and S&P 500 Total Volume was more than twice the one-year daily average. It is interesting it doesn't stand out from other volume bars in March. The last three days SPY has held around 230, and we're potential short-term support there. (That's just me trying not to ignore any bullish signs. Ignore me on this point.)
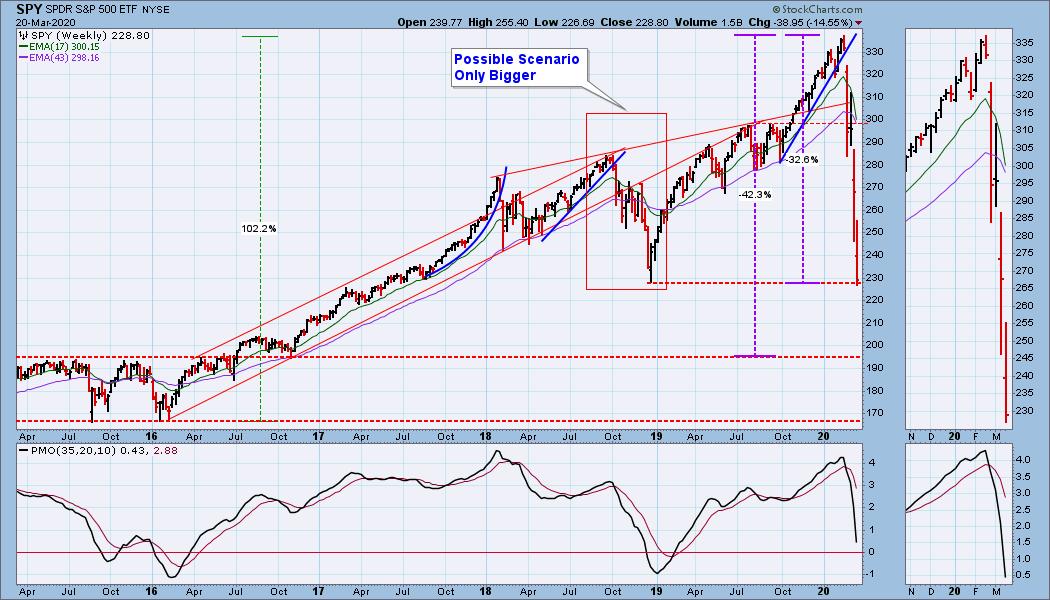
SPY Weekly Chart: The support line drawn across the 2018 cyclical bear market low came into play this week, and so far it has held.
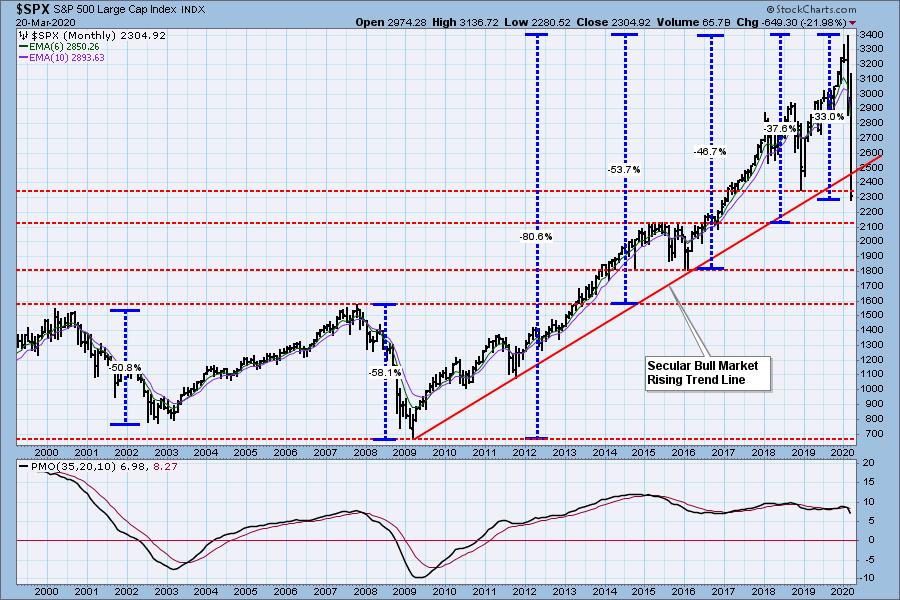
S&P 500 Monthly Chart: Since I have started looking at potential downside targets, I decided that an S&P 500 chart would be more appropriate for citing support levels. The 2350 support line has been penetrated, but not yet decisively; however, the secular bull market rising trend line has been thoroughly broken, and by that measure the secular bull marlet is definitely over.
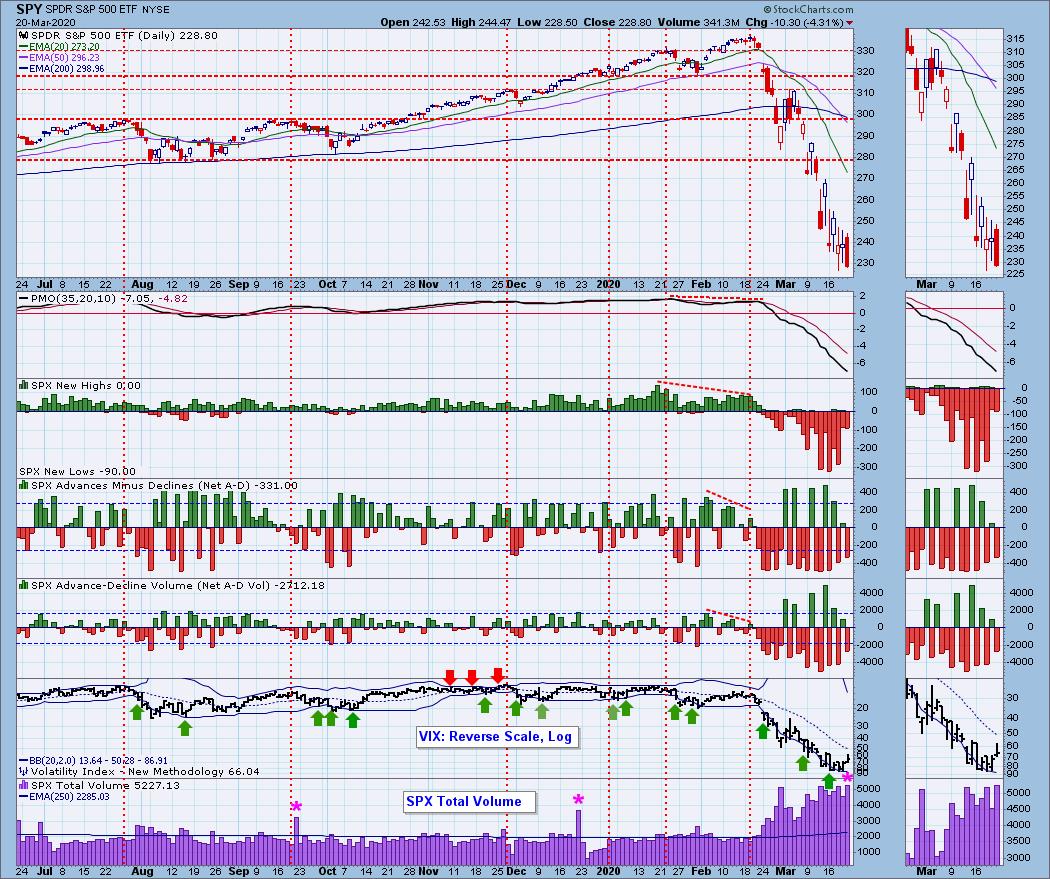
Climactic Market Indicators: The candlesticks for the last six days give the impression of being congested, as if price were resisting the decline. Coincidentally, SPY has reached a support level drawn across the 2018 low (see weekly chart).
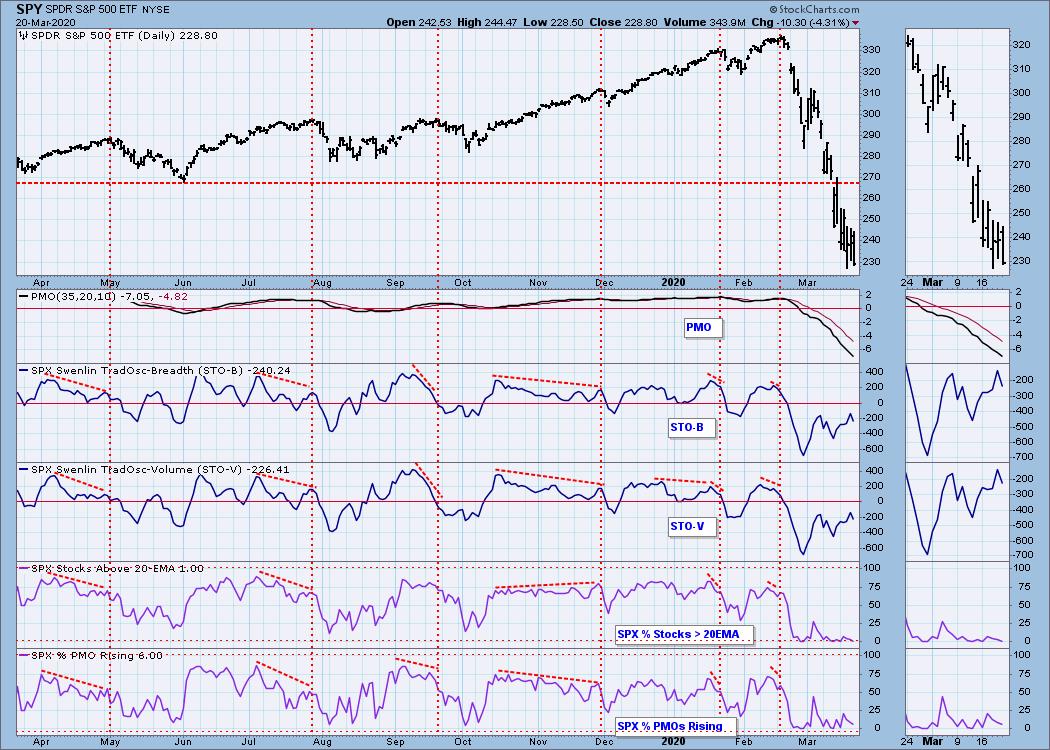
Short-Term Market Indicators: The short-term market trend is DOWN and the condition is OVERSOLD. The STO-B and STO-V this month show how deeply oversold readings can clear (indicator moves higher), even though the market continued down. This is very negative.
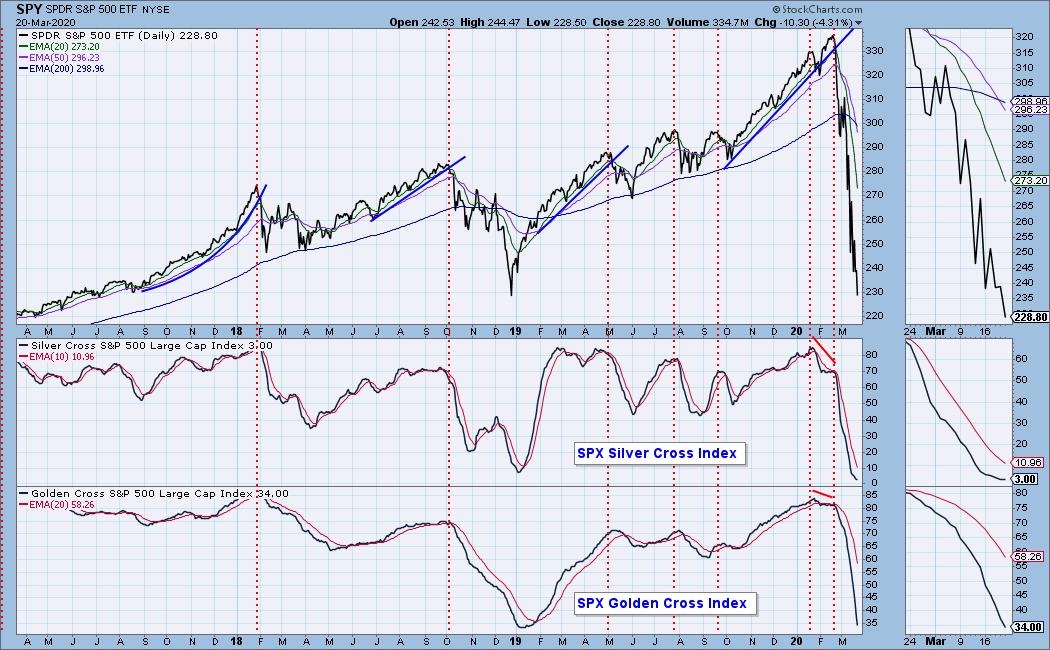
Intermediate-Term Market Indicators: My opening comments apply to these two idicators - the Silver Cross Index can't get much lower. The Golden Cross Index has reached the 2019 low, but I believe it will continue much lower.
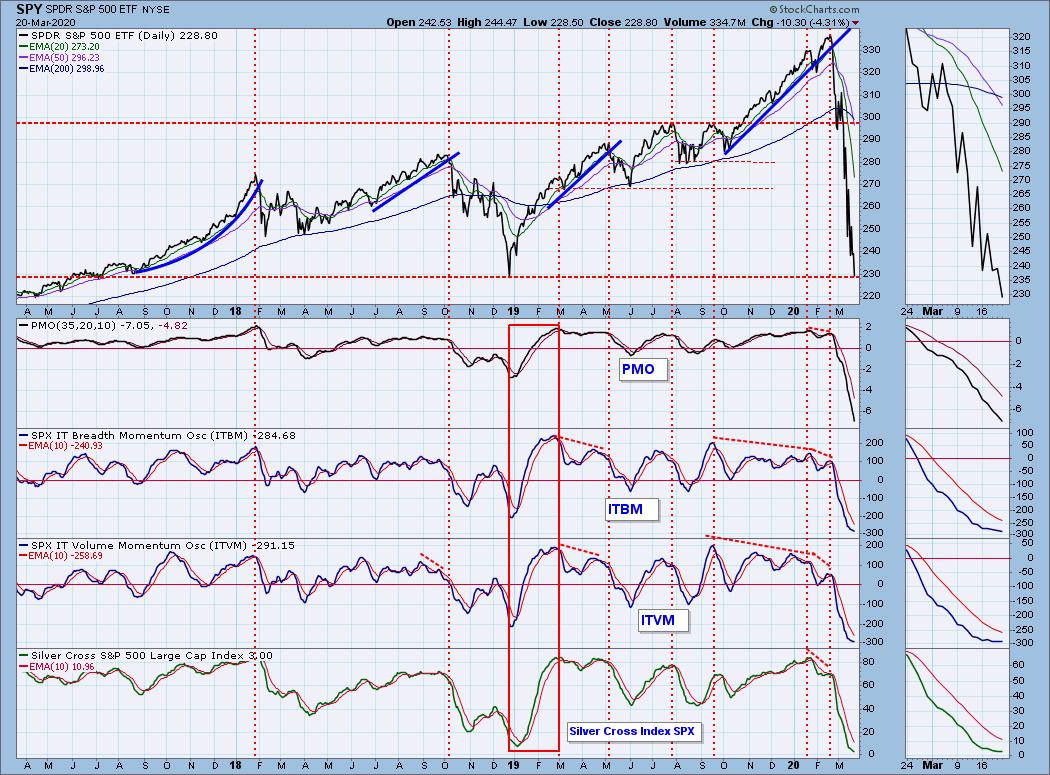
The intermediate-term market trend is DOWN and the condition is VERY OVERSOLD. The ITBM and ITVM are decelerating. The ITBM is at the second lowest reading of the last 20 years -- the lowest being immediately after 9/11. The ITVM equals its 9/11 reading -- the lowest in 20 years. The oversold readings of PMO, ITBM and ITVM will probably be relieved somewhat, but it isn't likely to result in a rip-roaring rally.
CONCLUSION: The trend is DOWN and the market condition is OVERSOLD, especially in the intermediate-term. It is a good setup for a rally, but, other than some one- or two-day pop, I can't see that happening. This CORVID-19 thing is really, really bad, and it has come along when interest rates have been kept unreasonably low in order to keep real estate prices and the stock market unreasonably high. People are learning that "you can't fool Mother Nature," at least not forever.
The market has already fallen -33%, and I think -55% is a sure thing, unless we get some very good news very soon. The best outcome I can imagine at this point, is for the market to move sideways for a while -- great big up and down slashes. But remember, oversold conditions in a bear market can't always be relied upon to produce rallies. Sometimes we should think of an oversold market as a spring that extends one last time, and fails from fatigue. Nothing good comes from that.
The most compelling technical dynami
Have you subscribed the DecisionPoint Diamonds yet? DP does the work for you by providing handpicked stocks/ETFs from exclusive DP scans! Add it with a discount! Contact support@decisionpoint.com for more information!
DOLLAR (UUP)
IT Trend Model: BUY as of 3/13/2020
LT Trend Model: BUY as of 5/25/2018
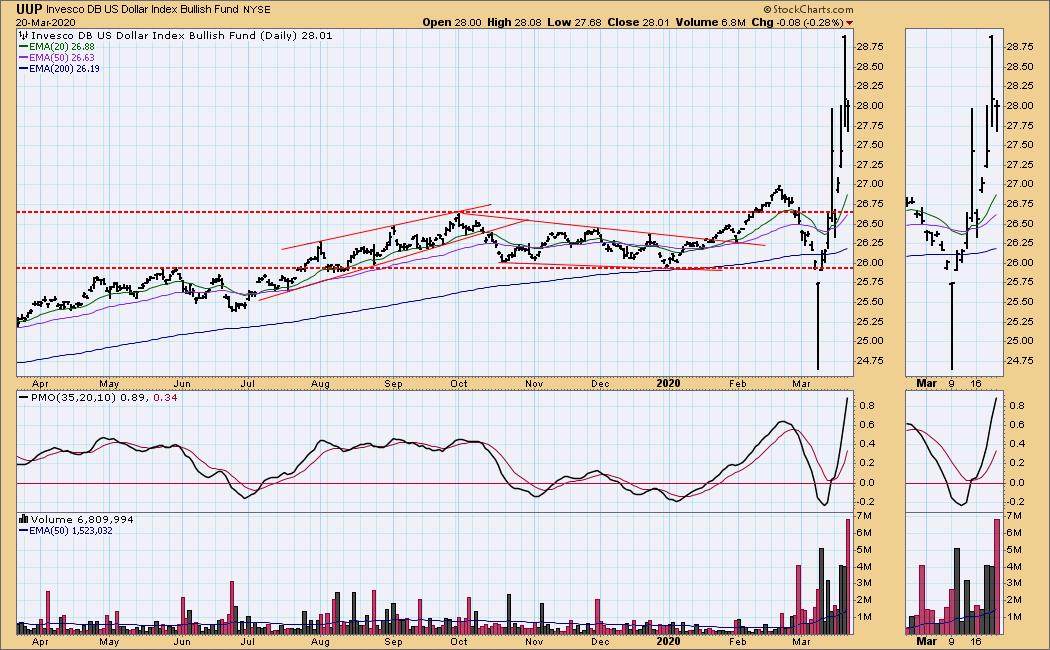
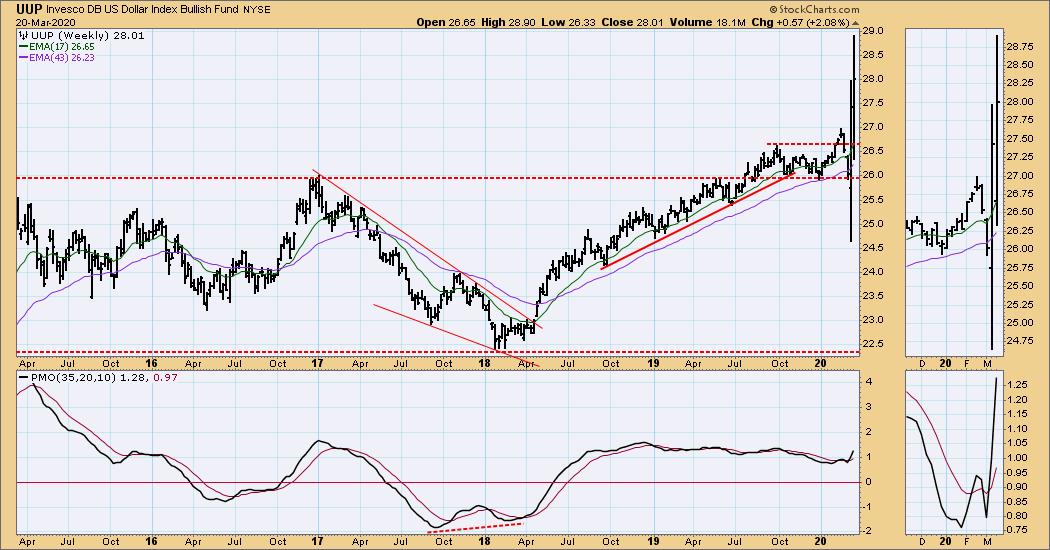
UUP Daily Chart: It is hard to decipher the wild swings of UUP over the last few weeks. At first I thought this was due to ETF strangeness that we see on rare occasions, but if you check a $USD chart, you'll see it's for real. If you ignore the the low bar on March 9, the trend is up. But it is vertical, so it's probably not for long.
UUP Weekly Chart: I don't know how this is going to play out, but my guess is that the vertical move resolves downward.
GOLD
IT Trend Model: NEUTRAL as of 3/20/2020
LT Trend Model: BUY as of 1/8/2019
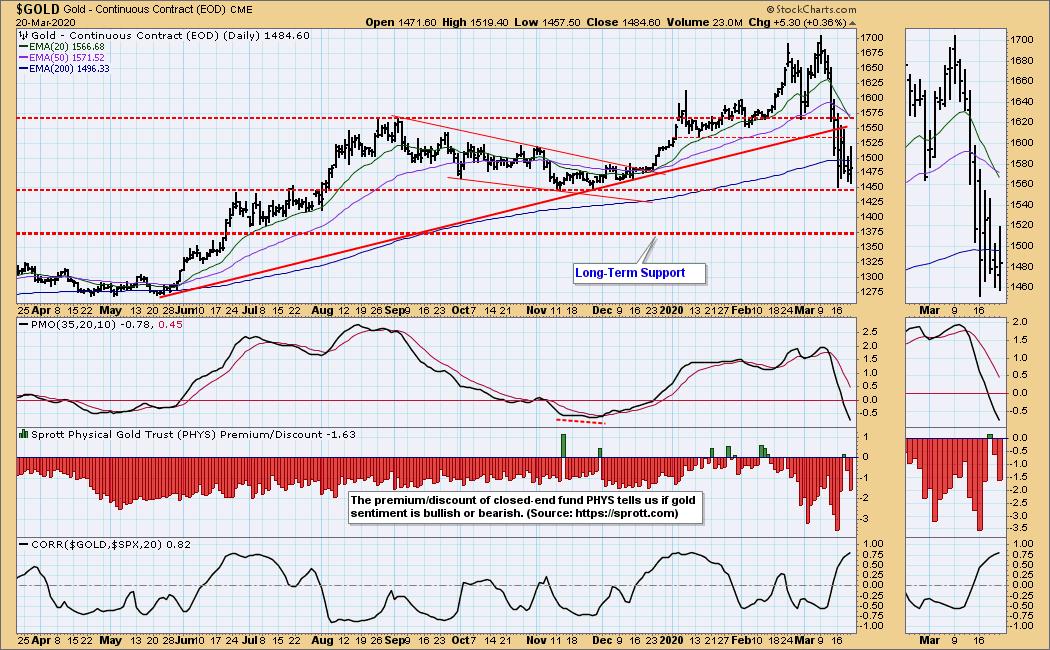
GOLD Daily Chart: Gold has remained above the 1450 support line, but today it had a 20/50EMA downside crossover, changing the IT Trend Model to NEUTRAL. You will notice that I have changed the correlation reference from the dollar to the S&P 500.
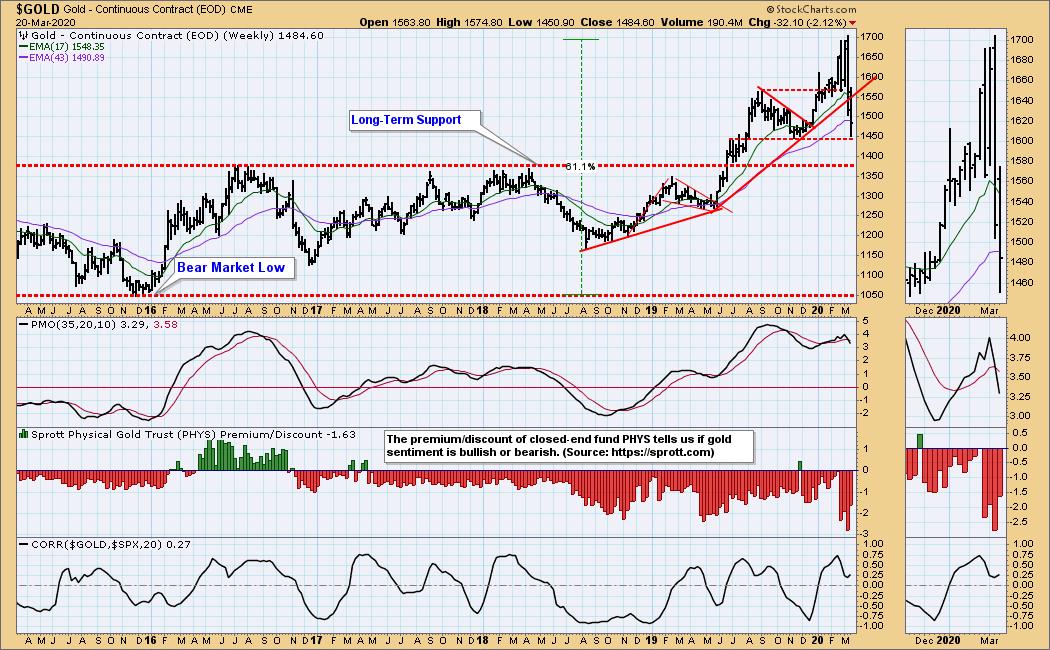
GOLD Weekly Chart: The most important support is at 1375. If that is violated, we would have to consider that gold has entered a bear market.
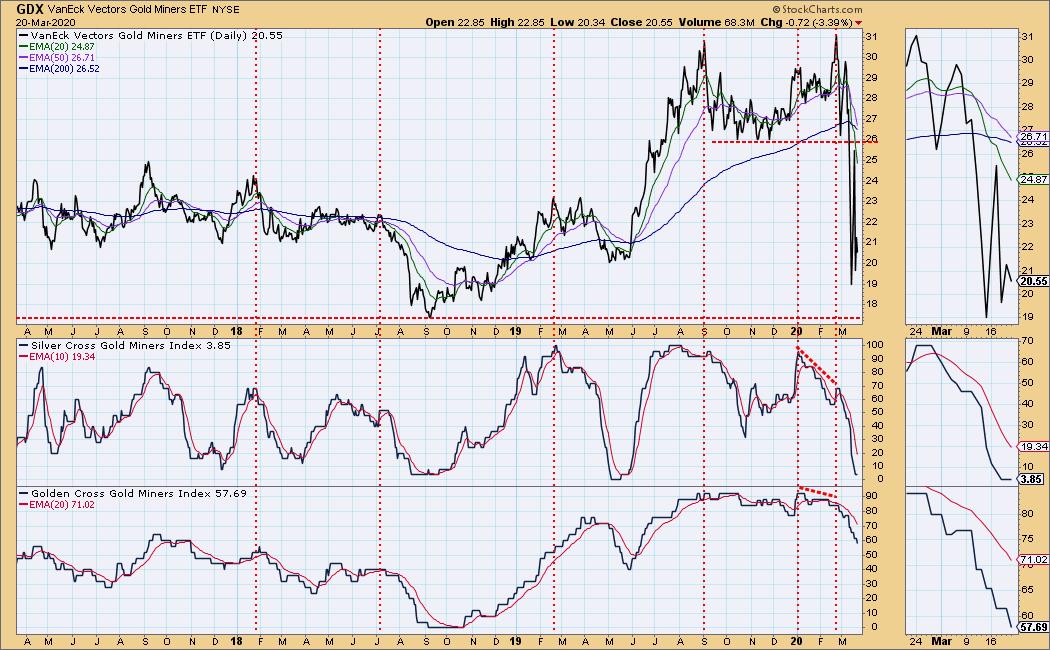
GOLD MINERS Golden and Silver Cross Indexes: The Silver Cross Index is almost to zero, but it can stay there for weeks.
CRUDE OIL (USO)
IT Trend Model: NEUTRAL as of 1/27/2020
LT Trend Model: SELL as of 2/3/2020
USO Daily Chart: Oil has been in a crash mode for more than two weeks. As of Friday it looked a tiny bit bottomy, but the daily PMO shows no sign of a bottom.
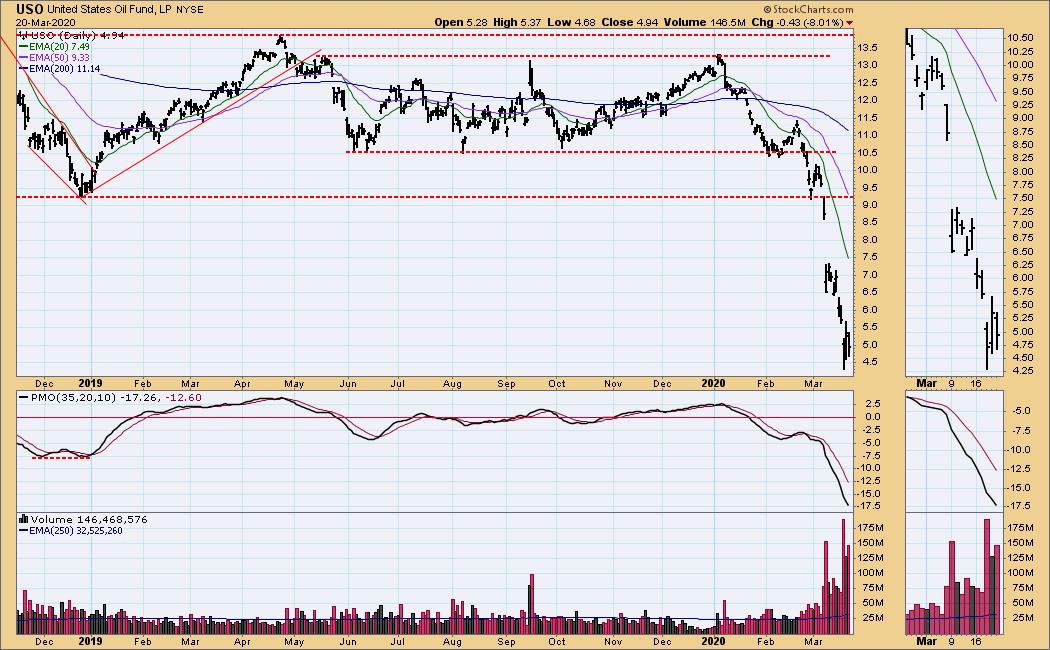
USO Weekly Chart: The support lines drawn across the 2016 lows have been violated, and we need to look in a longer-term time frame to find the next support.
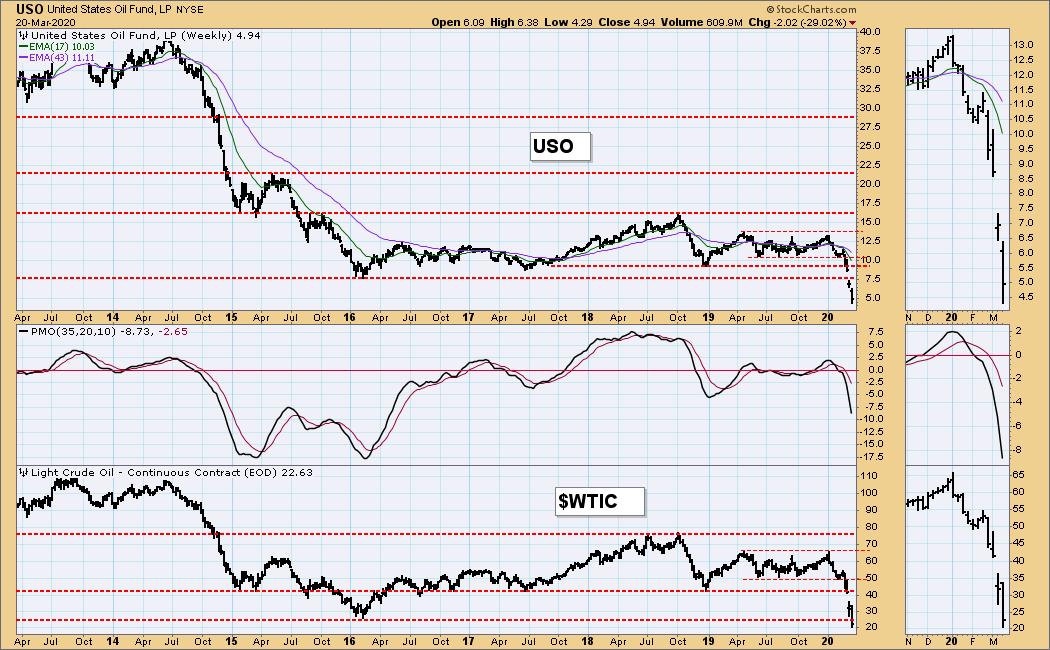
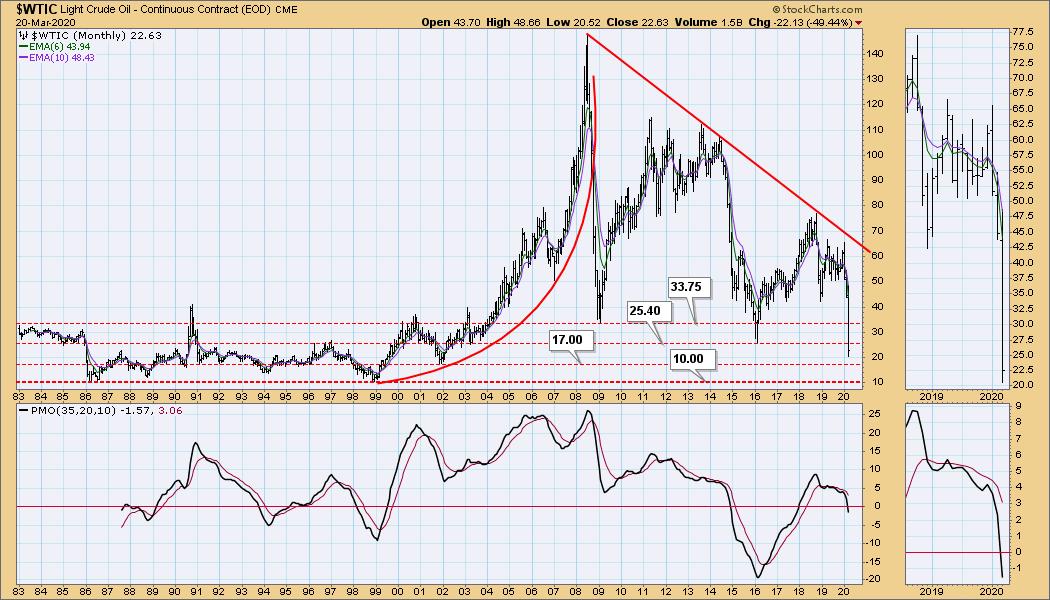
WTIC Monthly Chart: USO is a handy trading vehicle, but when people think of the price of oil, they think in terms of price per barrel, so we'll use $WTIC to find the psychological support levels with historical significance. The most obvious support level is at a line drawn across the 1986 and 1998 lows -- 10.00. That is not my price target per se, but it is not out of the question that it may be challenged. I will carry this chart until it is clear that oil is recovering.
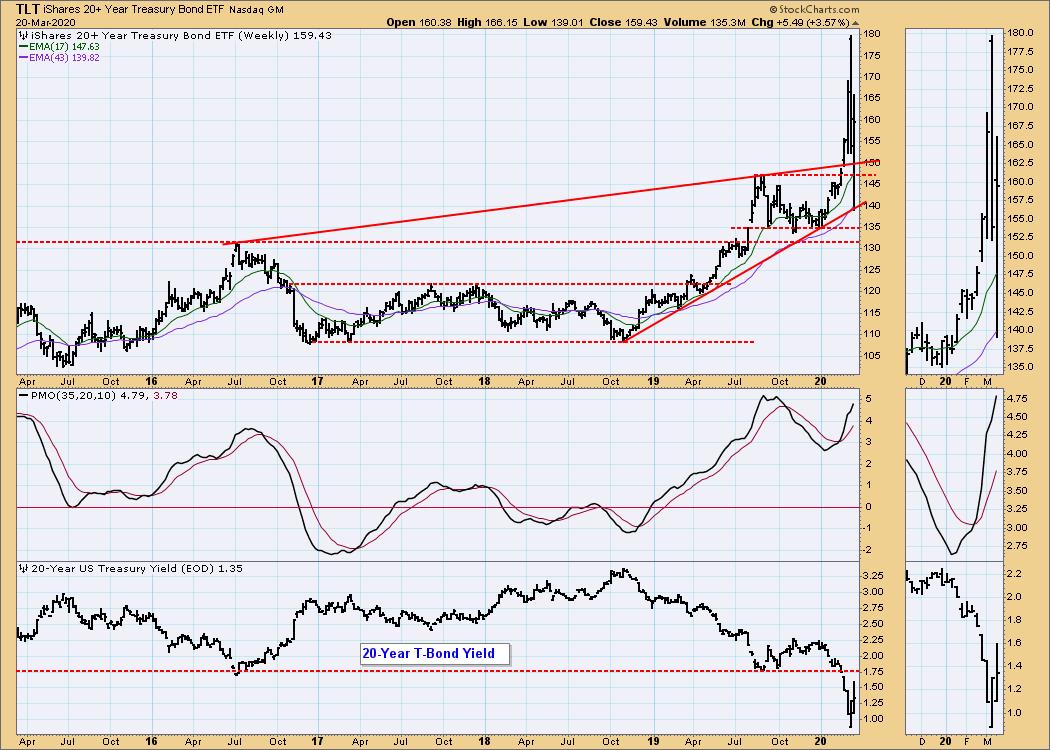
BONDS (TLT)
IT Trend Model: BUY as of 1/22/2020
LT Trend Model: BUY as of 1/2/2019
TLT Daily Chart: Once again, we see a parabolic advance resolve with a sharp decline.
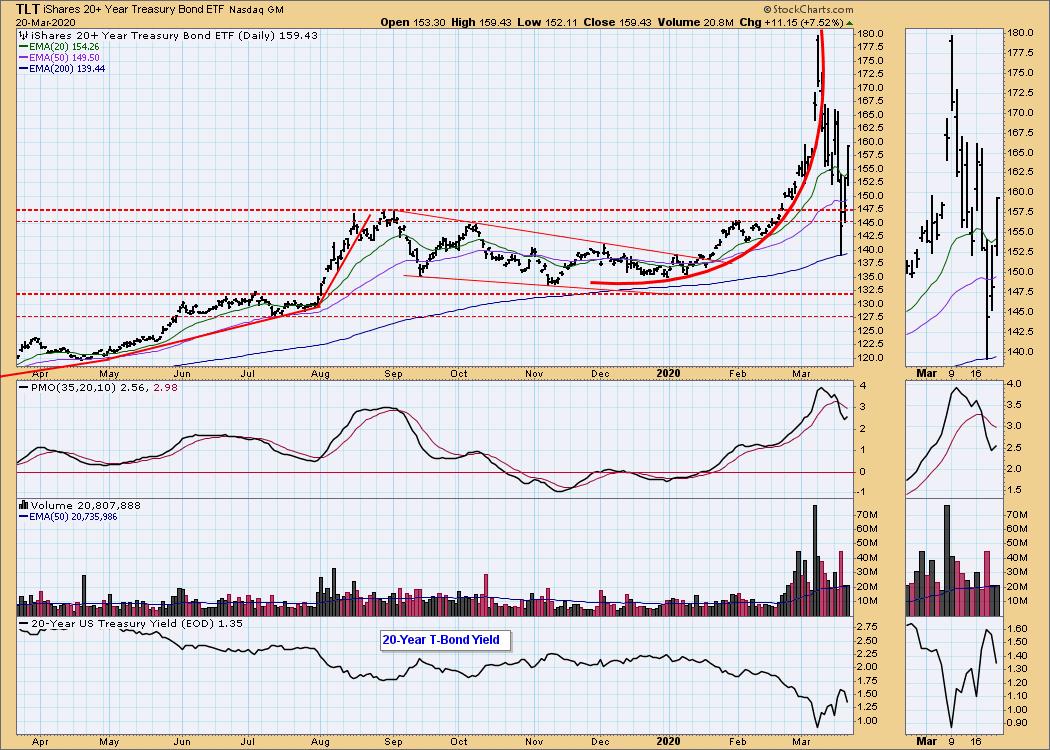
TLT Weekly Chart: In the longer-term view we can see that TLT has retreated to a rising trend line. Beyond that I think we should be prepared for more volatility.
Technical Analysis is a windsock, not a crystal ball.
Happy Charting! - Carl
NOTE: The signal status reported herein is based upon mechanical trading model signals, specifically, the DecisionPoint Trend Model. They define the implied bias of the price index based upon moving average relationships, but they do not necessarily call for a specific action. They are information flags that should prompt chart review. Further, they do not call for continuous buying or selling during the life of the signal. For example, a BUY signal will probably (but not necessarily) return the best results if action is taken soon after the signal is generated. Additional opportunities for buying may be found as price zigzags higher, but the trader must look for optimum entry points. Conversely, exit points to preserve gains (or minimize losses) may be evident before the model mechanically closes the signal.
Helpful DecisionPoint Links:
DecisionPoint Alert Chart List
DecisionPoint Golden Cross/Silver Cross Index Chart List
DecisionPoint Sector Chart List
Price Momentum Oscillator (PMO)
Swenlin Trading Oscillators (STO-B and STO-V)