
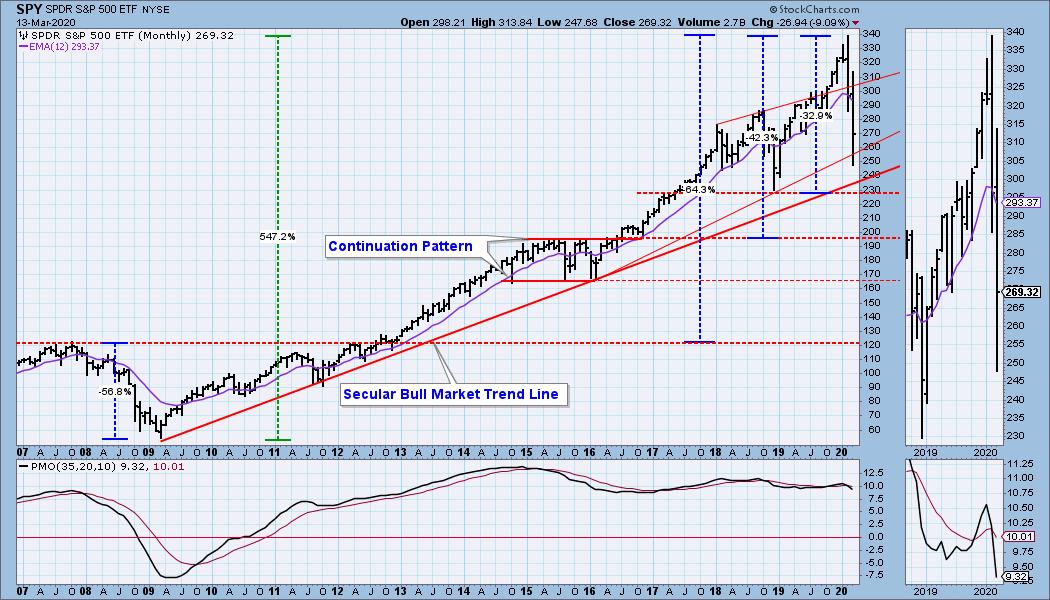
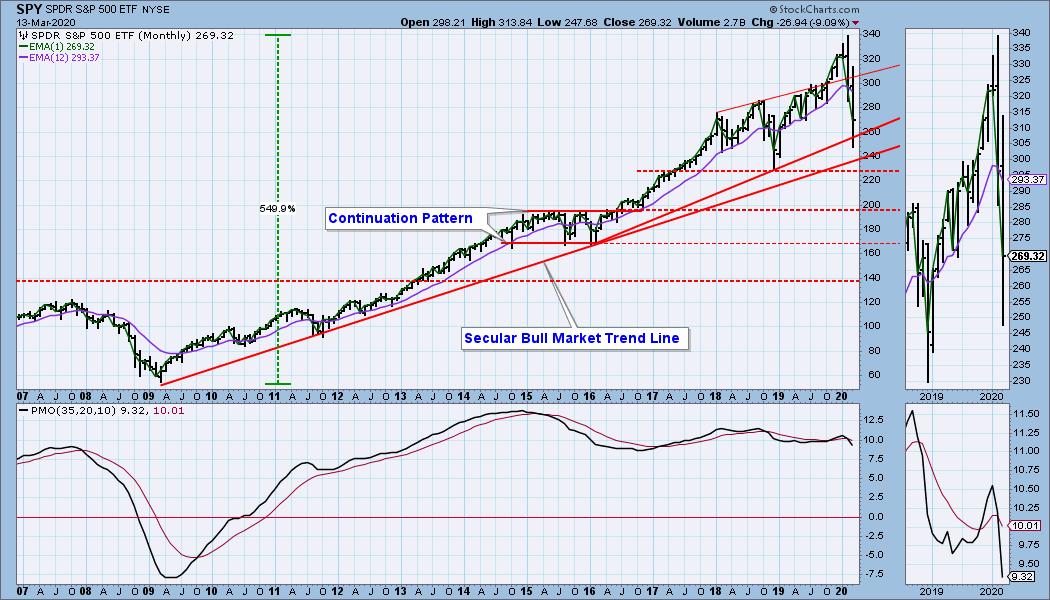
On our Monday StockCharts TV show, Erin and I discussed potential downside targets for the stock market, and it is time I covered that subject here. A decline of -33% (SPX 2500) will bring price to the first significant support at a line drawn across the cyclical bear market low in 2018. Price will encounter the secular bull market rising trend line first, but I think the horizontal support is more compelling. It will require a decline of -42% (SPX 2100) to reach the top of the 2015/16 consolidation pattern. And, finally, a decline of -64% will take the market to a line drawn across the 2007 bull market top (SPX 1550). I do not insist that any of these levels will be reached, but considering that the 2007-2009 Bear Market decline was about -57%, none of these target levels are unreasonable.
Let's see how these support levels relate to the earnings chart: The top support level gets price inside the normal P/E range, the mid-level support is near fair value, and the lowest level gets near undervalue. In a rational world this makes sense. But the S&P 500 hasn't been at fair value since 1984.
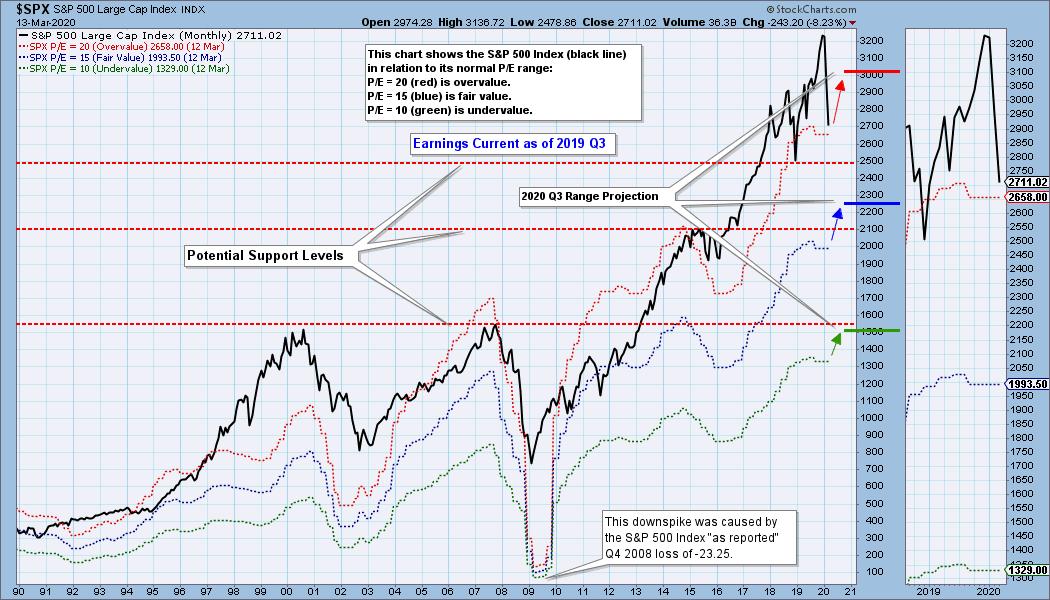
* This chart shows us the normal value range of the S&P 500 Index, indicating where the S&P 500 would have to be in order to have an overvalued P/E of 20 (red line), a fairly valued P/E of 15 (blue line) or an undervalued P/E of 10 (green line). There are three hash marks on the right side of the chart, which show where the range markers are projected be at the end of 2020 Q3.
The DecisionPoint Alert Weekly Wrap presents an end-of-week assessment of the trend and condition of the Stock Market, the U.S. Dollar, Gold, Crude Oil, and Bonds. The DecisionPoint Alert daily report (Monday through Thursday) is abbreviated and gives updates on the Weekly Wrap assessments.
Watch the latest episode of DecisionPoint on StockCharts TV's YouTube channel here!
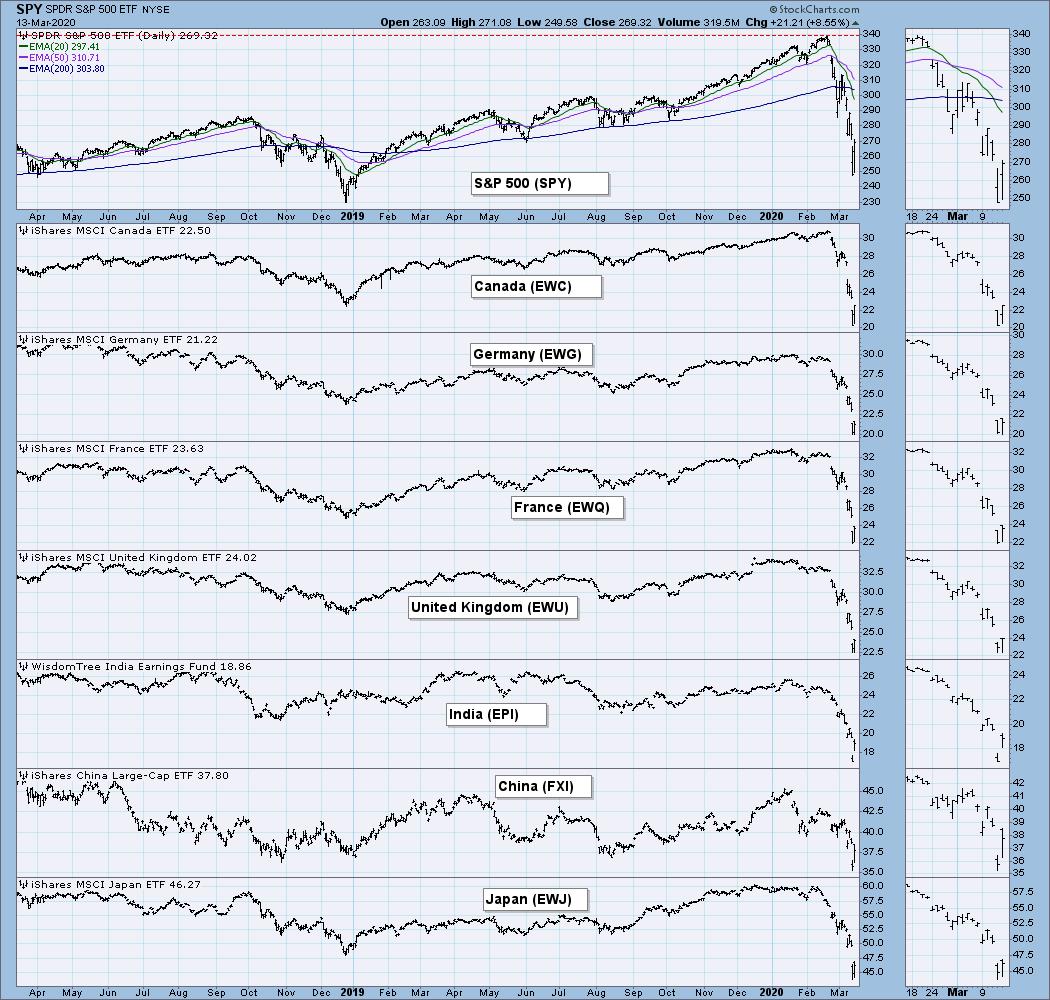
GLOBAL MARKETS
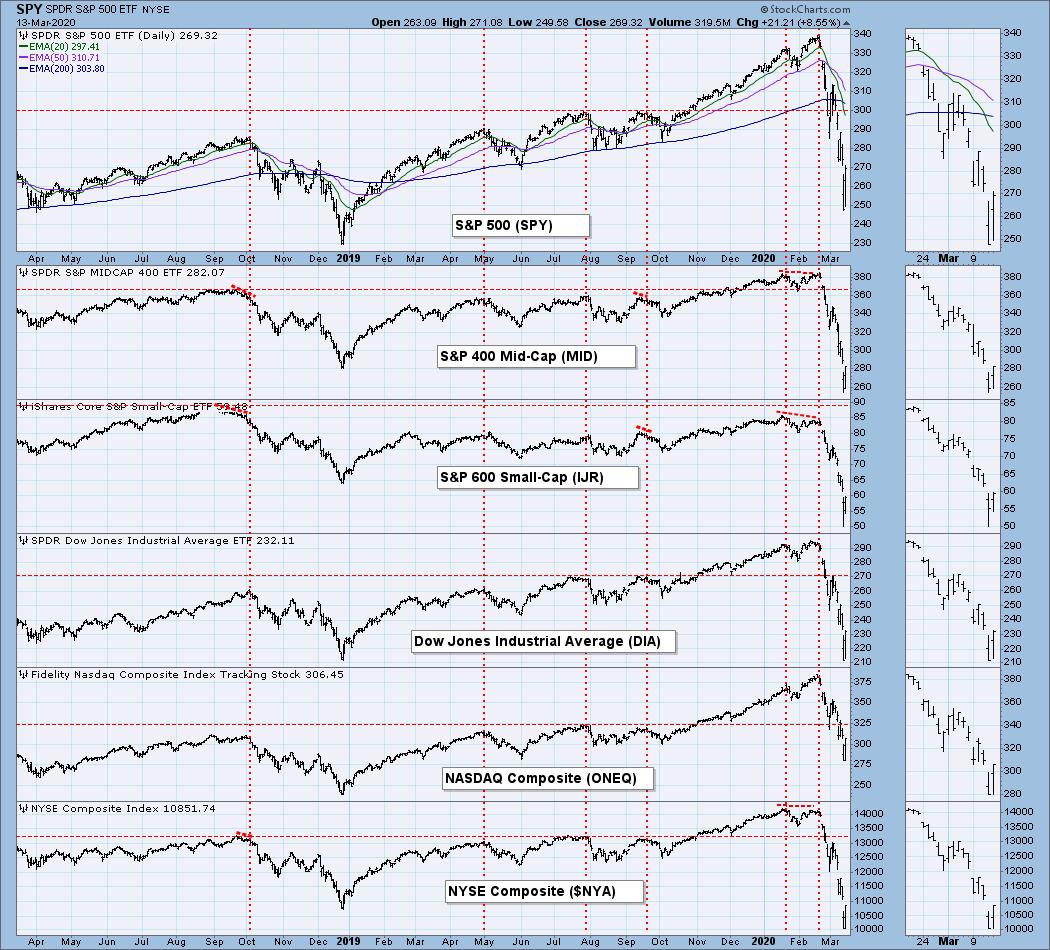
BROAD MARKET INDEXES
SECTORS
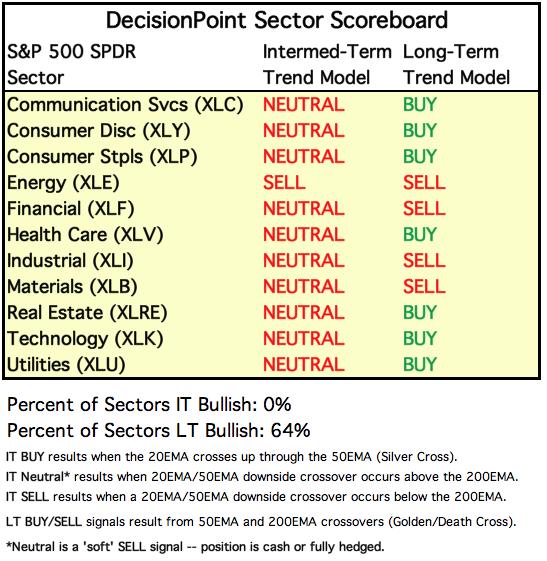
Each S&P 500 Index component stock is assigned to one, and only one, of 11 major sectors. This is a snapshot of the Intermediate-Term (Silver Cross) and Long-Term (Golden Cross) Trend Model signal status for those sectors.
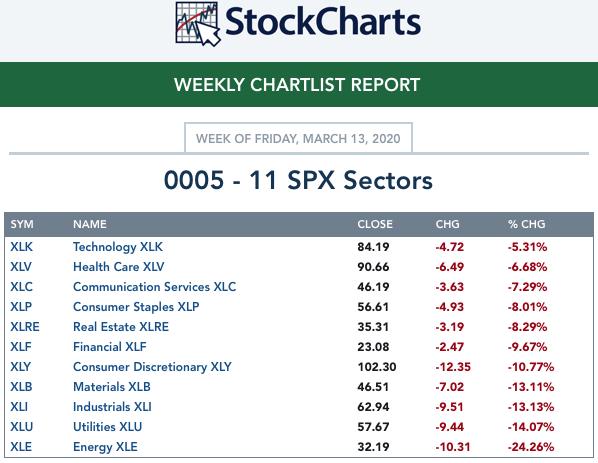
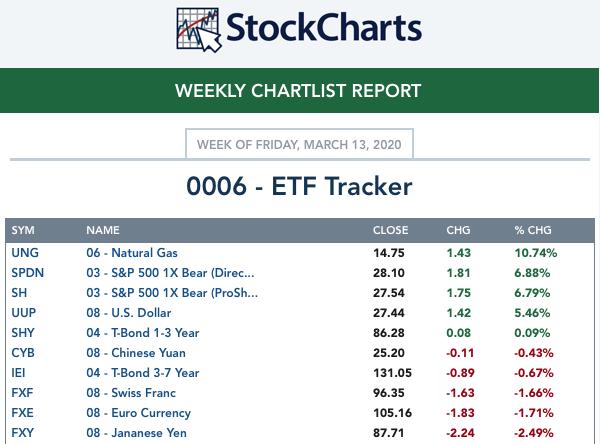
ETF TRACKER: This is a list of about 100 ETFs intended to track a wide range of U.S. market indexes, sectors, global indexes, interest rates, currencies, and commodities. StockCharts.com subscribers can acquire it in the DecisionPoint Trend and Condition ChartPack.
Top 10 . . .
. . . and bottom 10: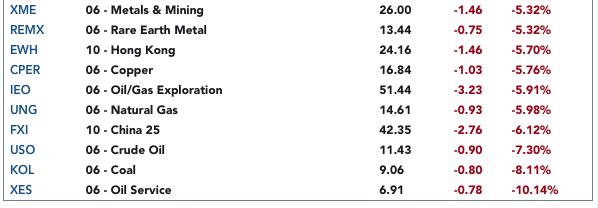
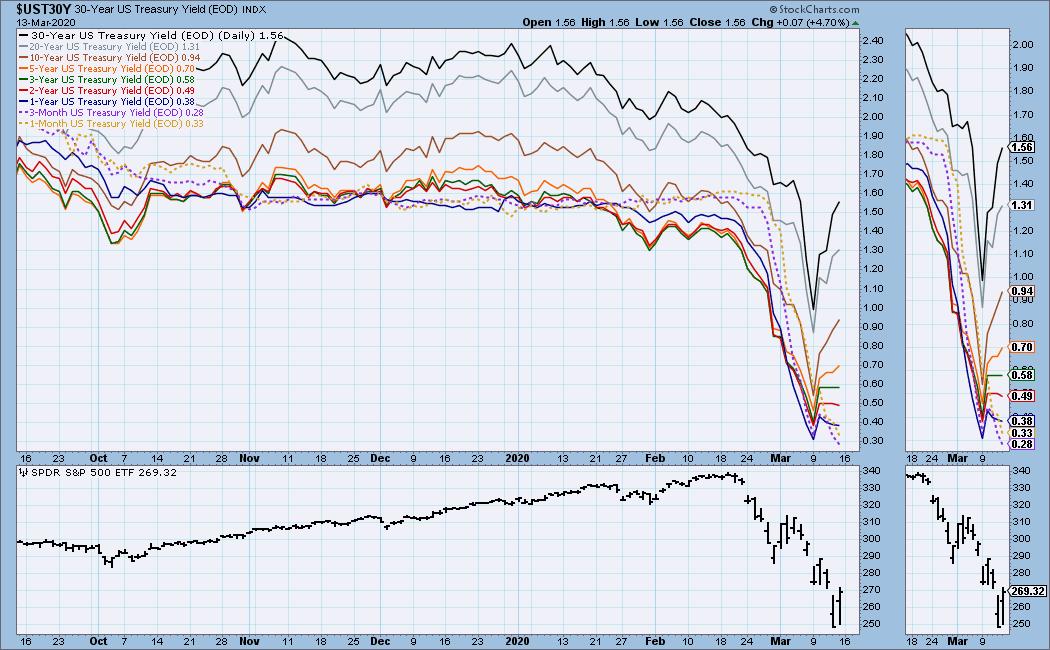
INTEREST RATES
This chart is included so we can monitor rate inversions. In normal circumstances the longer money is borrowed the higher the interest rate that must be paid. When rates are inverted, the reverse is true.
STOCKS
IT Trend Model: NEUTRAL as of 2/28/2020
LT Trend Model: BUY as of 2/26/2019
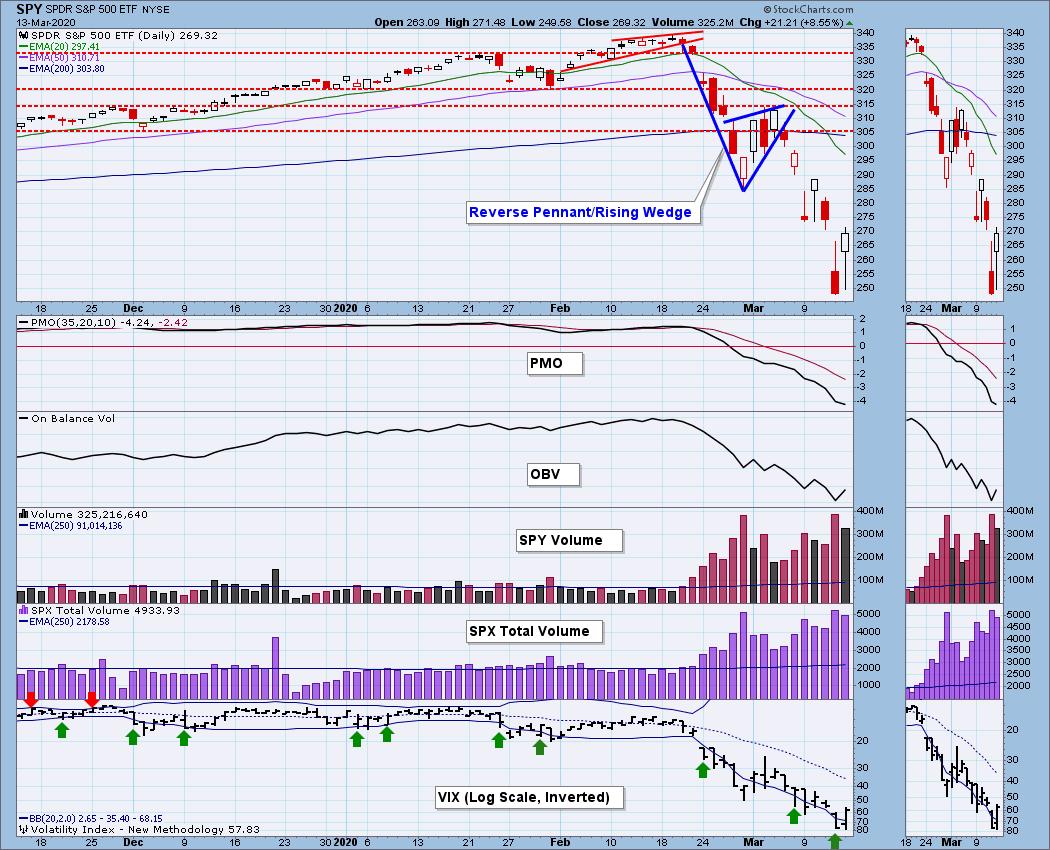
SPY Daily Chart: We have had three weeks of incredibly volatile action, which was capped by a -10% down day followed by a +9% up day. This week's SPX daily volume has been about 2.6 times the one-year daily average.
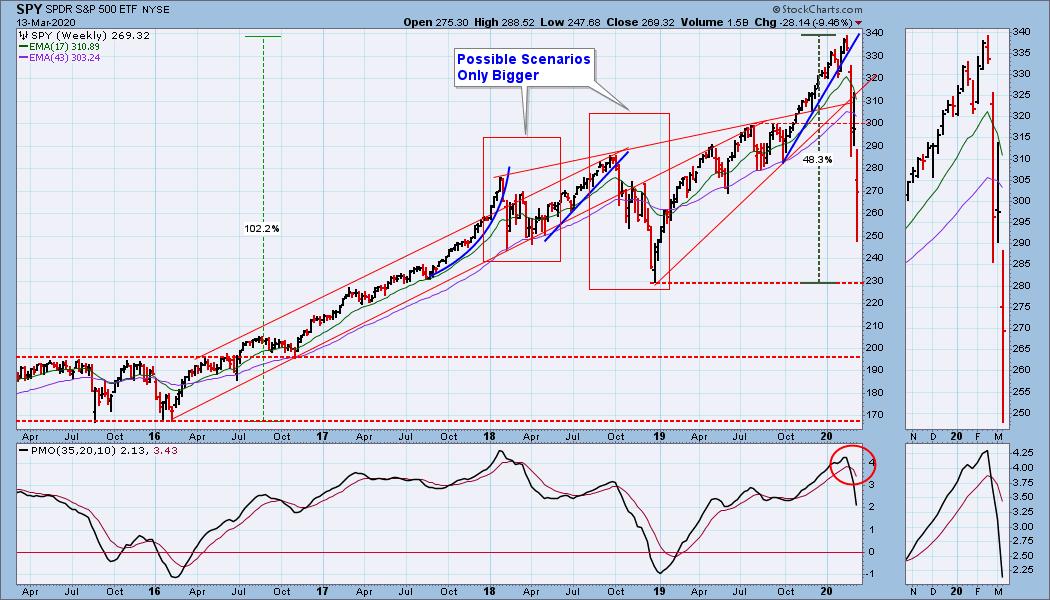
SPY Weekly Chart: I'm still thinking that the bear market outcome might be like one of the two examples I have boxed on this chart. If the one to the right is how it goes, then there is a lot more downside to come after several weeks of wide chopping.
SPY Monthly Chart: I don't normally have a monthly chart in the Weekly Wrap, but I thought it interesting how close price has come down to the secular bull market rising trend line. It has not been too many weeks ago that I wondered how long it would be before this happened. I never thought it would be as fast as it did.
Climactic Market Indicators: For three weeks there have been climactic moves in both directions (but mostly down), and there has been a fair amount of unanimity among the indicators. In a down trend we look for exhaustion climaxes to help us find price bottoms, but we have had too many of them, and the bottoms they flagged were only fleeting, if they were bottoms at all.
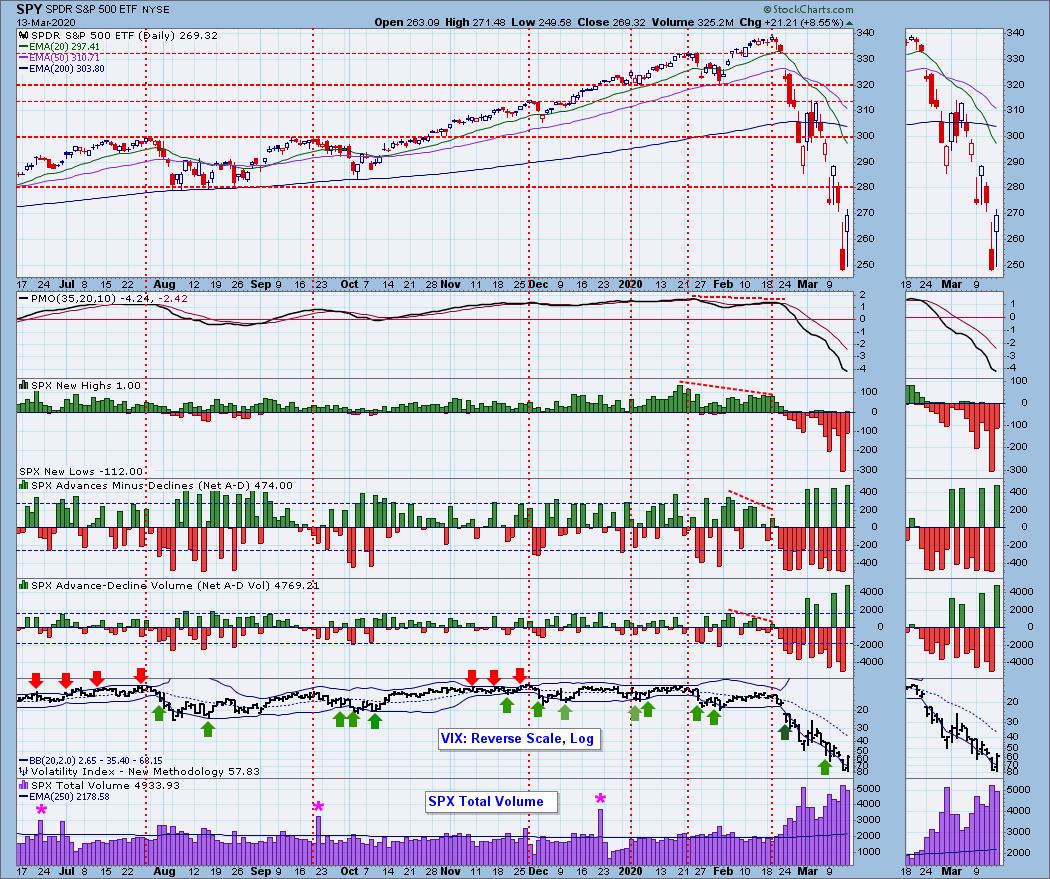
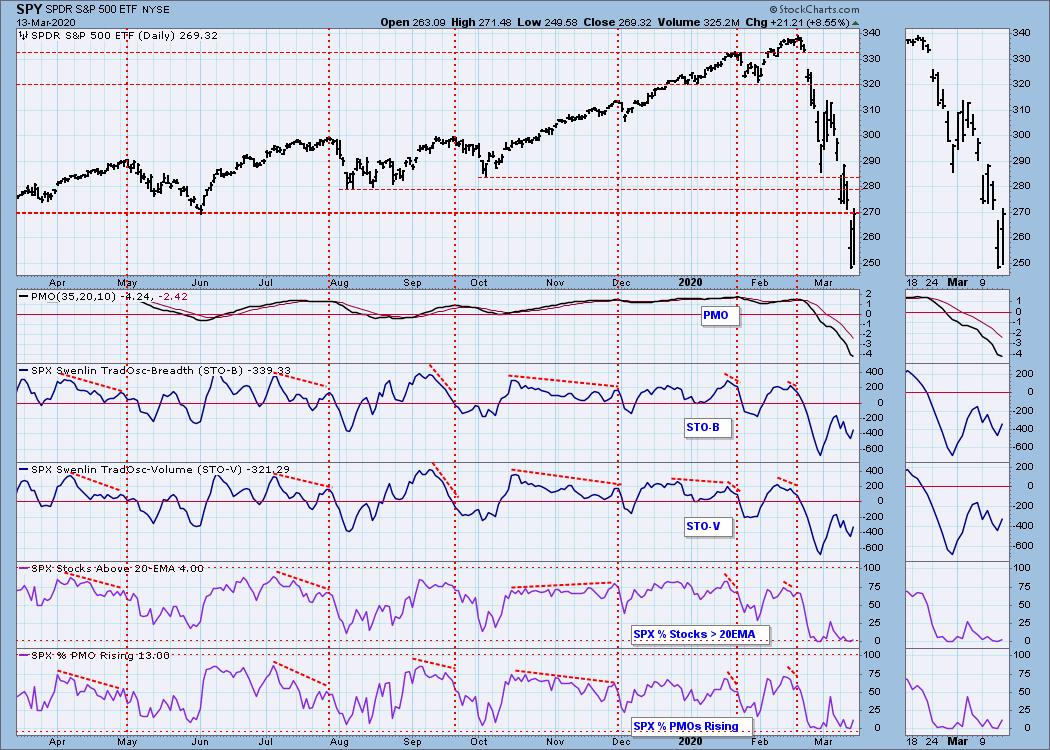
Short-Term Market Indicators: The short-term market trend is DOWN and the condition is OVERSOLD. We can/will see short-term bounces, but I don't think any of them will break the bear market.
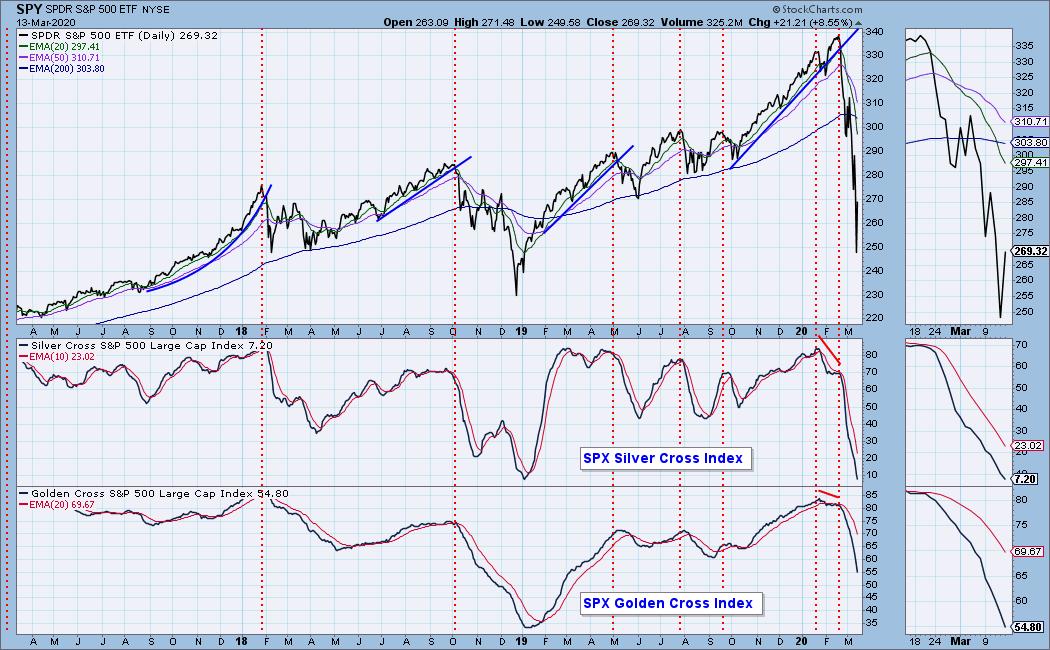
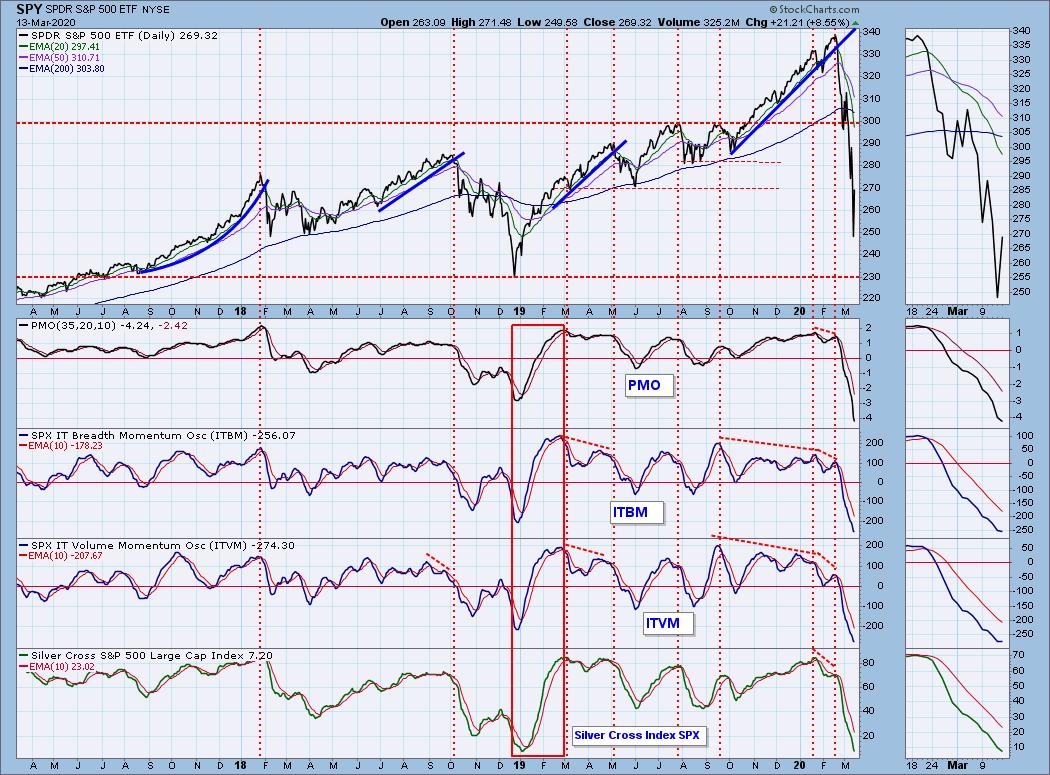
Intermediate-Term Market Indicators: The intermediate-term market trend is DOWN and the condition is OVERSOLD. The Golden Cross Index is a long-term indicator, and it is neutral.
These indicators are very oversold, and the market has already had a one-day bounce. Note that none of these indicators have turned up yet.
CONCLUSION: I'm not sure if it can be done, but I want to cast my vote to have the CORVID-19 Panic included in the next edition of Extraordinary Popular Delusions and the Madness of Crowds. Surely this panic is similar to the tulip mania in Holland centuries ago. What is delusional is that everybody thinks we can stay home until it's over. We can't. Who is going to keep electricity, gas, water, and food coming our way? Not telecommuters, that's for sure. Are we separating into two groups -- *Eloi and *Morlocks?
The intermediate- and short-term trends are DOWN and the market condition in both time frames is OVERSOLD. This extreme oversold condition is giving us a bounce, but I don't believe we have found the bear market bottom. Since the February 19 market top, we have witnessed how quickly and violently sentiment can change, thanks to CORVID-19. Sentiment could change back just as quickly, but the CORVID-19 probably won't be solved overnight. When sentiment does finally change, there will be concerns about earnings.
I believe that we are in for continued volatility, but who knows where the market will be day-to-day? Sometimes we can make an educated guess, but this is not one of those times. Next Friday is quadruple-witching options expiration. Normally, we expect very high volume and a relatively quiet market. Next week I'll expect the former but not the latter.
*See H. G. Wells' The Time Machine.
Have you subscribed the DecisionPoint Diamonds yet? DP does the work for you by providing handpicked stocks/ETFs from exclusive DP scans! Add it with a discount! Contact support@decisionpoint.com for more information!
DOLLAR (UUP)
IT Trend Model: NEUTRAL as of 3/9/2020
LT Trend Model: BUY as of 5/25/2018
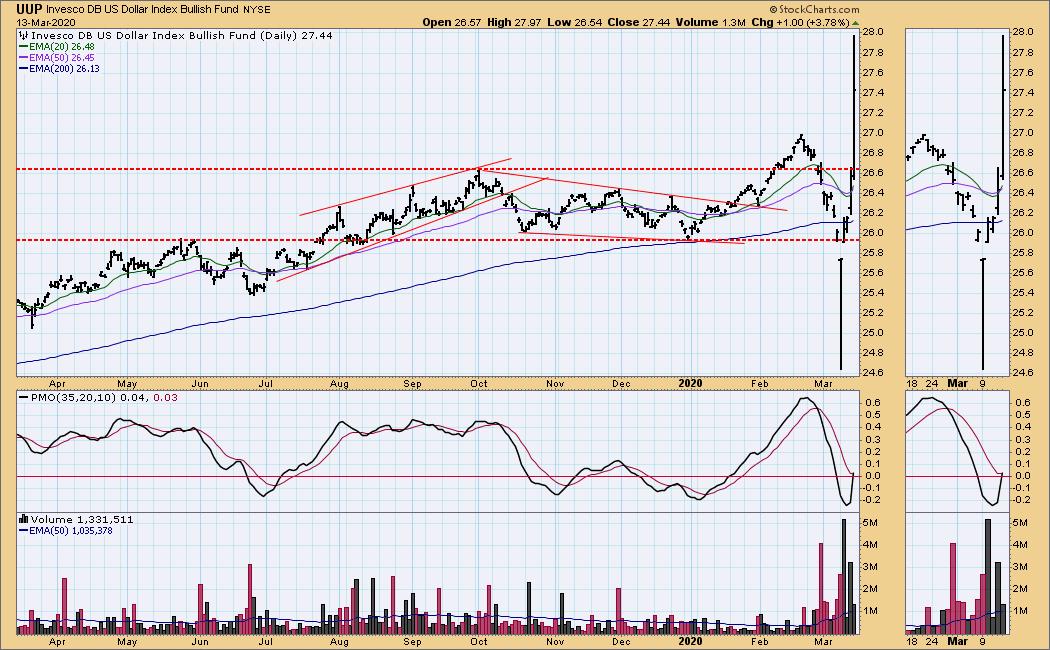
UUP Daily Chart: Some very strange spikes on UUP this week, but I verified it against $USD, and they are legit. Nevertheless, I don't know what to make of this.
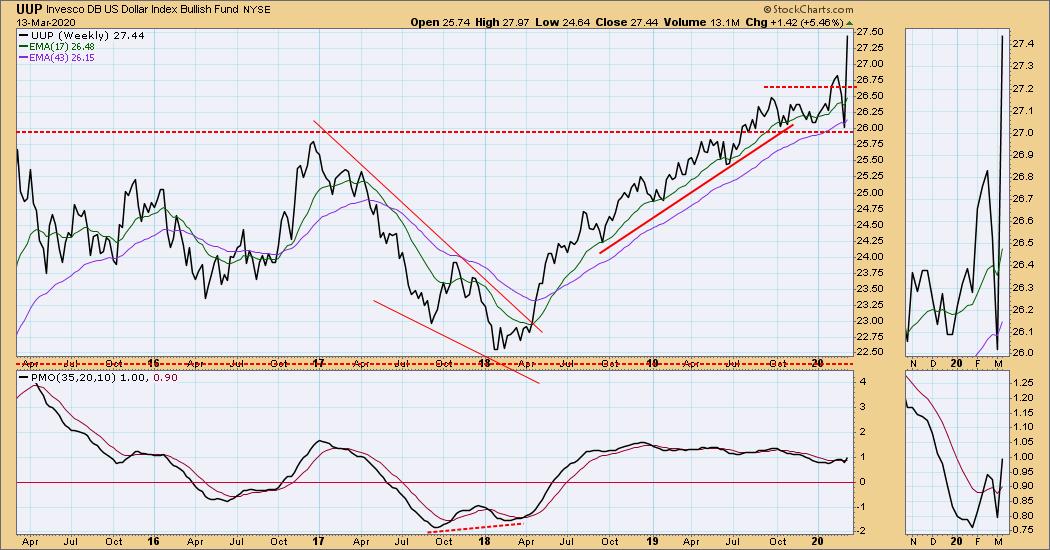
UUP Weekly Chart: Same problem with this time frame, so I switched to a line chart. Clearly, we have a breakout.
GOLD
IT Trend Model: BUY as of 12/26/2019
LT Trend Model: BUY as of 1/8/2019
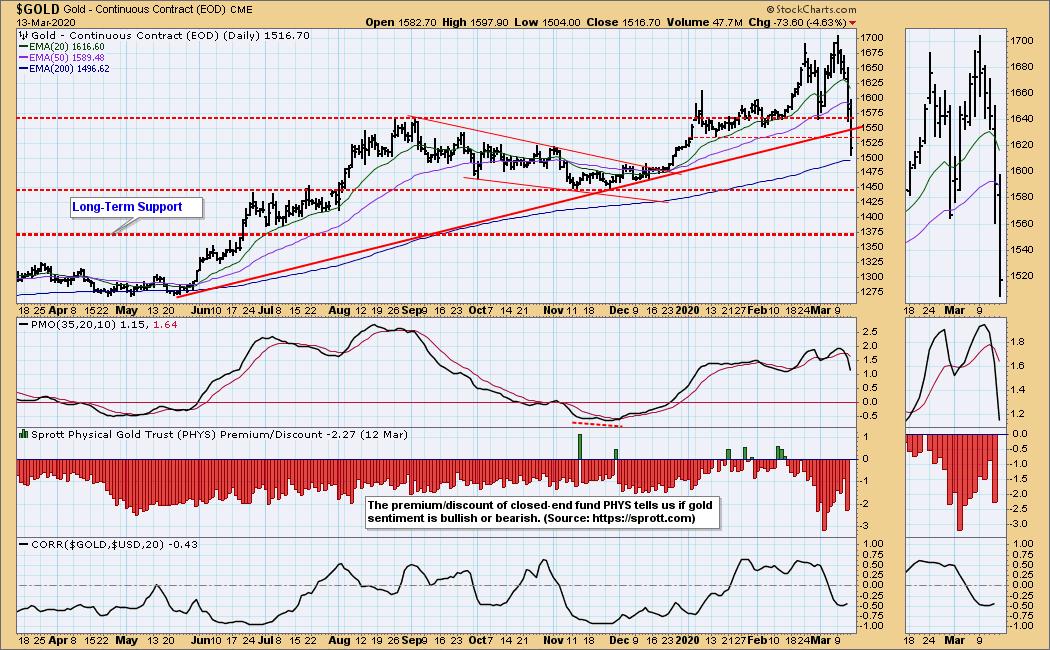
GOLD Daily Chart: Gold has clearly departed from "safe haven" status. Horizontal support at 1570 has been broken decisively, and 1445 is the next support.
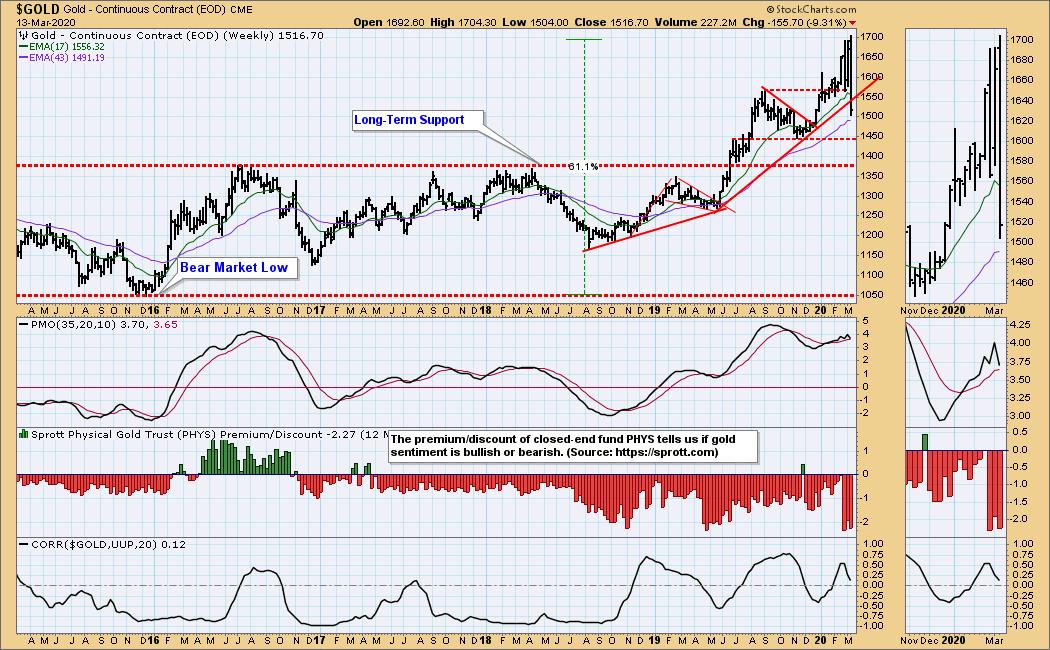
GOLD Weekly Chart: 1375 is critical long-term support.
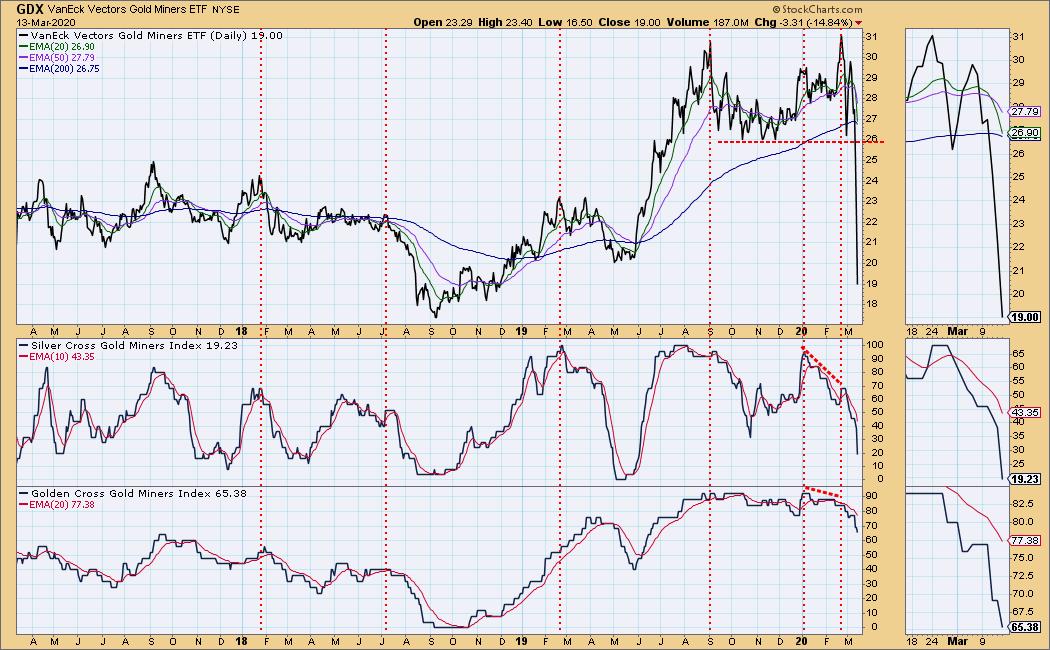
GOLD MINERS Golden and Silver Cross Indexes: It was a dismal week for the miners. I wonder if the 2018 low is safe.
CRUDE OIL (USO)
IT Trend Model: NEUTRAL as of 1/27/2020
LT Trend Model: SELL as of 2/3/2020
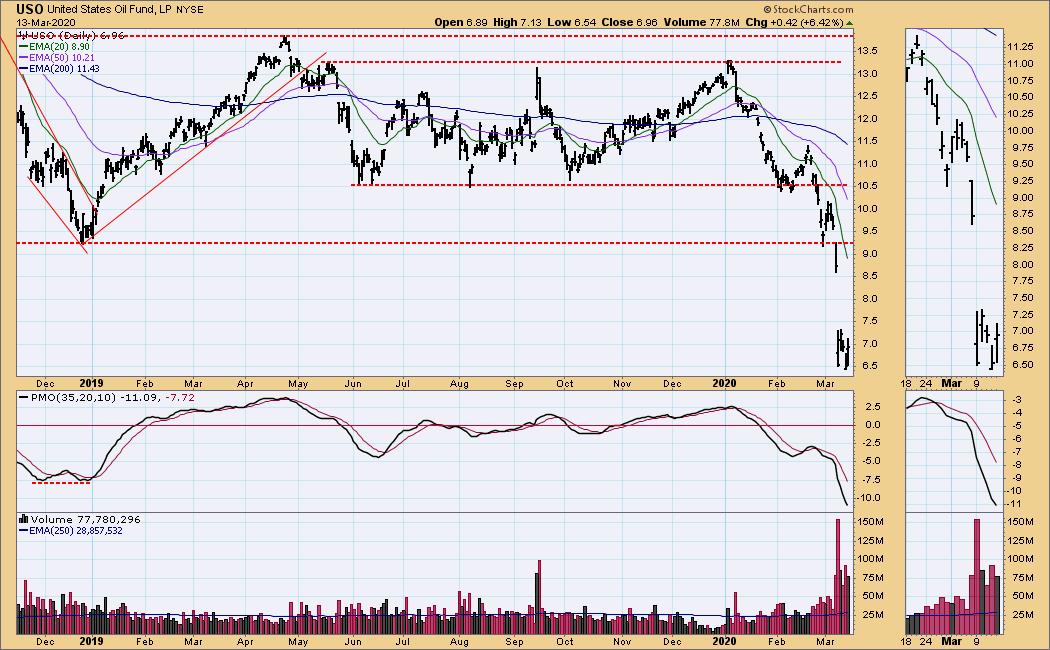
USO Daily Chart: There was a sharp break in USO on Monday, but price clustered the rest of the week.
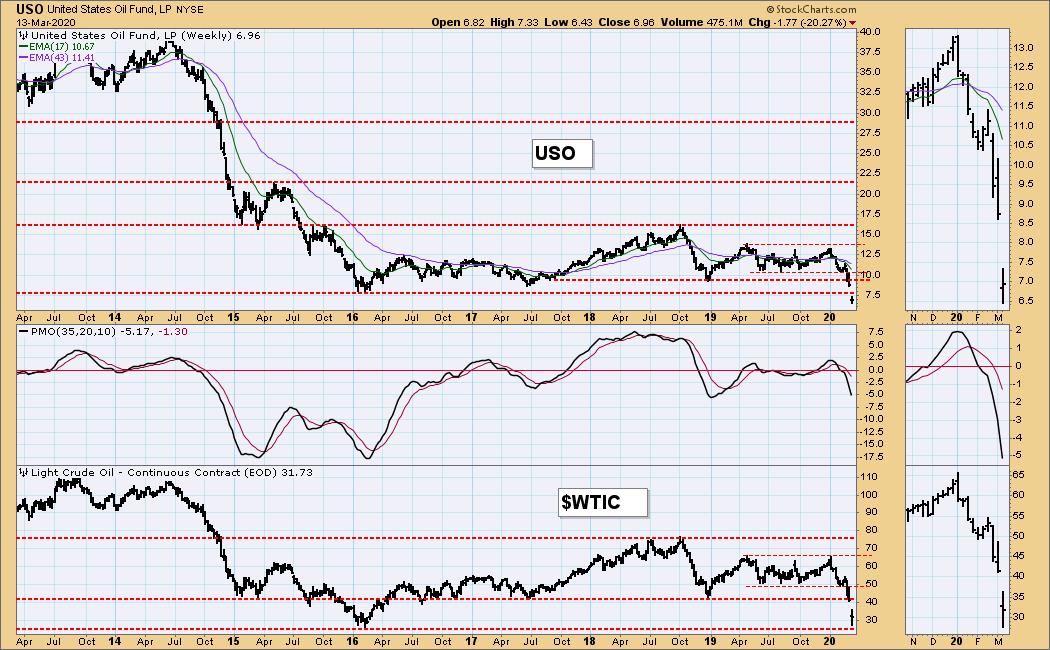
USO Weekly Chart: Price approached long-term support for $WTIC, but price held after the initial breakdown. It makes me think that perhaps oil has hit bottom.
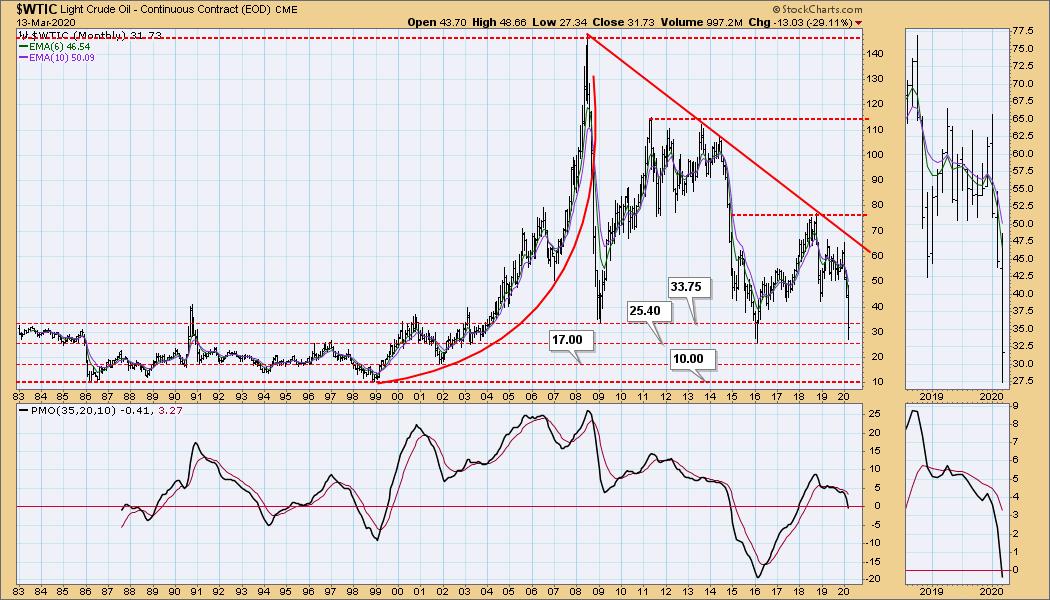
$WTIC Monthly Chart: I prepared this chart for an article earlier this week in order to determine long-term support levels, and $10 is the ultimate support.
BONDS (TLT)
IT Trend Model: BUY as of 1/22/2020
LT Trend Model: BUY as of 1/2/2019
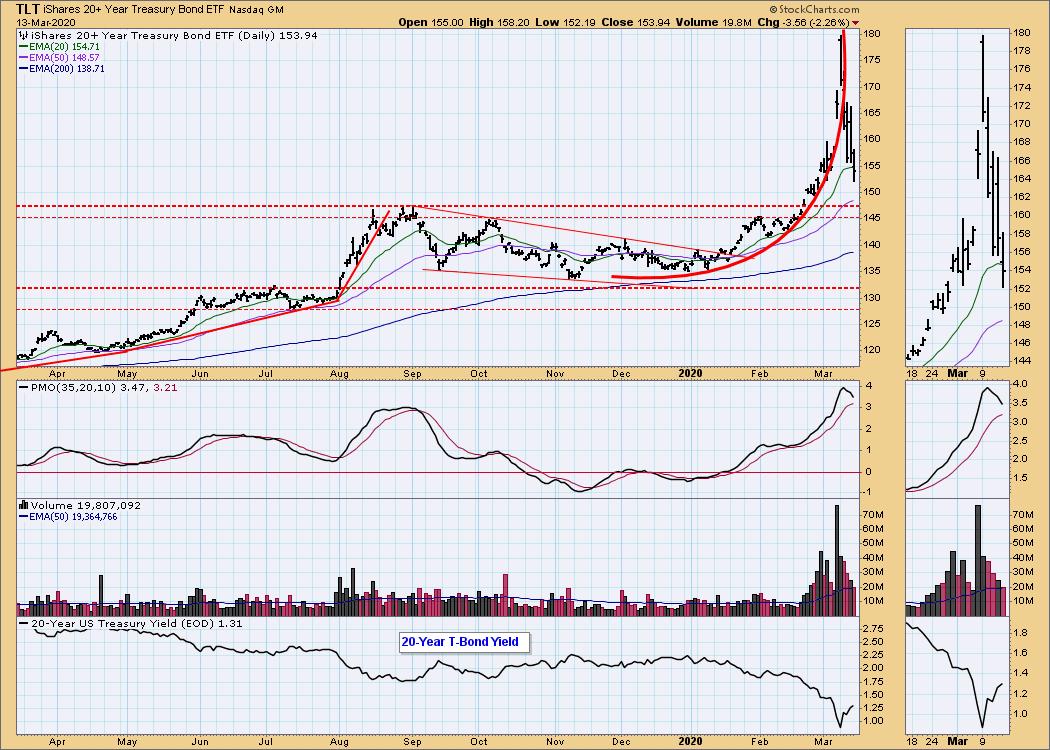
TLT Daily Chart: Last week I reminded that TLT's parabolic advance would probably break soon. The break came a day after the final up spike on Monday. Next support at 147. With another Fed rate cut coming, we'll probably see the recent top challenged.
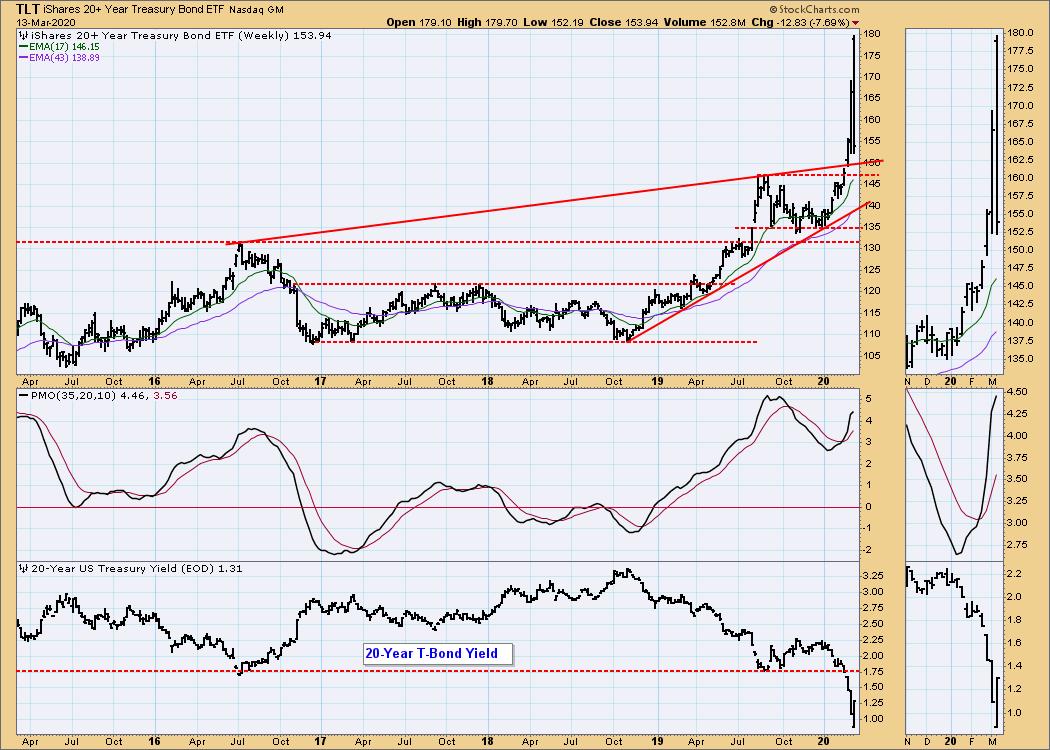
TLT Weekly Chart: The PMO is beginning to decelerate, so we should look for it to top soon.
Technical Analysis is a windsock, not a crystal ball.
Happy Charting! - Carl
NOTE: The signal status reported herein is based upon mechanical trading model signals, specifically, the DecisionPoint Trend Model. They define the implied bias of the price index based upon moving average relationships, but they do not necessarily call for a specific action. They are information flags that should prompt chart review. Further, they do not call for continuous buying or selling during the life of the signal. For example, a BUY signal will probably (but not necessarily) return the best results if action is taken soon after the signal is generated. Additional opportunities for buying may be found as price zigzags higher, but the trader must look for optimum entry points. Conversely, exit points to preserve gains (or minimize losses) may be evident before the model mechanically closes the signal.
Helpful DecisionPoint Links:
DecisionPoint Alert Chart List
DecisionPoint Golden Cross/Silver Cross Index Chart List
DecisionPoint Sector Chart List
Price Momentum Oscillator (PMO)
Swenlin Trading Oscillators (STO-B and STO-V)