
In order to officially declare a bear market, one of two things needs to happen: (1) the 50EMA needs to cross down through the 200EMA; or (2) the market needs to decline 20% from the February 19th price top. The 20% decline is a generally accepted benchmark, but the 50/200EMA downside crossover (a.k.a. the death cross) also serves as an objective SELL signal.
While we are waiting for these actions to take place, we can also recognize that the economy has been hit by a panic, resulting in a sharp contraction of both supply and demand, and it appears that there is almost no chance of a return to normalcy for many months. I could be wrong about that, but I don't see a sudden reversal of the hysteria any time soon. Even though it is not officially a bear market, I think we should begin to interpret charts and indicators in the context of a bear market template. For example:
* Oversold conditions should be viewed as extremely dangerous. Whereas, in bull markets oversold lows usually present buying opportunities, in bear markets expected support dissolves, and more selling ensues.
* Overbought conditions in a bear market are most likely a sign that a trading top is at hand.
* While bear market rallies present great profit opportunities, long positions should be managed in the short-term.
In my opinion, the market is being driven down primarily by panic over the coronavirus. Furious rallies will undoubtedly come along, but unless perception of and response to the coronavirus situation changes for the positive, I will consider that we are in a bear market.
Do not think me insensitive to the plight of those infected by this virus. It appears to be every bit as dangerous as the flu, and at my age I am in the group most likely to die from it, but it has been completely over-hyped by the media. Check this video for a more rational/practical perspective.
The DecisionPoint Alert Weekly Wrap presents an end-of-week assessment of the trend and condition of the Stock Market, the U.S. Dollar, Gold, Crude Oil, and Bonds. The DecisionPoint Alert daily report (Monday through Thursday) is abbreviated and gives updates on the Weekly Wrap assessments.
Watch the latest episode of DecisionPoint on StockCharts TV's YouTube channel here!
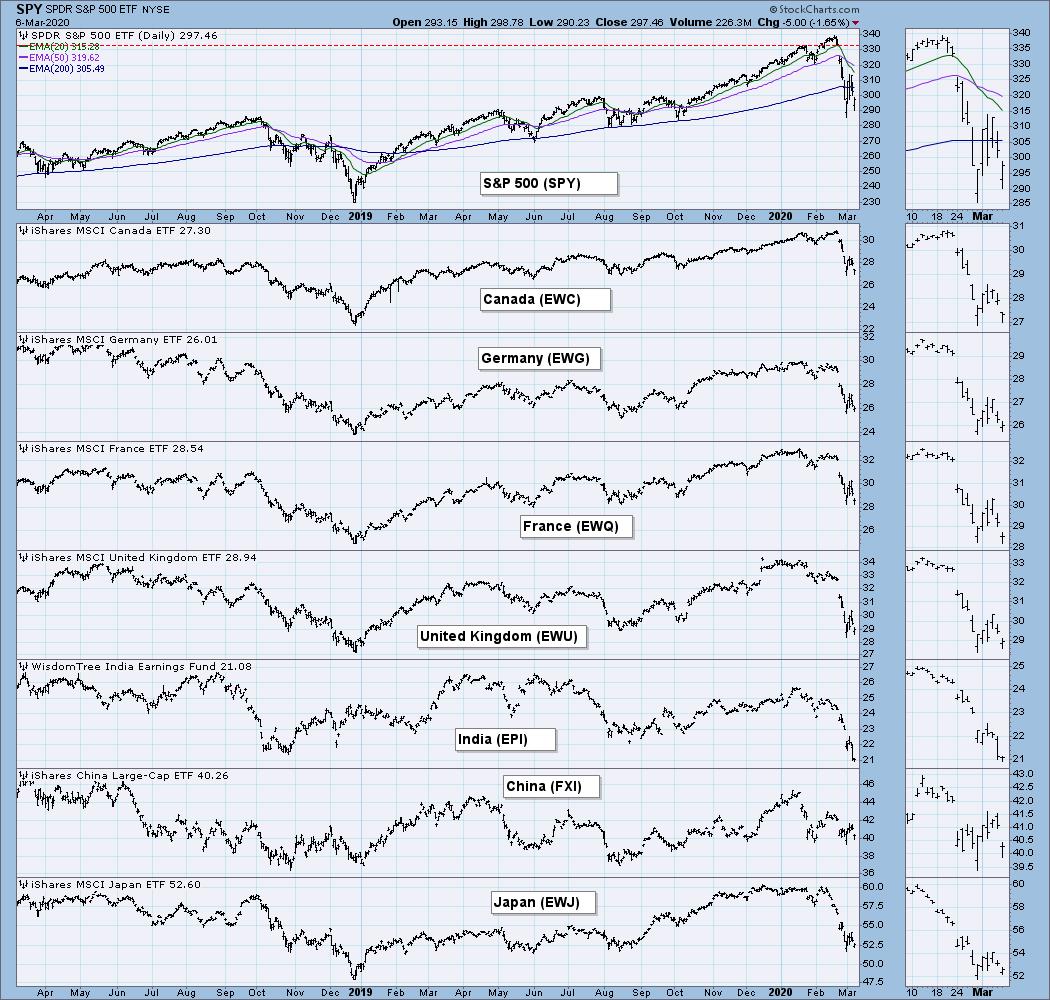
GLOBAL MARKETS
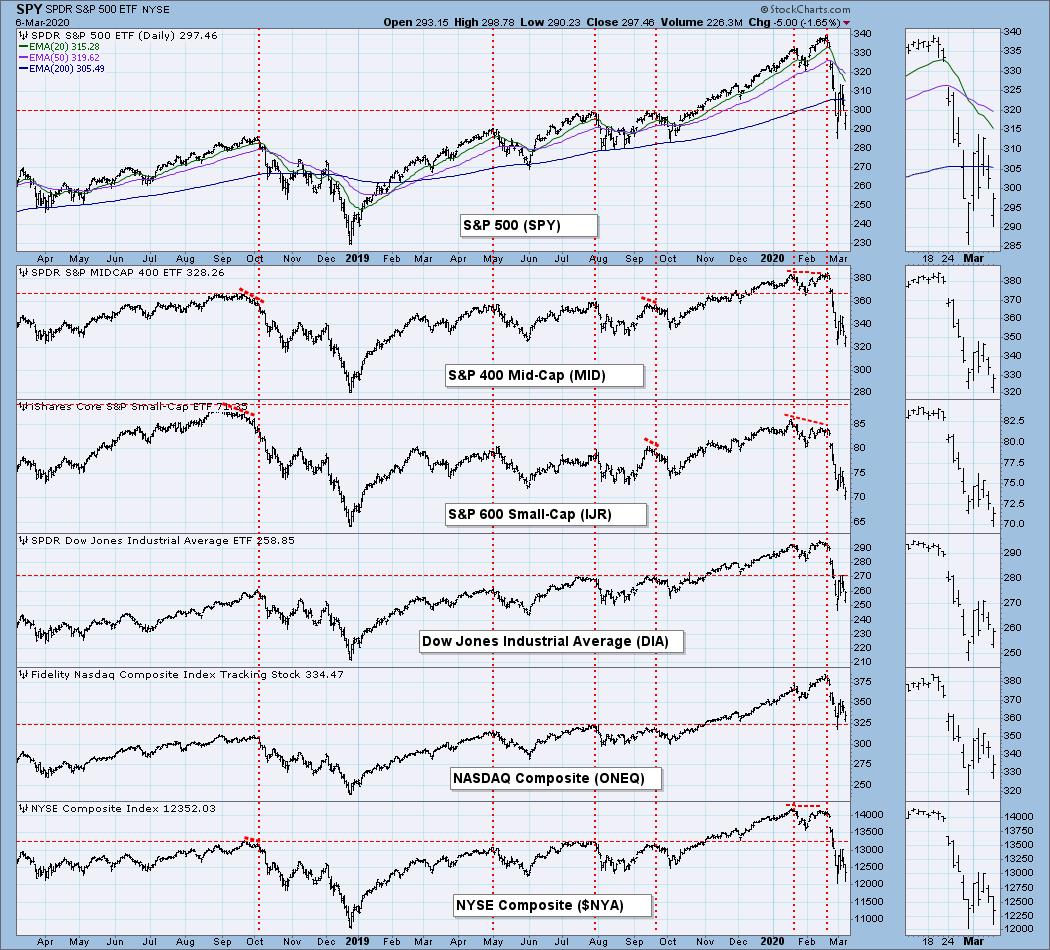
BROAD MARKET INDEXES
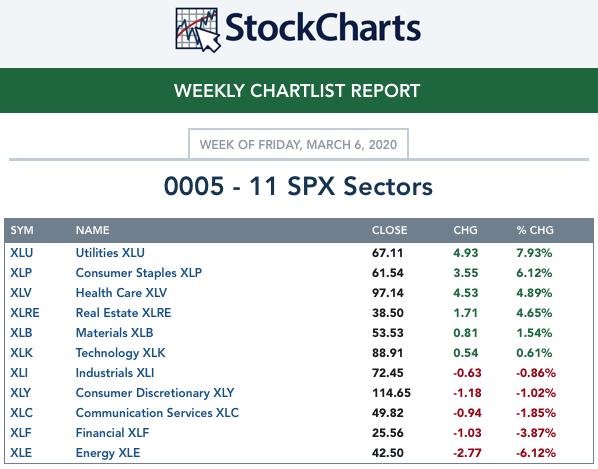
SECTORS
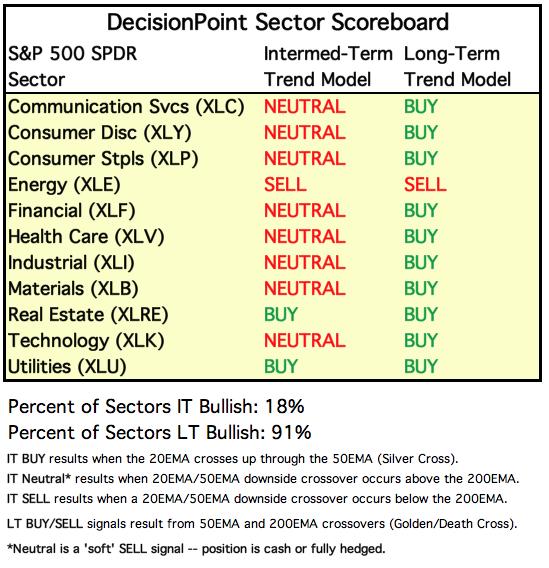
Each S&P 500 Index component stock is assigned to one, and only one, of 11 major sectors. This is a snapshot of the Intermediate-Term (Silver Cross) and Long-Term (Golden Cross) Trend Model signal status for those sectors.
ETF TRACKER: This is a list of about 100 ETFs intended to track a wide range of U.S. market indexes, sectors, global indexes, interest rates, currencies, and commodities. StockCharts.com subscribers can acquire it in the DecisionPoint Trend and Condition ChartPack.
Top 10 . . .
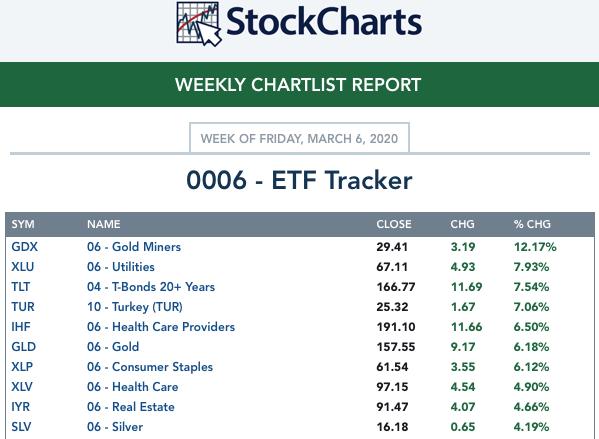
. . . and bottom 10: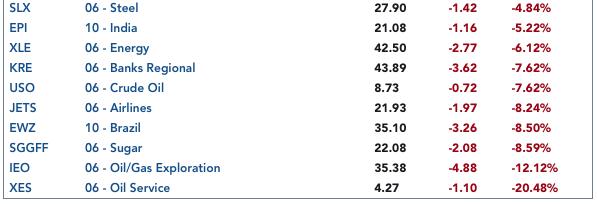
INTEREST RATES
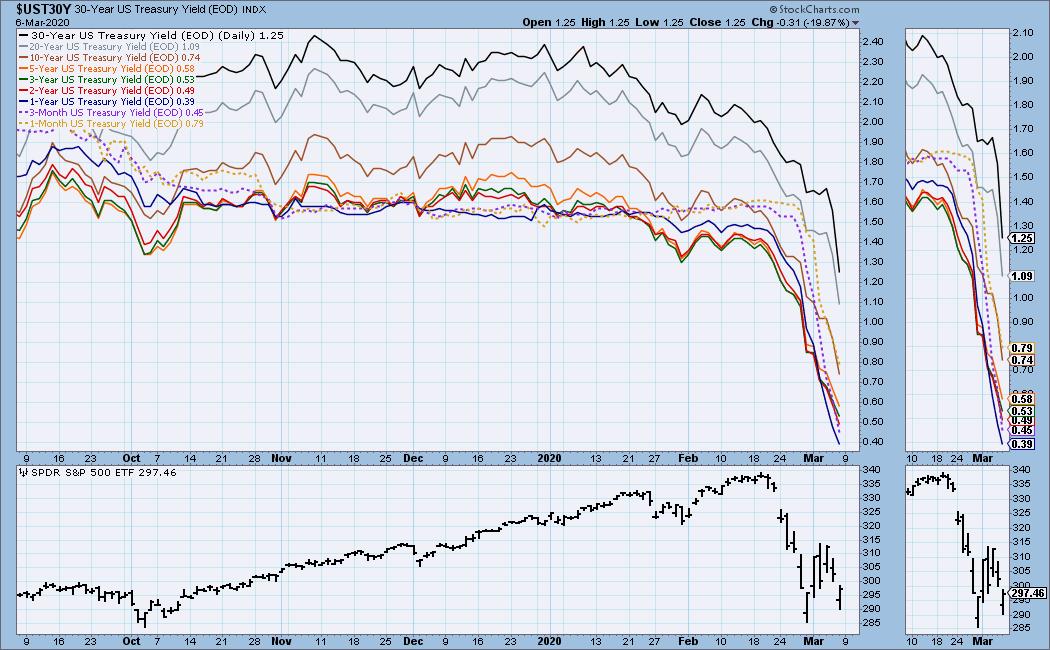
This chart is included so we can monitor rate inversions. In normal circumstances the longer money is borrowed the higher the interest rate that must be paid. When rates are inverted, the reverse is true.
STOCKS
IT Trend Model: NEUTRAL as of 2/28/2020
LT Trend Model: BUY as of 2/26/2019
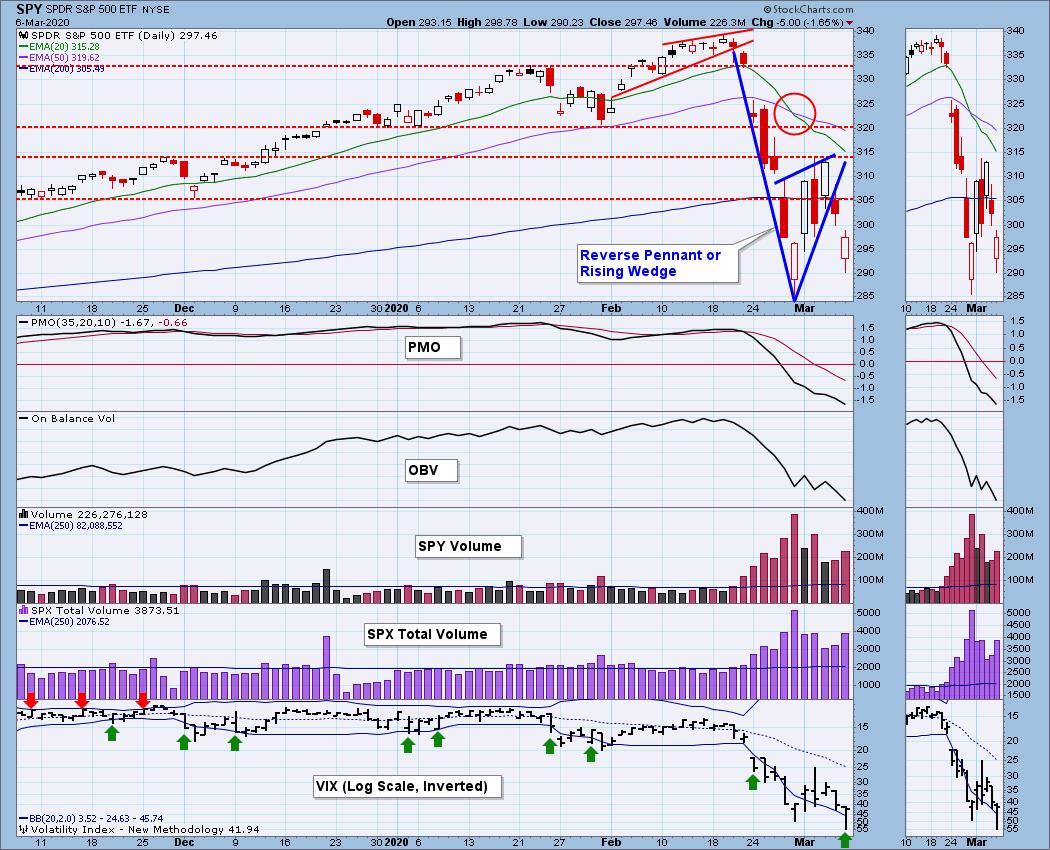
SPY Daily Chart: We identified a bearish rising wedge (reverse pennant) formation on Wednesday, and it broke down on Thursday. On Friday there was some heavy selling, which may turn out to be a successful retest of last week's low. This Friday was similar to last week with price trading lower but closing near the top of the day's range, so maybe continued upside can be expected Monday.
SPY Weekly Chart: In spite of considerable down pressure, SPY closed up for the week. I still anticipate one of the two scenarios I have highlighted on the chart: (1) continued sideways chop resulting in a successful retest, or continued sideways chop that results in a breakdown. Of course, other outcomes are possible, but these are my favorites until something else happens.

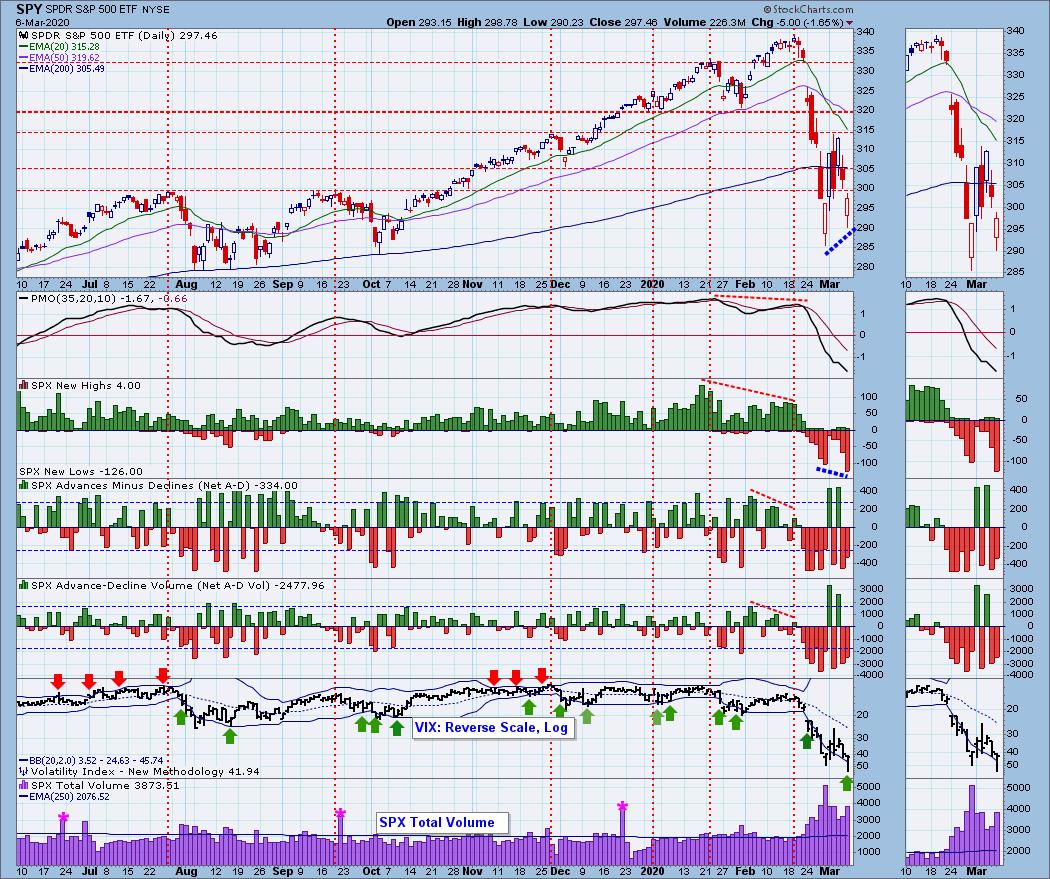
Climactic Market Indicators: This was a week with climactic action on every day, and it is difficult to make much out of it. Nevertheless, the VIX penetrated the lower Bollinger Band on Friday, signalling a possible very short-term price bottom. There was also a reverse divergence between this week's lower New Lows and the corresponding higher price low (dashed blue lines).
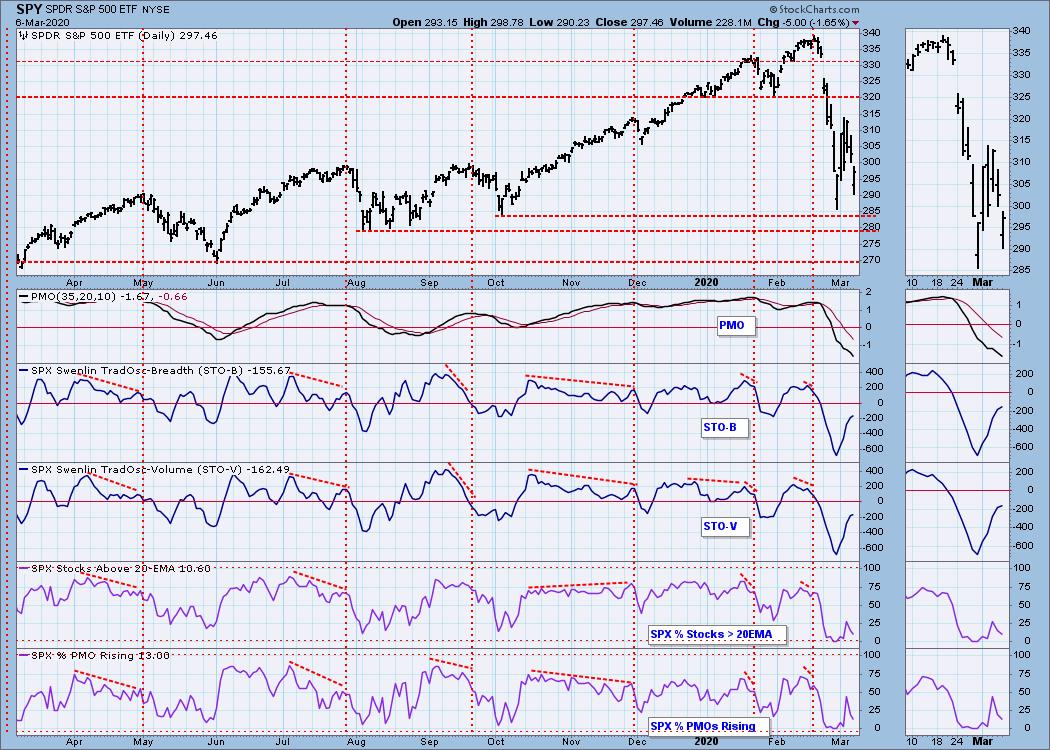
Short-Term Market Indicators: The short-term market trend is DOWN and the condition is OVERSOLD. I note that the STO-B and STO-V are close to topping below the zero line -- bearish.
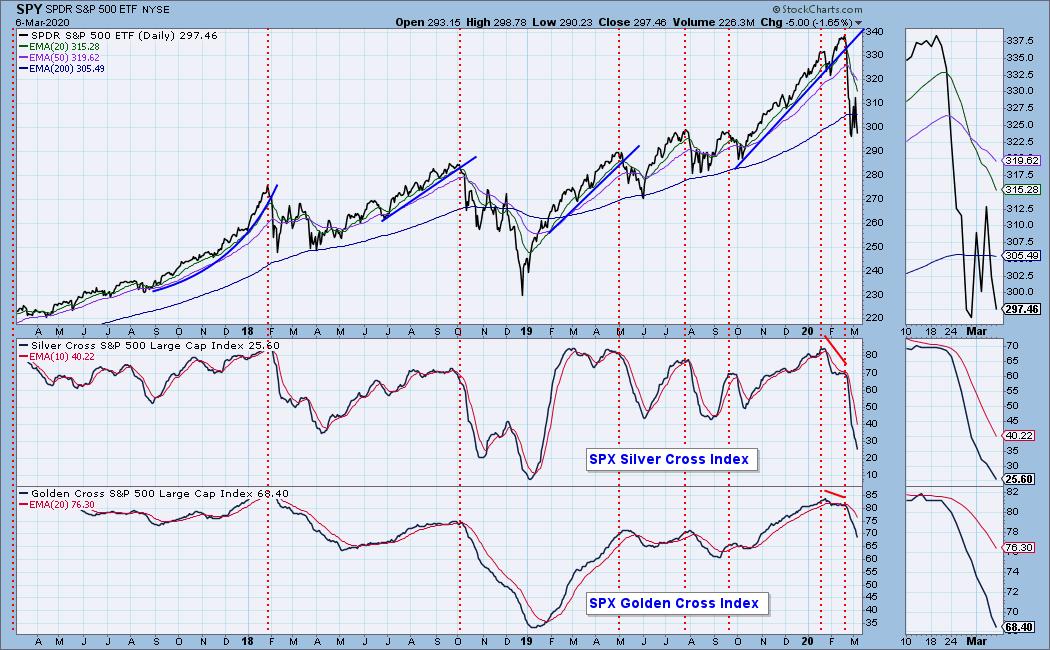
Intermediate-Term Market Indicators: The intermediate-term market trend is DOWN and the condition is OVERSOLD. Even though the duration of the down trend is short, the 20/50EMA downside crossover and the -15% decline leave no doubt as to the trend.
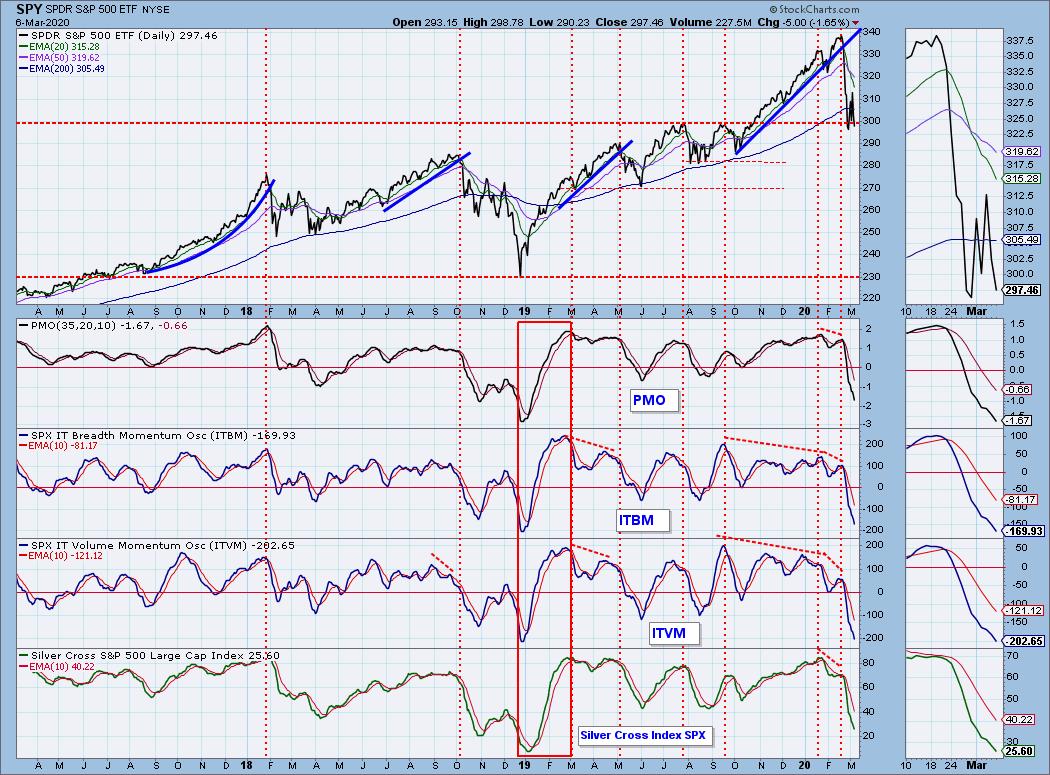
These indicators are becoming quite oversold, but keep in mind that the bottom of the ITBM/ITVM range over the long term is about -250, so we're still far away from a deeply oversold reading.
CONCLUSION: If the bull market is going to resume, we have reached a pretty good point technically for the next leg up to begin. We've had a huge selloff, intermediate-term indicators are very oversold, and there was a tidy, successful retest of last week's lows on Friday.
The problem is that the coronavirus is really screwing things up, and investors have lost the confidence that pushed the market to all-time highs. They have good reasons for their doubt. There have been enormous contractions in supply and demand across a wide spectrum, and an end is not in sight. First quarter earnings will surely take a hit, as a start, and the market is already overvalued.
Interest rates are crashing and appear to be headed for zero (and below?), and the Fed just made an emergency half-point cut. There is really no cushion left for when we really need it.
As I said at the beginning of this issue, I am assuming that we are in a bear market based upon the horrible market action and the severe coronavirus jolt to the economy. I could quickly change my mind on that, if there is a reversal of how the everyone is reacting to the coronavirus, and, of course, improved market action.
Friday's action indicates that there ought to be a continued bounce on Monday. If instead we get another hard down day, then I expect that a retest of the February 28 lows will not be successful.
Have you subscribed the DecisionPoint Diamonds yet? DP does the work for you by providing handpicked stocks/ETFs from exclusive DP scans! Add it with a discount! Contact support@decisionpoint.com for more information!
DOLLAR (UUP)
IT Trend Model: BUY as of 1/22/2020
LT Trend Model: BUY as of 5/25/2018
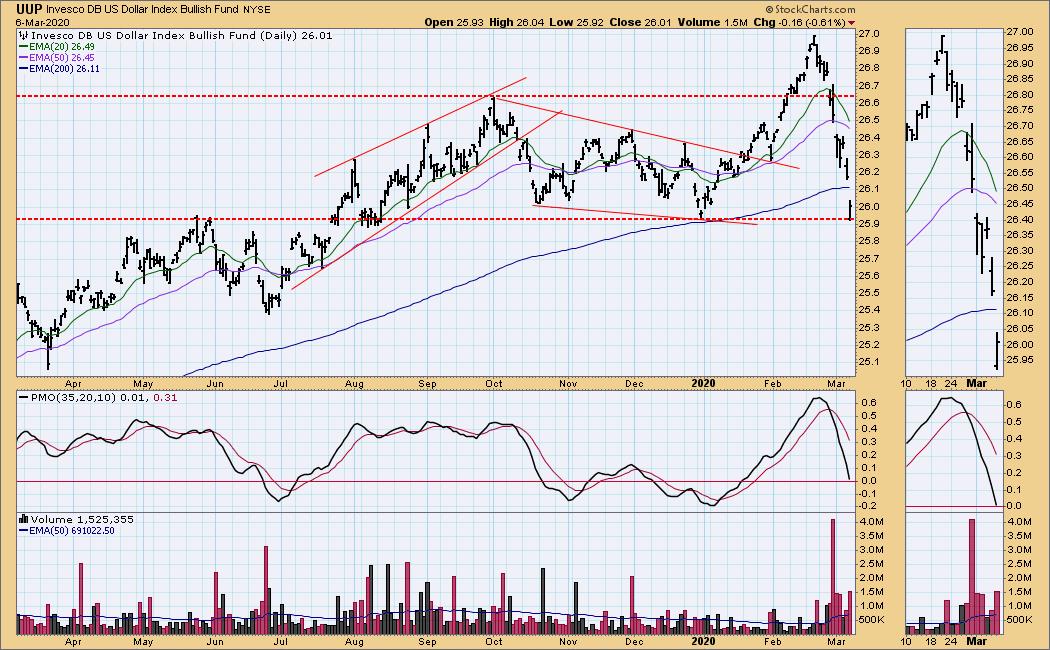
UUP Daily Chart: Like stocks, UUP hit a high in February, and it has since reversed and broken through the support line drawn across the October top.
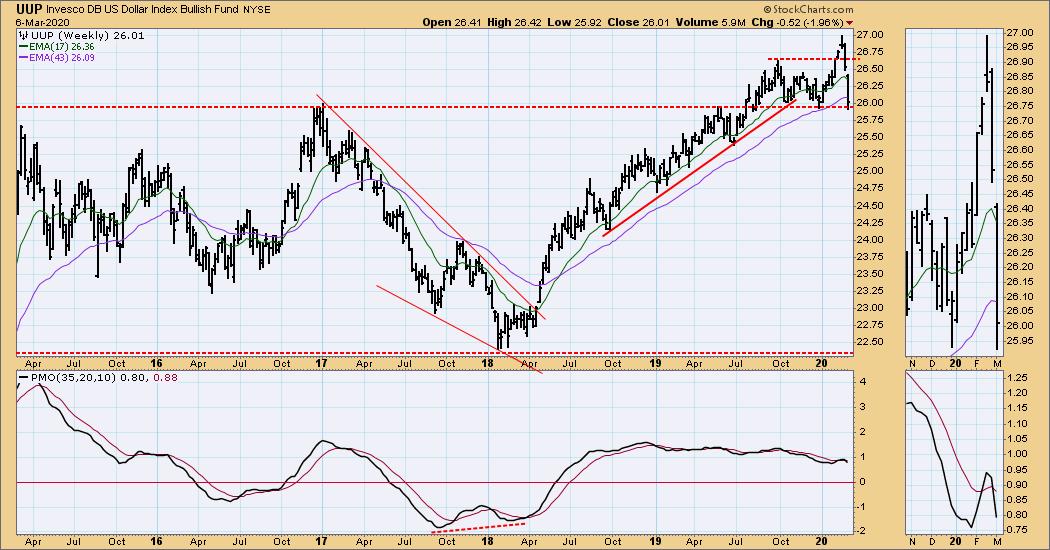
UUP Weekly Chart: The longer-term support is currently being challenged, and the weekly PMO shows internal weakness.
GOLD
IT Trend Model: BUY as of 12/26/2019
LT Trend Model: BUY as of 1/8/2019
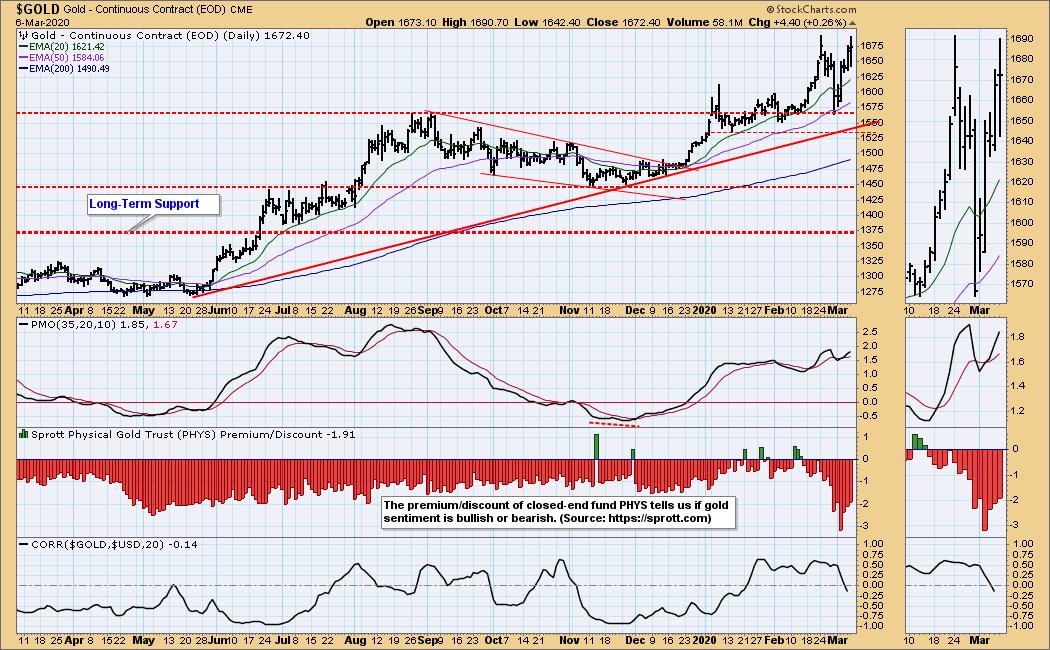
GOLD Daily Chart: With investors fleeing stocks, I am surprised that gold has not attracted more safety seekers. But it hasn't, and even gold sentiment has remained solidly bearish. It has, however, managed to continue it's tortured advance.
GOLD Weekly Chart: Note that gold has rallied +61% above the 2015 bear market low.

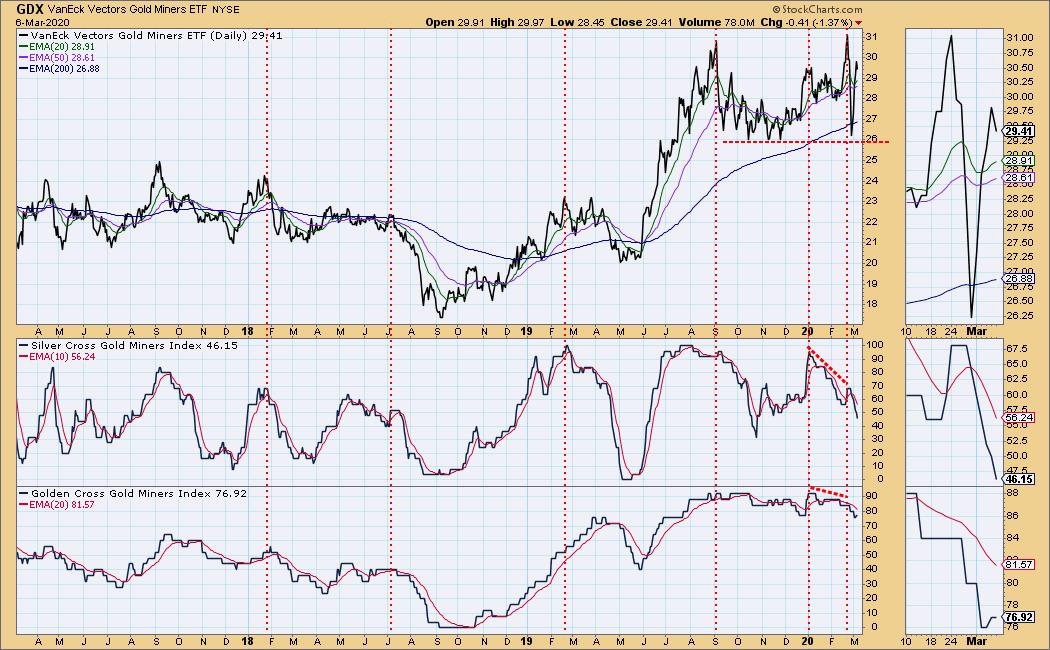
GOLD MINERS Golden and Silver Cross Indexes: The percentage of gold miner stocks participating in both time frames continues to decline.
CRUDE OIL (USO)
IT Trend Model: NEUTRAL as of 1/27/2020
LT Trend Model: SELL as of 2/3/2020
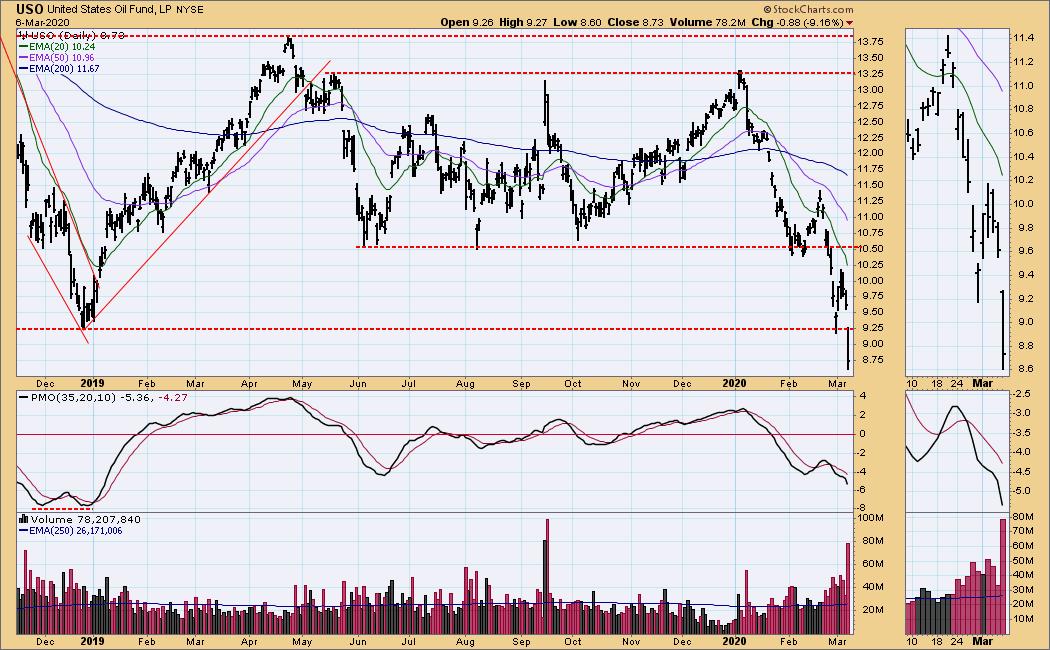
USO Daily Chart: Coronavirus panic has been particularly devastating to the energy sector, because supply is abundant, while demand dropped significantly. Important support has been broken decisively, and we need to look longer-term to evaluate.
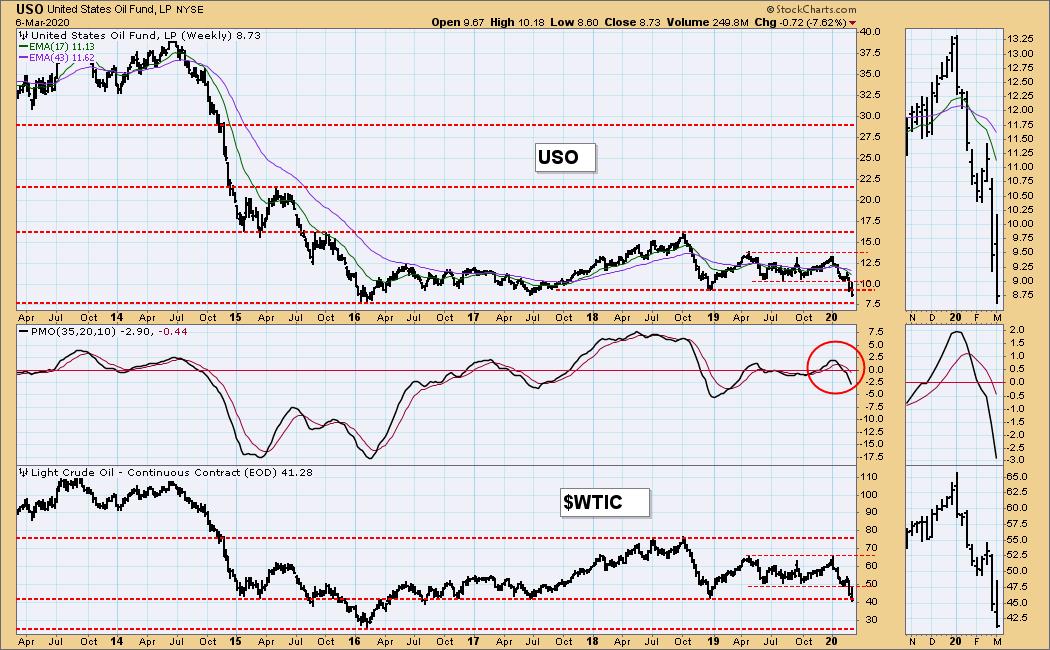
USO Weekly Chart: WTIC has penetrated the support line at $42, and it is also a decisive break, meaning lower prices are likely. The next prominent support is at the 2016 low, which is about $26/bbl for WTIC. Corresponding support for USO is about 7.50.
BONDS (TLT)
IT Trend Model: BUY as of 1/22/2020
LT Trend Model: BUY as of 1/2/2019
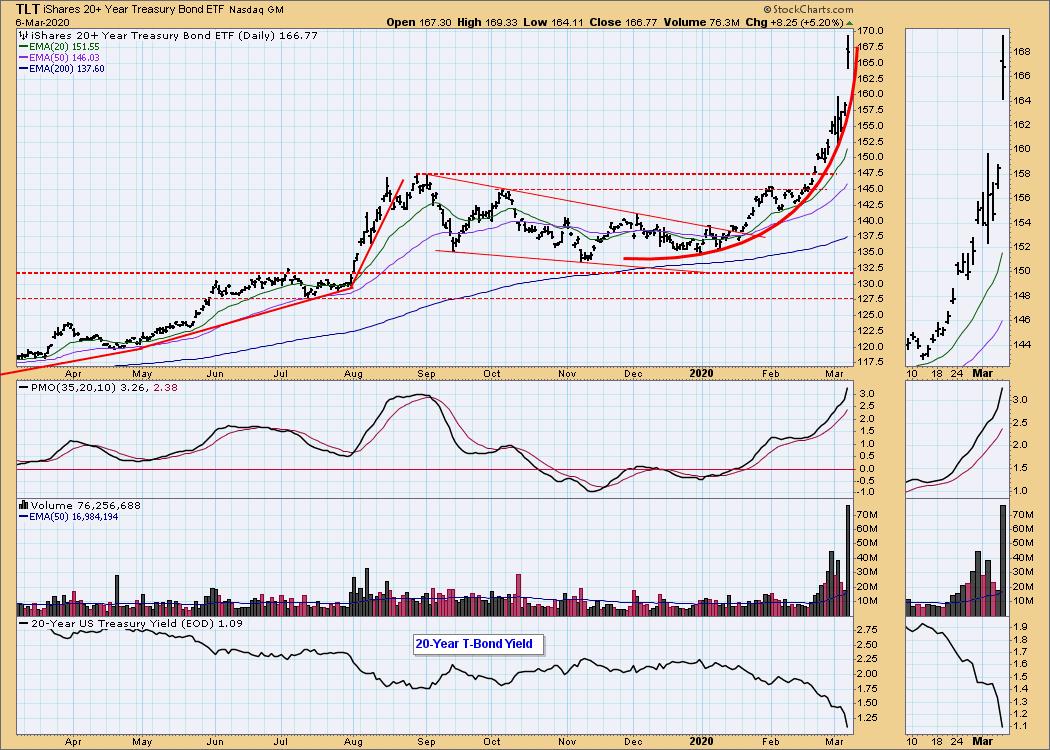
TLT Daily Chart: Here is the real destination of the flight to safety. Price has accelerated into a parabolic advance, so we should be alert for a breakdown very soon. That doesn't mean that we'll see a complete collapse, but it is not likely that this vertical ascent will be maintained.
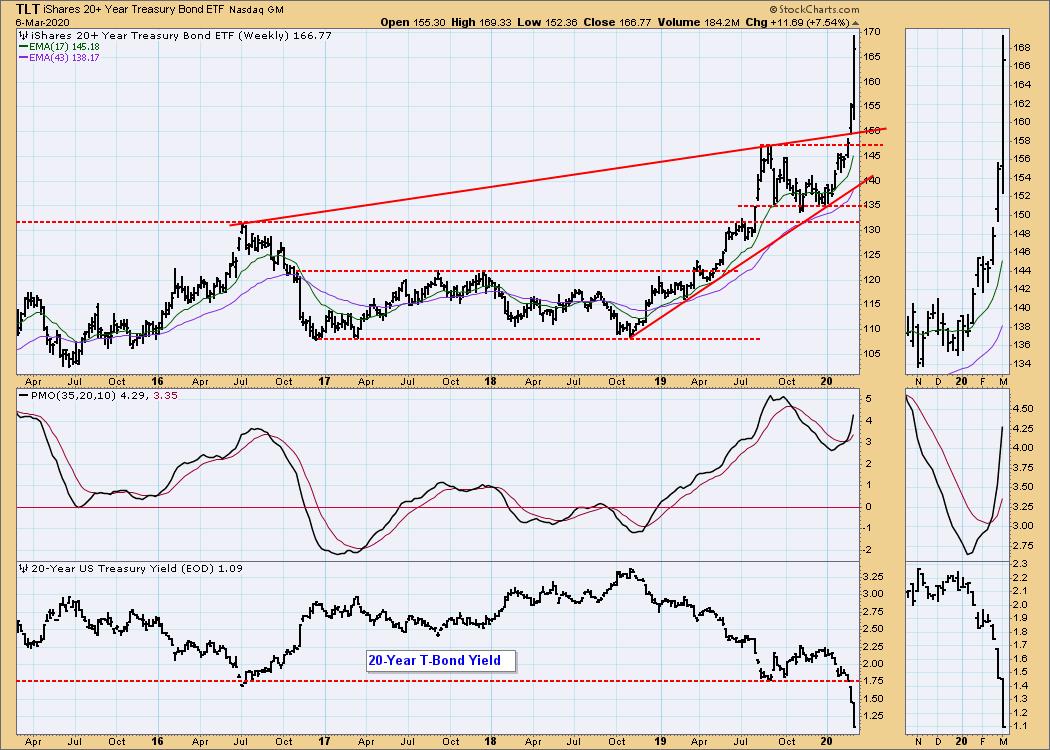
TLT Weekly Chart: I have nothing to add in this time frame.
Technical Analysis is a windsock, not a crystal ball.
Happy Charting! - Carl
NOTE: The signal status reported herein is based upon mechanical trading model signals, specifically, the DecisionPoint Trend Model. They define the implied bias of the price index based upon moving average relationships, but they do not necessarily call for a specific action. They are information flags that should prompt chart review. Further, they do not call for continuous buying or selling during the life of the signal. For example, a BUY signal will probably (but not necessarily) return the best results if action is taken soon after the signal is generated. Additional opportunities for buying may be found as price zigzags higher, but the trader must look for optimum entry points. Conversely, exit points to preserve gains (or minimize losses) may be evident before the model mechanically closes the signal.
Helpful DecisionPoint Links:
DecisionPoint Alert Chart List
DecisionPoint Golden Cross/Silver Cross Index Chart List
DecisionPoint Sector Chart List
Price Momentum Oscillator (PMO)
Swenlin Trading Oscillators (STO-B and STO-V)