
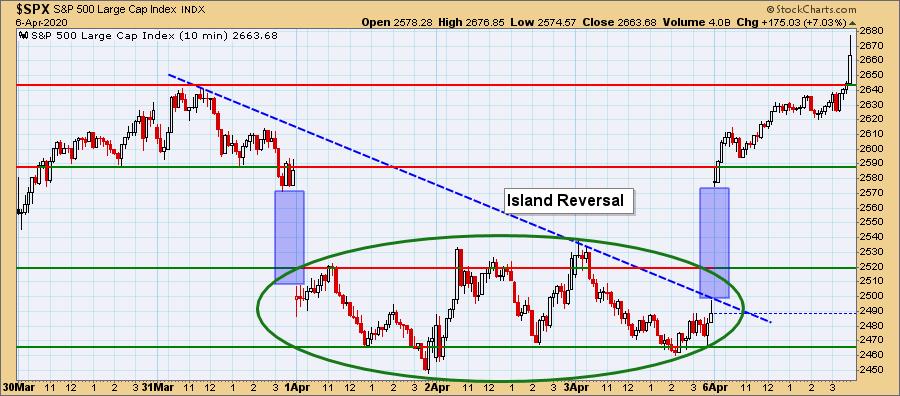
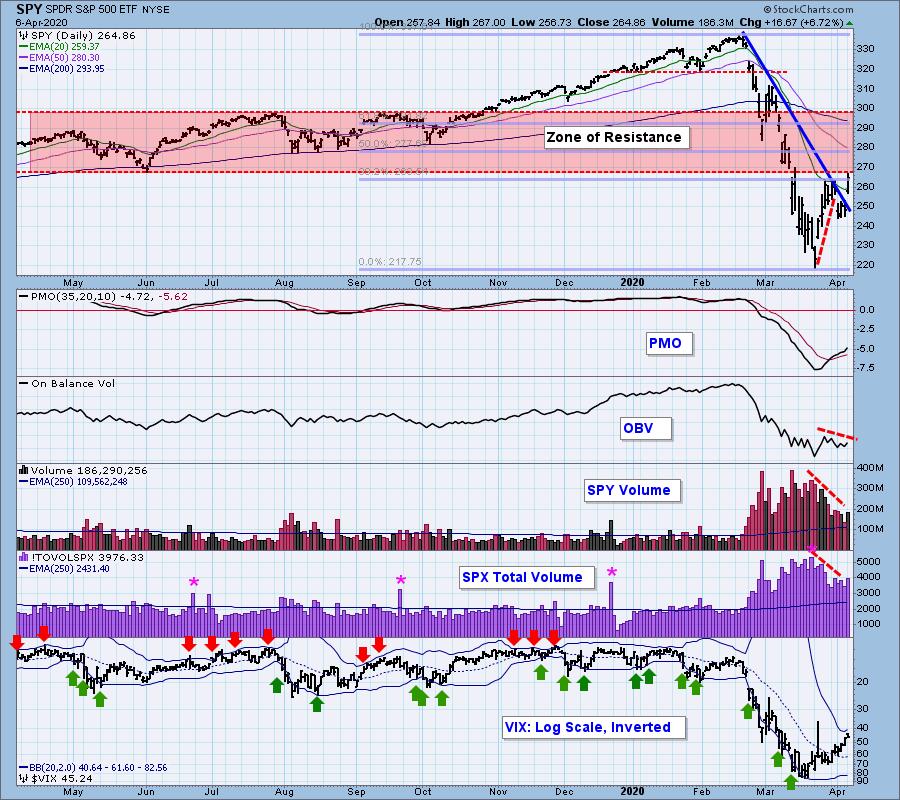
I've been asked why the market was so much higher on "very little news". As many of you have probably figured out, business channels/online news see what happens in the market and then they highlight the news that fits the action for the day. Not to say that the headlines are unimportant, but I believe the technicals are FAR more important. I was disappointed on Friday when we didn't get the breakout I was looking for, but today it came through in a big way. An island reversal pattern formed at the end of last week. It executed today as we would expect. The short-term trend is now up after breaking out of the declining trend. Price ratcheted higher on the close which put it above the Tuesday top. I find that very bullish.
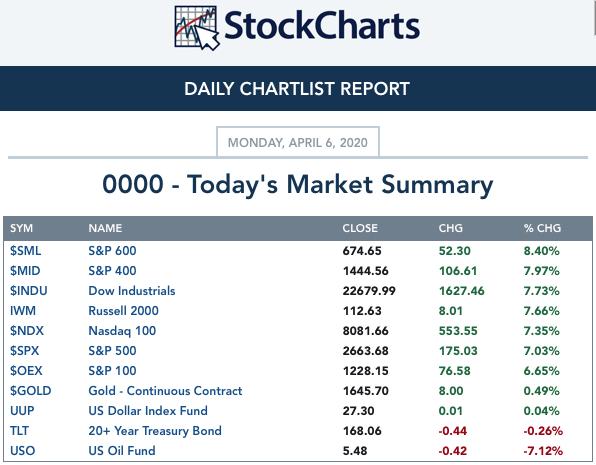
TODAY'S Broad Market Action:
Past WEEK Results: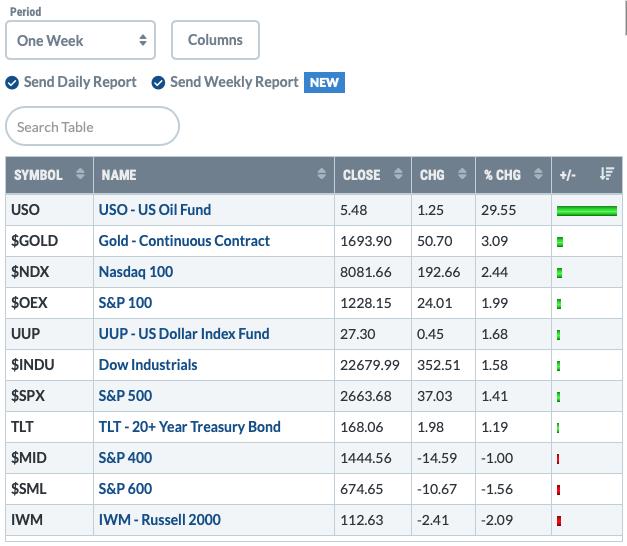
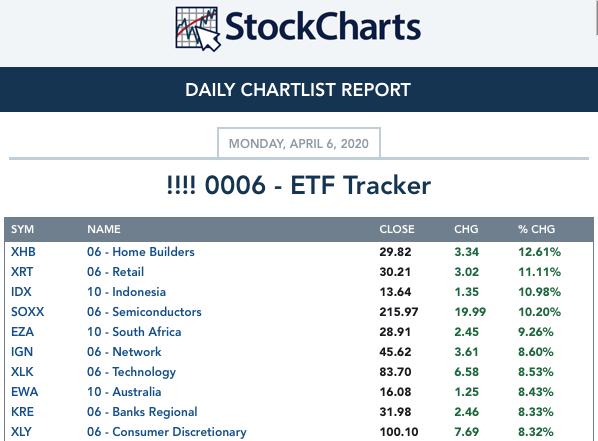
Top 10 from ETF Tracker:
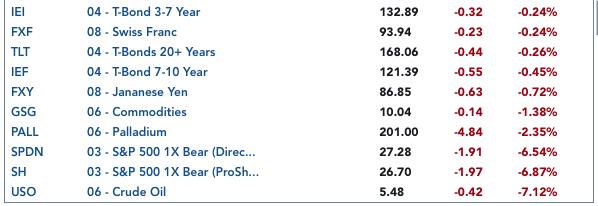
Bottom 10 from ETF Tracker:
On Friday, the DecisionPoint Alert Weekly Wrap presents an assessment of the trend and condition of the stock market (S&P 500), the U.S. Dollar, Gold, Crude Oil, and Bonds. Monday through Thursday the DecisionPoint Alert daily report is abbreviated and covers changes for the day.
Watch the latest episode of DecisionPoint on StockCharts TV's YouTube channel here!
SECTORS
SIGNALS:
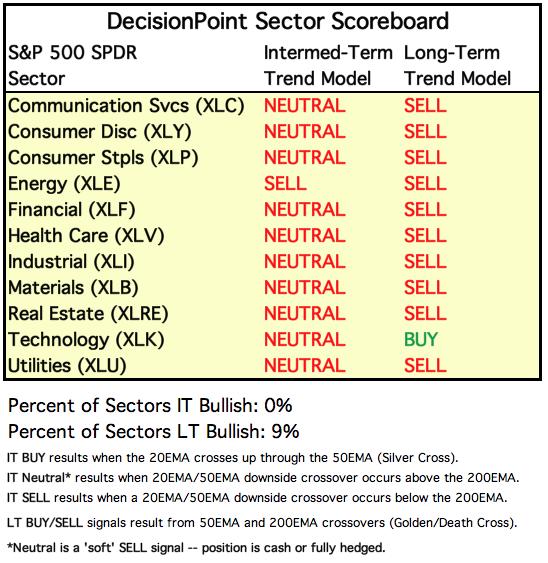
Each S&P 500 Index component stock is assigned to one, and only one, of 11 major sectors. This is a snapshot of the Intermediate-Term (Silver Cross) and Long-Term (Golden Cross) Trend Model signal status for those sectors.
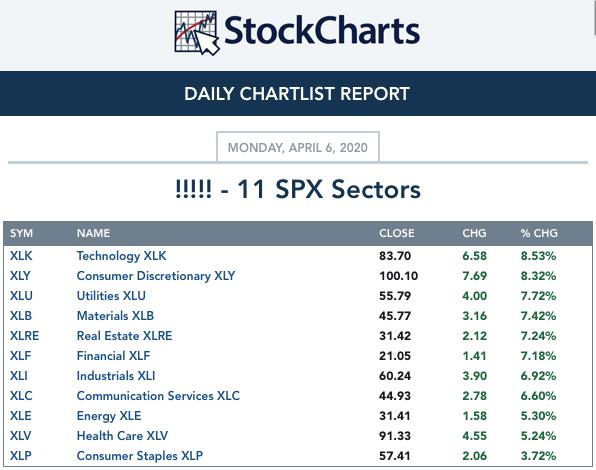
TODAY'S RESULTS:
One WEEK Results: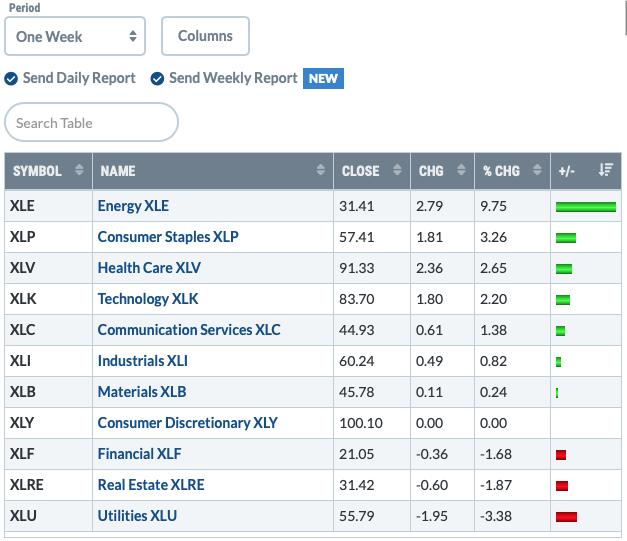
STOCKS
IT Trend Model: NEUTRAL as of 2/28/2020
LT Trend Model: SELL as of 3/19/2020
SPY Daily Chart: The breakout from the declining trend is impressive, but price did stop right at the 'zone of resistance' and on the Fibonacci Retracement 38.2% line. And, if you want something to grumble about, the OBV didn't breakout and isn't confirming today's move. Still, I think the breakout and trading above the 20-EMA were very encouraging.
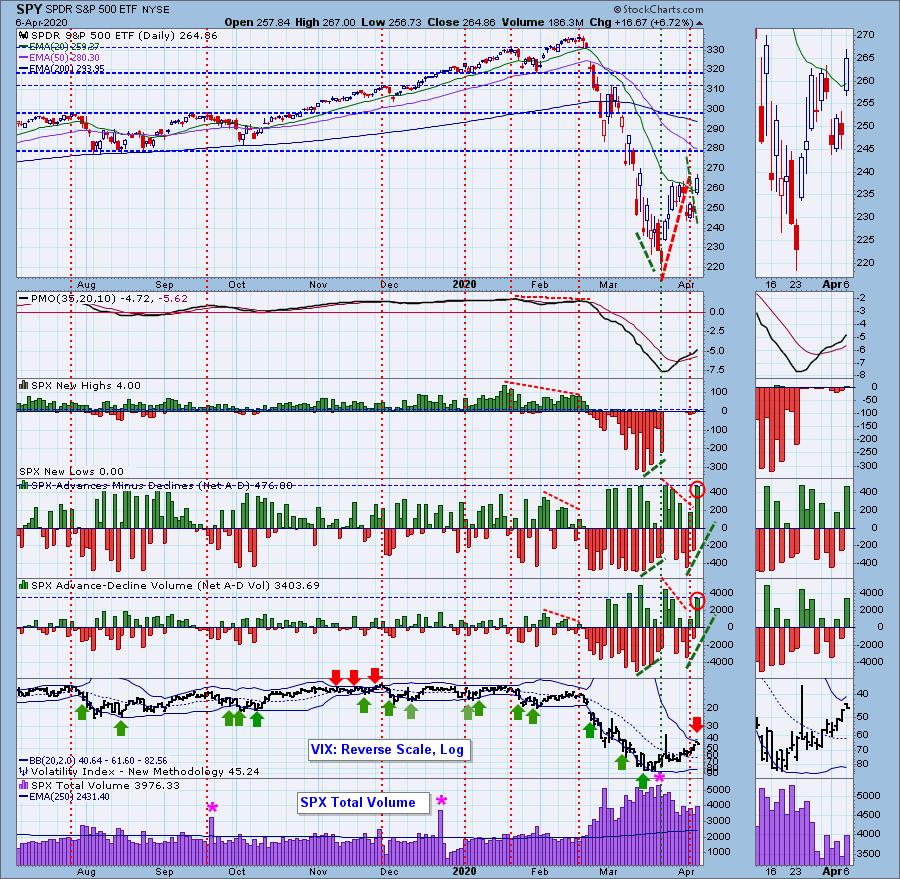
Climactic Market Indicators: These indicators were on it again. Rising bottoms on the negative Net A-D readings combined with today's positive climactic readings suggest a continuation of today's rally. Seeing the VIX up against its upper Bollinger Band would normally worry me, but considering a reading above 40 as overbought seems silly. The PMO is now accelerating higher as well.
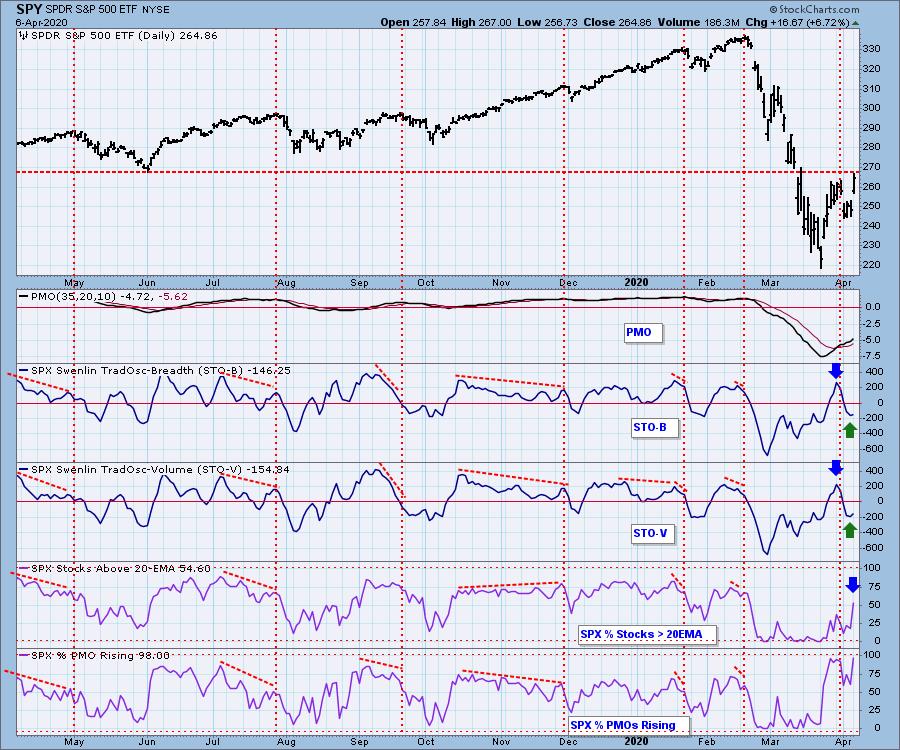
Short-Term Market Indicators: The ST trend is UP and the market condition is NEUTRAL based upon the Swenlin Trading Oscillator (STO) readings. STOs are definitely confirming today's rally. Seeing the vast improvement on stocks above their 20-EMA is also good, as we need participation in order to break out above the June low.
Intermediate-Term Market Indicators: The Silver Cross Index (% of SPX stocks 20EMA > 50EMA) gave us a positive crossover today which does confirm the current rally. The Golden Cross Index (percent of SPX stocks 50EMA > 200EMA) is still declining but decelerating as it approaches zero. I believe it is a good sign to see deceleration on the GCI, but we need it to actually bottom. Carl added the BPI for SPX on the chart for the DecisionPoint show and I really liked it, so I'll be using it more. Notice that it gave us a positive divergence BEFORE the rally off the low. We have a lot of indicator charts and I wish that I'd seen this one earlier. I'll be watching for declining tops on that indicator for a negative divergence with price to tell us when to expect the next leg down.
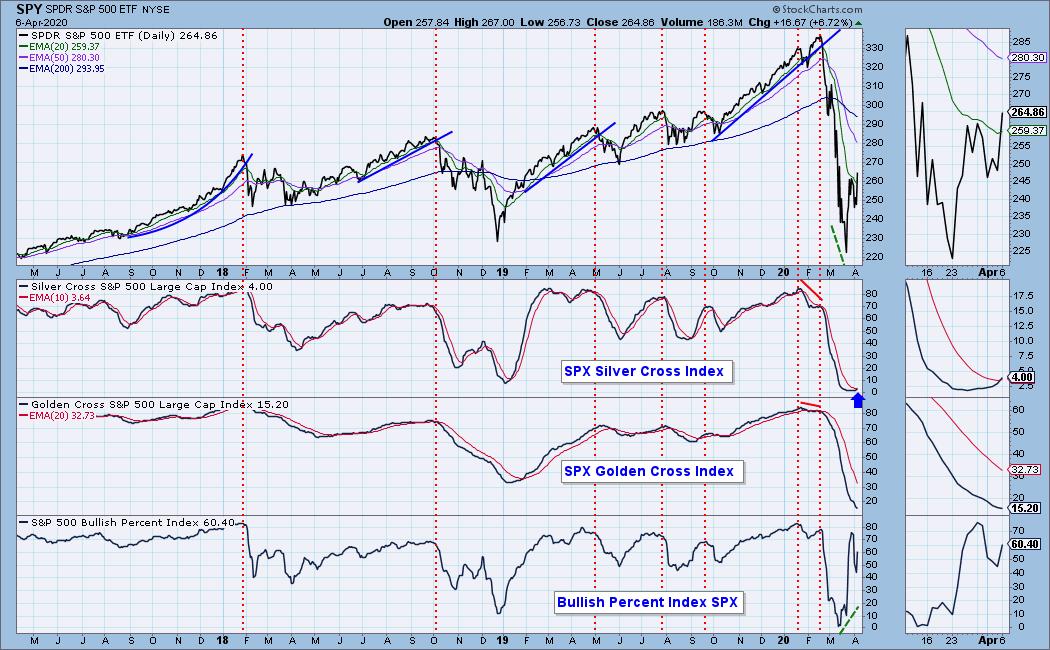
The IT trend is DOWN and the market condition is VERY OVERSOLD based upon all of the readings on the indicators below. Excellent look on the IT indicators. They had begun to top but today they have very clearly picked "up" as the direction they wish to travel in. They are still very oversold.
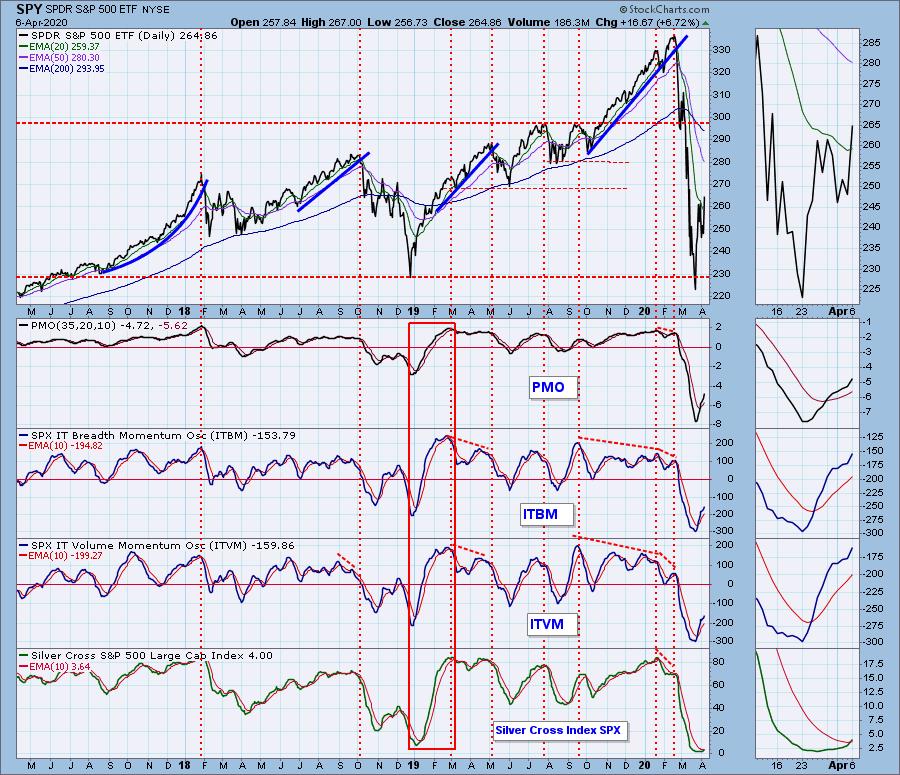
CONCLUSION: The ST is UP and IT trend is DOWN. Market condition based on ST indicators is NEUTRAL and based on IT indicators is OVERSOLD. The indicators in the short and intermediate term support more upside. I'm still nervous about overhead resistance and a less than optimum OBV. Carl and I agree that we aren't seeing this as the bear market low. A bear market typically lasts longer than one month. We do have to be nimble and take advantage of short-term rising trends when we can, but always be alert to negative indicator divergences to give us some warning when we might see a retest of the lows.
(Not a Diamonds subscriber? Add it to your DP Alert subscription and get a discount! Contact support@decisionpoint.com for your limited time coupon code!)
DOLLAR (UUP)
IT Trend Model: NEUTRAL as of 3/9/2020
LT Trend Model: BUY as of 5/25/2018
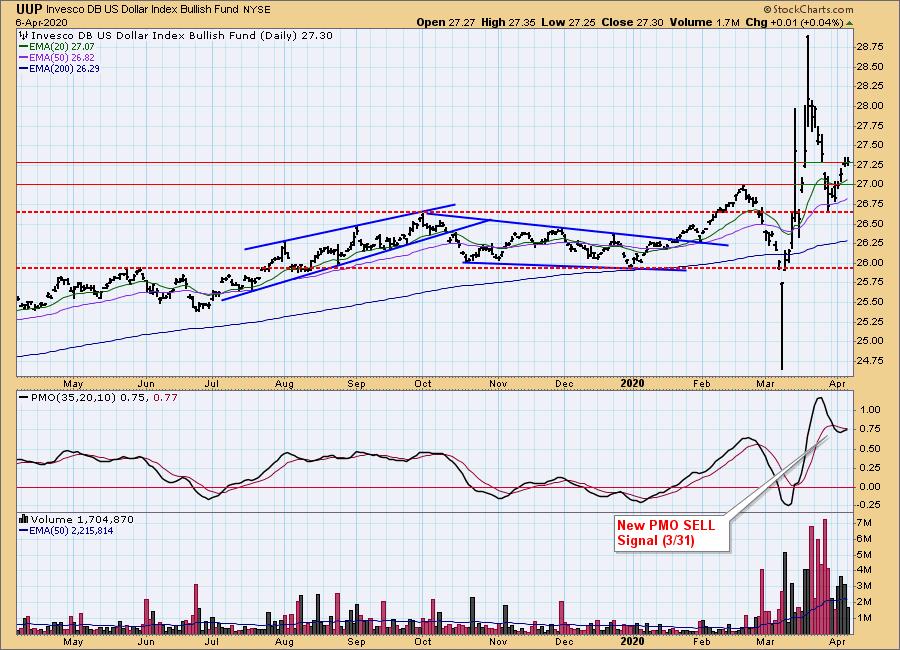
UUP Daily Chart: We nearly saw a PMO BUY signal on UUP today. I suspect we are looking at an island formation on price right now. My expectation is a drop back to $27, but the PMO doesn't agree with me. Seeing volume Friday and today moving lower suggests I could be right in the very short term.
GOLD
IT Trend Model: BUY as of 12/26/2019
LT Trend Model: BUY as of 1/8/2019
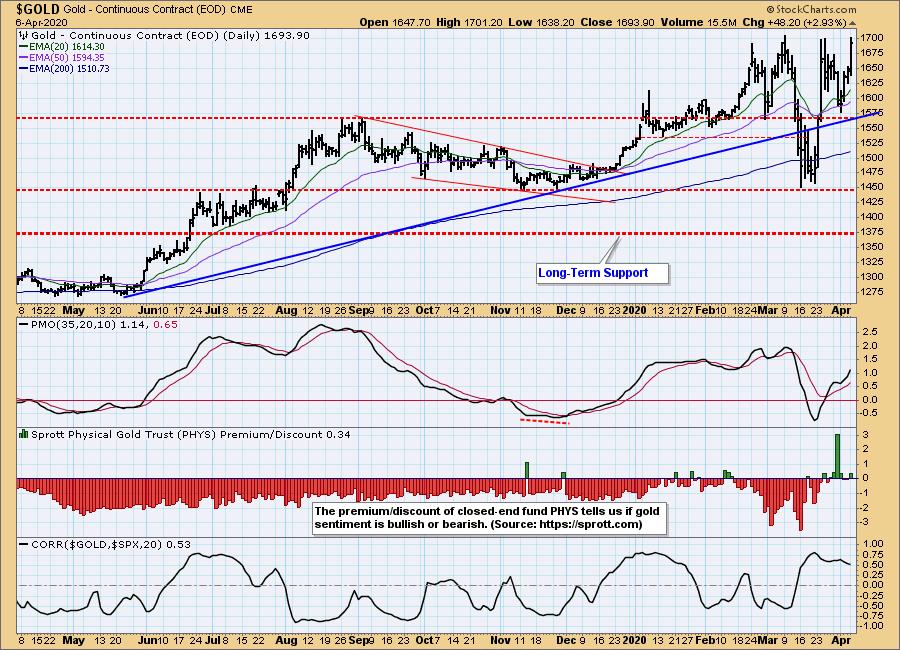
GOLD Daily Chart: Another great push higher for Gold. It looks like the flag has executed. The PMO is very positive. Watch key resistance at 1700.
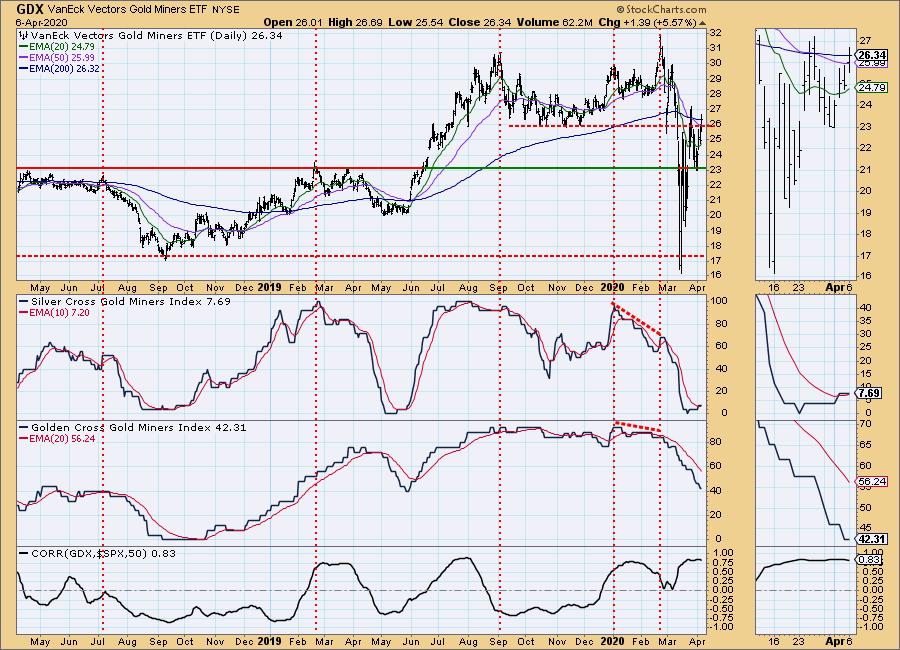
GOLD MINERS Golden and Silver Cross Indexes: The Silver Cross Index had a positive crossover today in oversold territory. The thumbnail shows a nice steady rising trend. GDX managed to close just above the 200-EMA. The Golden Cross Index is still mostly declining but it is harder to turn that one around. Remember it requires the 50-EMA > 200-EMA. Many components have seen price stretch well-below those EMAs so it could take more time to turn back up.
CRUDE OIL (USO)
IT Trend Model: Neutral as of 1/27/2020
LT Trend Model: SELL as of 2/3/2020
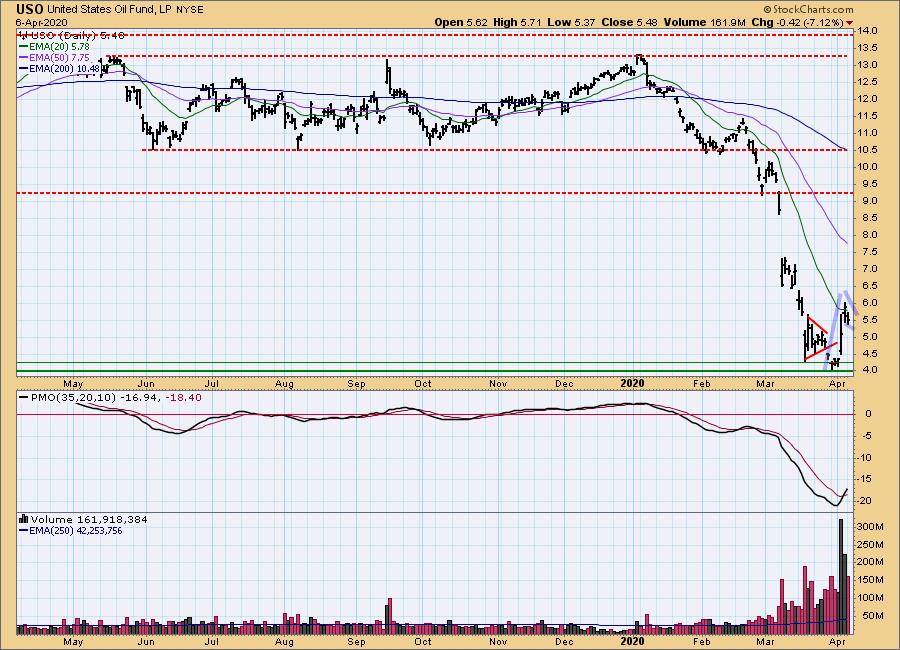
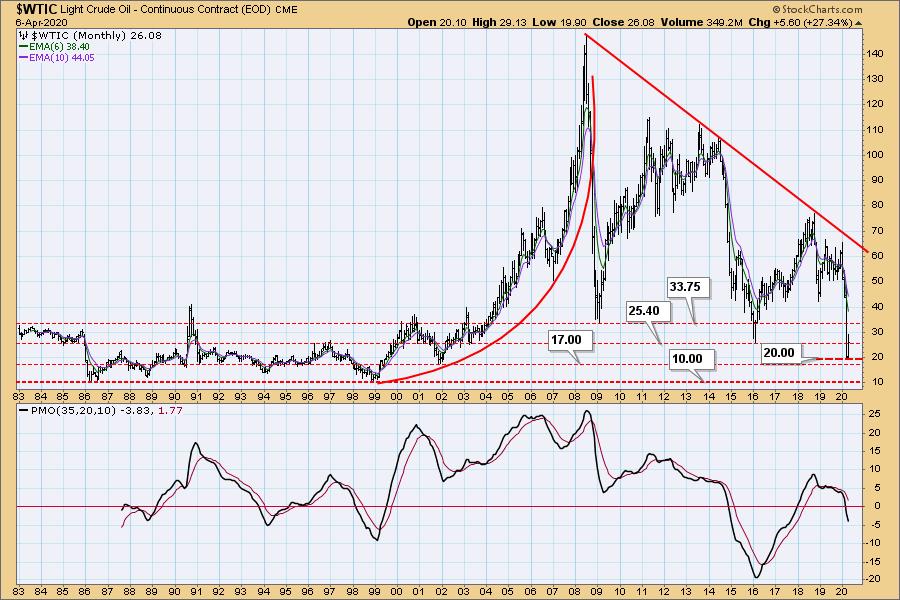
USO Daily Chart: Carl and I noted a possible bull flag forming on USO coming alongside a PMO BUY signal. This might be the time to get back in but, with USO price being so low, watch your position sizing. One bad day and all of these gains will be lost. We note that $20 is the new support level for $WTIC.
BONDS (TLT)
IT Trend Model: BUY as of 1/22/2020
LT Trend Model: BUY as of 1/2/2019
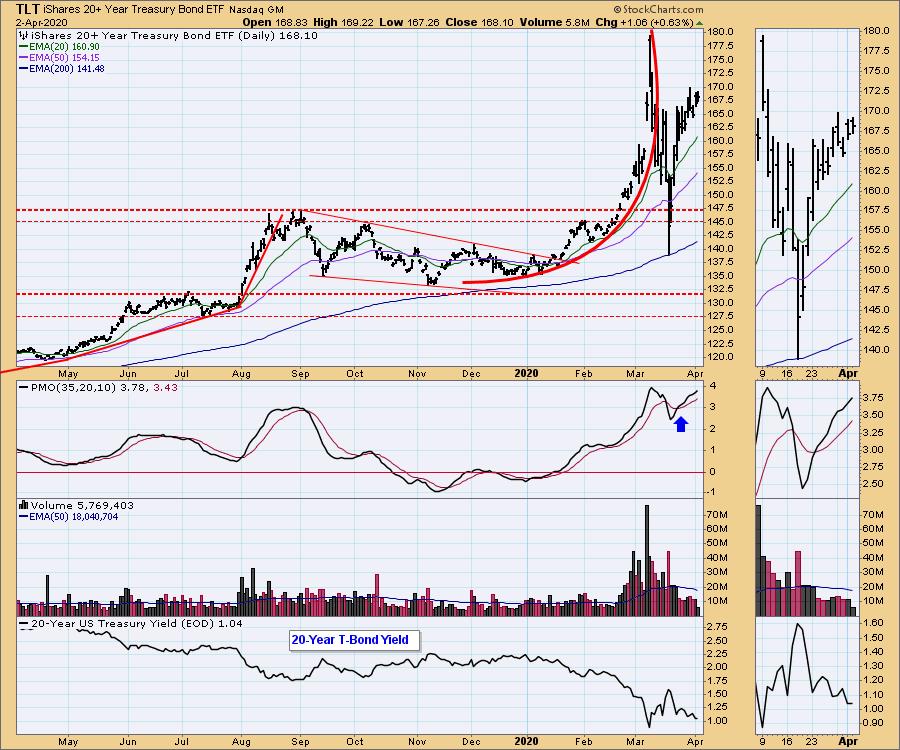
TLT Daily Chart: I still like bonds. $170 is current overhead resistance in the short term. The PMO is still very positive albeit very overbought. Volume seems to be moving lower and has been under its 50-EMA for some time as price is rising. I don't like seeing volume pulling back when price is rising. That usually is a prelude to a decline.
Charts from Today's DecisionPoint Show:
Have you subscribed the DecisionPoint Diamonds yet? DP does the work for you by providing handpicked stocks/ETFs from exclusive DP scans! Add it with a discount! Contact support@decisionpoint.com for more information!
Technical Analysis is a windsock, not a crystal ball.
Happy Charting! - Erin
Email: erin@decisionpoint.com
The May Money Show has been tentatively moved to August. We don't have the dates yet. Erin Swenlin will still be presenting at the The MoneyShow Las Vegas August 2020! You'll have an opportunity to meet Erin and discuss the latest DecisionPoint news and Diamond Scans. Claim your FREE pass here! You can watch online with this pass too!! There will be an online conference in May, stay tuned for details.
NOTE: The signal status reported herein is based upon mechanical trading model signals, specifically, the DecisionPoint Trend Model. They define the implied bias of the price index based upon moving average relationships, but they do not necessarily call for a specific action. They are information flags that should prompt chart review. Further, they do not call for continuous buying or selling during the life of the signal. For example, a BUY signal will probably (but not necessarily) return the best results if action is taken soon after the signal is generated. Additional opportunities for buying may be found as price zigzags higher, but the trader must look for optimum entry points. Conversely, exit points to preserve gains (or minimize losses) may be evident before the model mechanically closes the signal.
Helpful DecisionPoint Links (Can Be Found on DecisionPoint.com Links Page):
DecisionPoint Shared ChartList and DecisionPoint Chart Gallery
Price Momentum Oscillator (PMO)
Swenlin Trading Oscillators (STO-B and STO-V)
