
A subscriber wrote to us to express his objection to the use of cap-weighted indexes, and suggested that investors should use ETFs that track equal-weighted indexes. Capitalization-weighted indexes weight each component stock by its market cap, which, for example, results in the 50 largest S&P 500 stocks representing about 50% of the total index. I don't like it, but it is what it is, and we have to deal with it. It is more important to understand that cap-weighted and equal-weighted indexes perform differently at different times. Let's take a look at two ETFs that track the S&P 500 stocks: SPY, tracks the cap-weighted version, and RSP, which tracks the equal-weighted version. For the sake of brevity, assume my comments about SPY or RSP refer to all cap-weighted or equal-weighted indexes in general.
There are times when SPY will out-perform RSP, and vice-versa. There are also times when they will perform about the same. When there is an extended decline, RSP will usually decline faster than SPY. A good example of this is the recent decline from the February price top to the March low, which saw RSP decline -40% versus a -35% decline for SPY. Conversely, at the beginning of important advances, RSP will advance faster than SPY, such as the recent rally from the March low, from which RSP rallied +41% versus +35% for SPY. In both cases the difference is caused by the relative performance of the smaller-cap stocks in the index -- they are more likely to suffer during declines, and more likely to benefit during rallies.
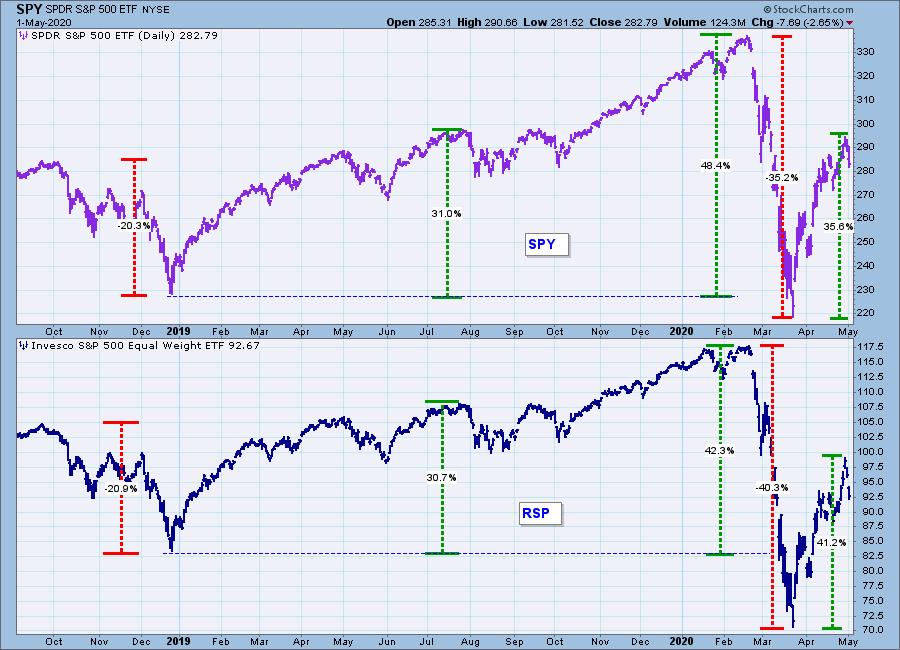
As a bull or bear market progresses, differences in performance tend to abate, such as we can see in the late-2018 decline, and then in the advance from the December 2018 low to the July 2019 top. In both cases SPY and RSP were virtually equal in performance.
Toward the end of a bull market advance, participation begins to narrow and large-cap stocks begin to out-perform smaller-cap stocks. A perfect example of this is the advance from the 2018 low to the February 2020 top. While performance was about equal from December 2018 to July 2019, by the February 2020 top SPY had advanced +48%, and RSP had only advanced by +42%.
If you only invest in individual stocks, the difference between cap-weighted and equal-weighted indexes is irrelevant to the performance of your portfolio; however, if you use index ETFs, it would pay to know when to expect the best or worst performance of each type of index. Also, being aware of relative performance of cap-weighted versus equal-weighted indexes is like having a thermometer to help you determine what phase the market is in.
The DecisionPoint Alert Weekly Wrap presents an end-of-week assessment of the trend and condition of the Stock Market, the U.S. Dollar, Gold, Crude Oil, and Bonds. The DecisionPoint Alert daily report (Monday through Thursday) is abbreviated and gives updates on the Weekly Wrap assessments.
Watch the latest episode of DecisionPoint on StockCharts TV's YouTube channel here!
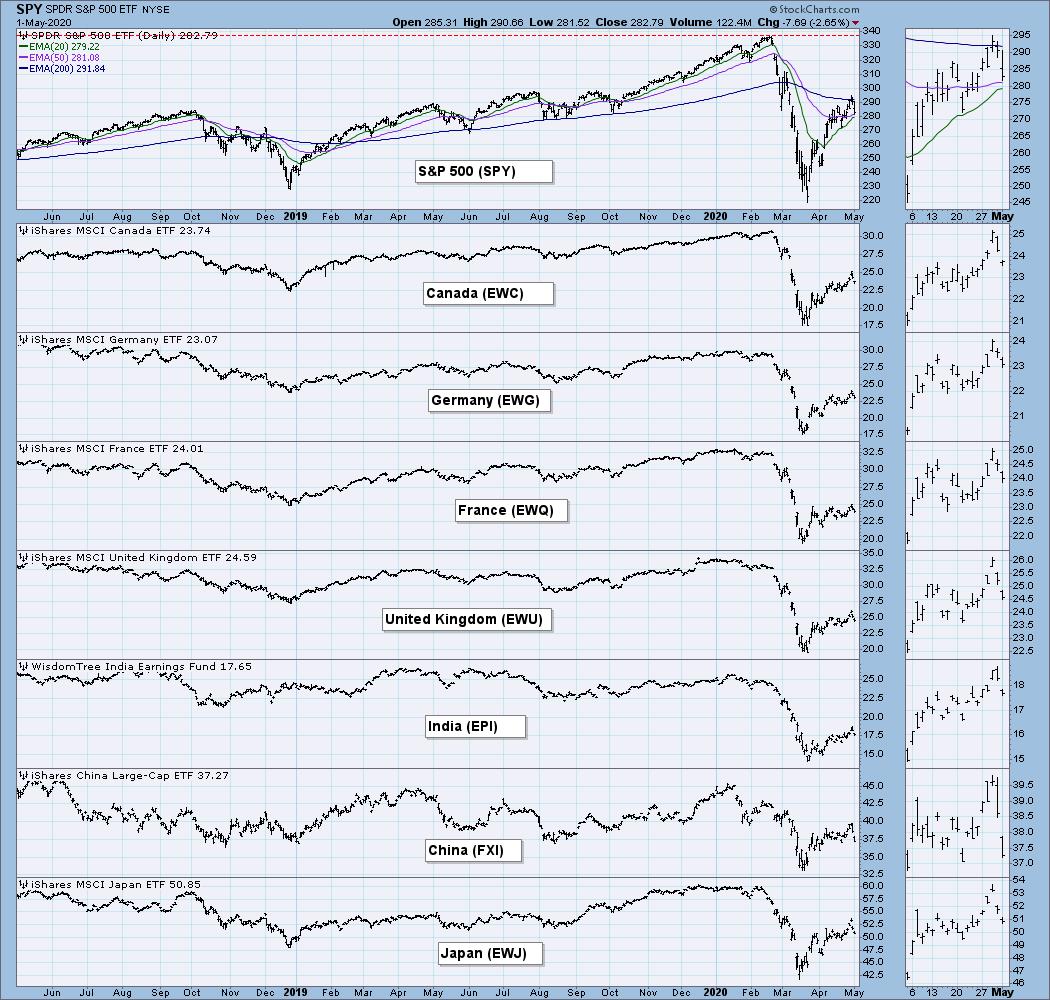
GLOBAL MARKETS
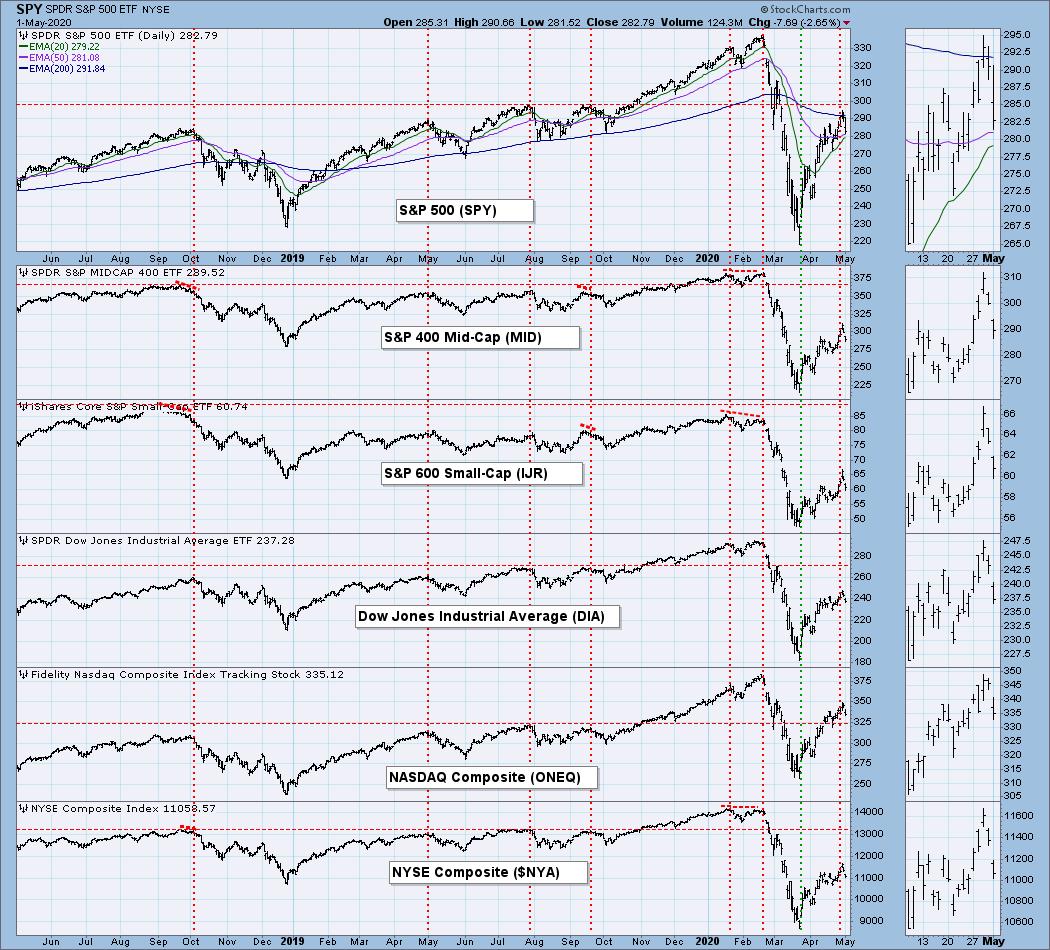
BROAD MARKET INDEXES
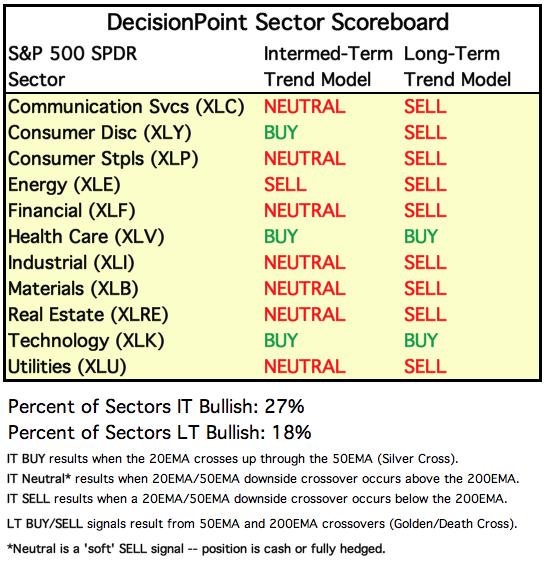
SECTORS
Each S&P 500 Index component stock is assigned to one, and only one, of 11 major sectors. This is a snapshot of the Intermediate-Term (Silver Cross) and Long-Term (Golden Cross) Trend Model signal status for those sectors.
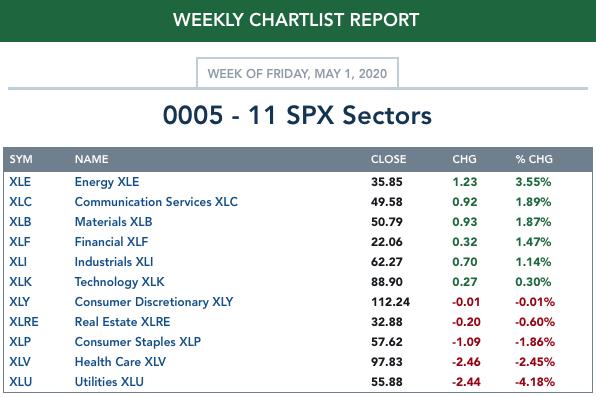
ETF TRACKER: This is a list of about 100 ETFs intended to track a wide range of U.S. market indexes, sectors, global indexes, interest rates, currencies, and commodities. StockCharts.com subscribers can acquire it in the DecisionPoint Trend and Condition ChartPack.
Top 10 . . .
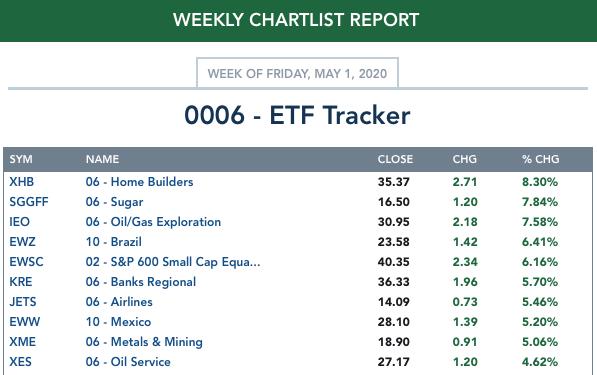
. . . and bottom 10: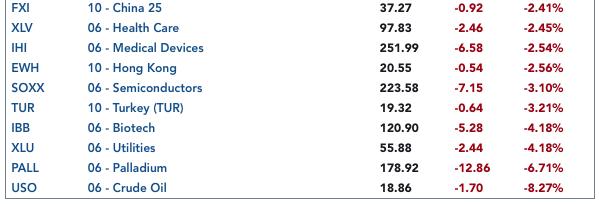
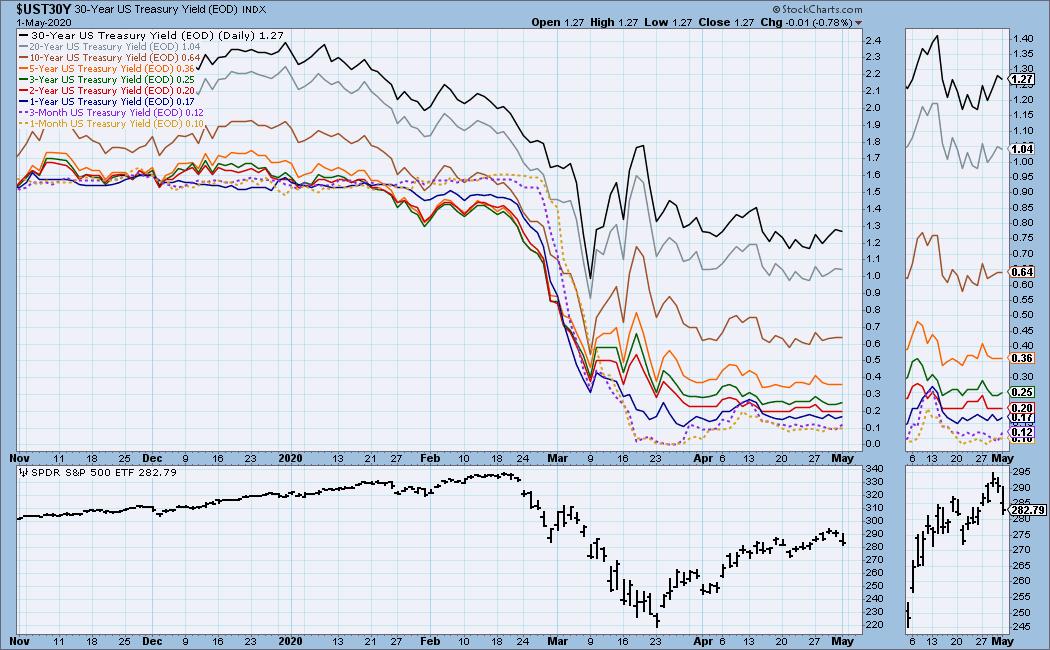
INTEREST RATES
This chart is included so we can monitor rate inversions. In normal circumstances the longer money is borrowed the higher the interest rate that must be paid. When rates are inverted, the reverse is true.
STOCKS
IT Trend Model: NEUTRAL as of 2/28/2020
LT Trend Model: SELL as of 3/19/2020
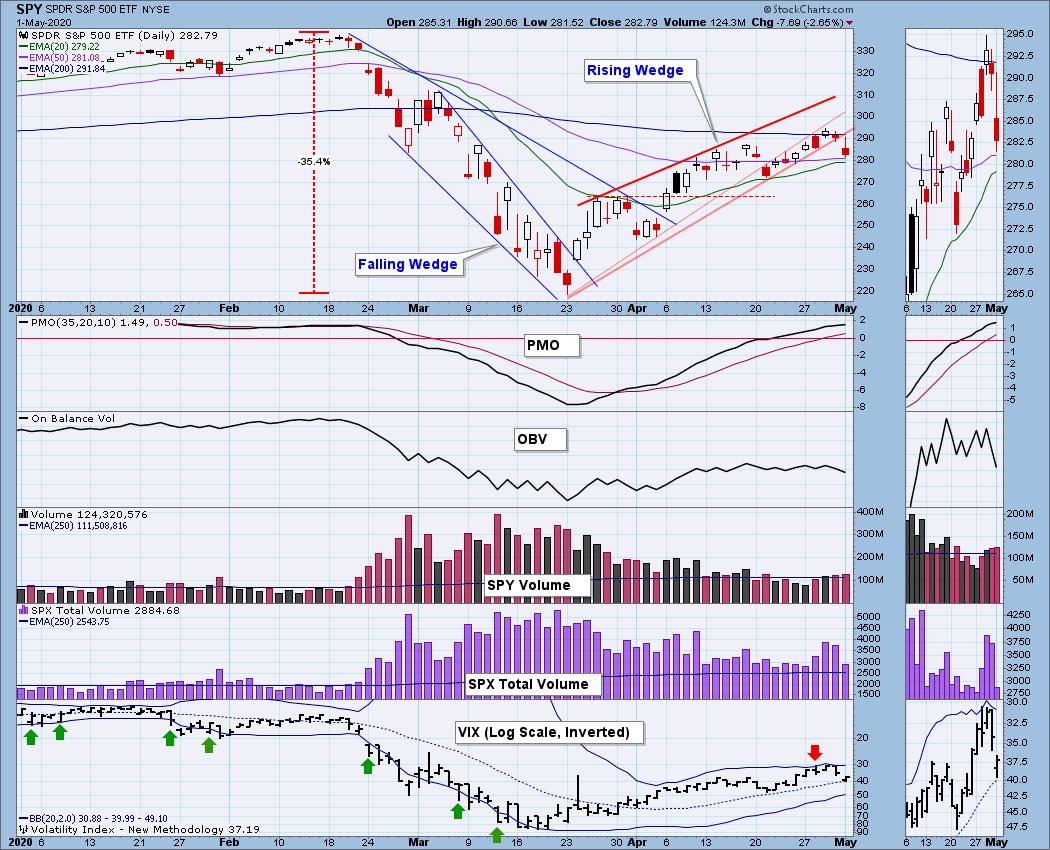
SPY Daily Chart: Two weeks ago the initial rising wedge broke down, then price began squeezing higher along the bottom of the wedge. I redrew the rising trend line, creating a new and improved wedge, and it broke down today. I remarked on to Erin on Wednesday on our StockCharts TV show that the market has been "feeling" somewhat like it did before the crash -- wanting to go up, not wanting to go down. This leaves me wondering if today's decline will prove to be another disappointment to my inner bear.
I should point out how the upper Bollinger Band on the VIX gives an overbought signal when the VIX touches it. It's not infallible, of course, but it is a good attention flag for sure.
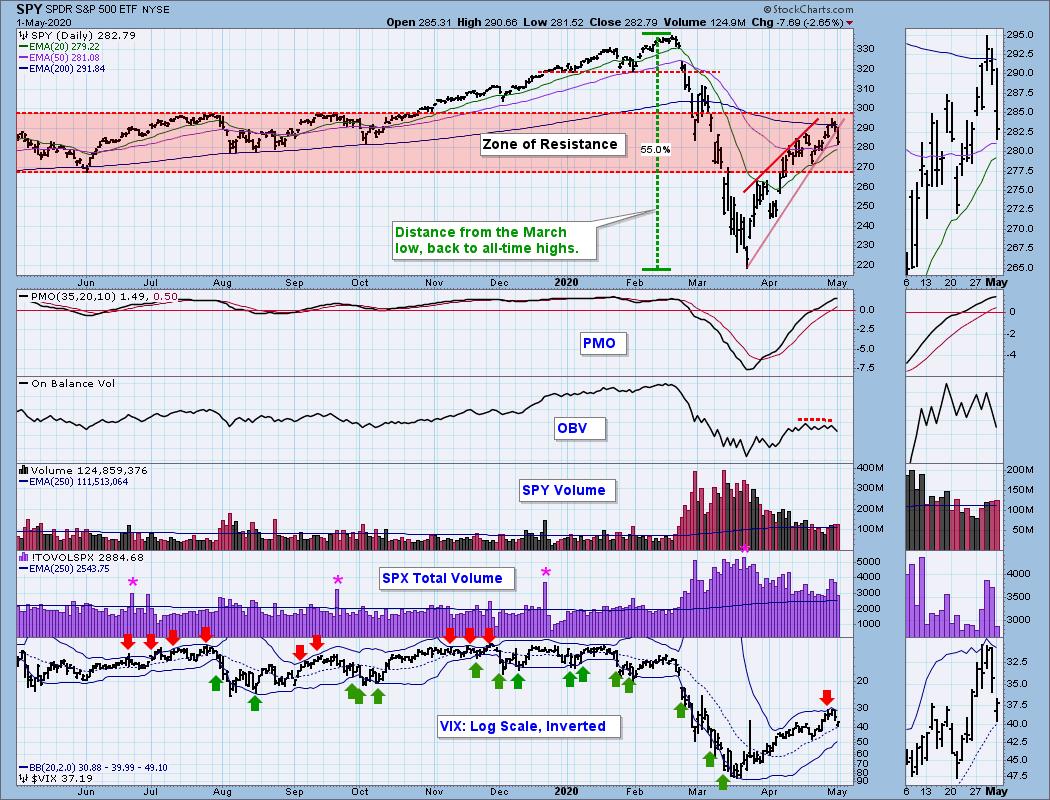
It looks as if the resistance zone is slowing the advance, and there is an OBV negative divergence.
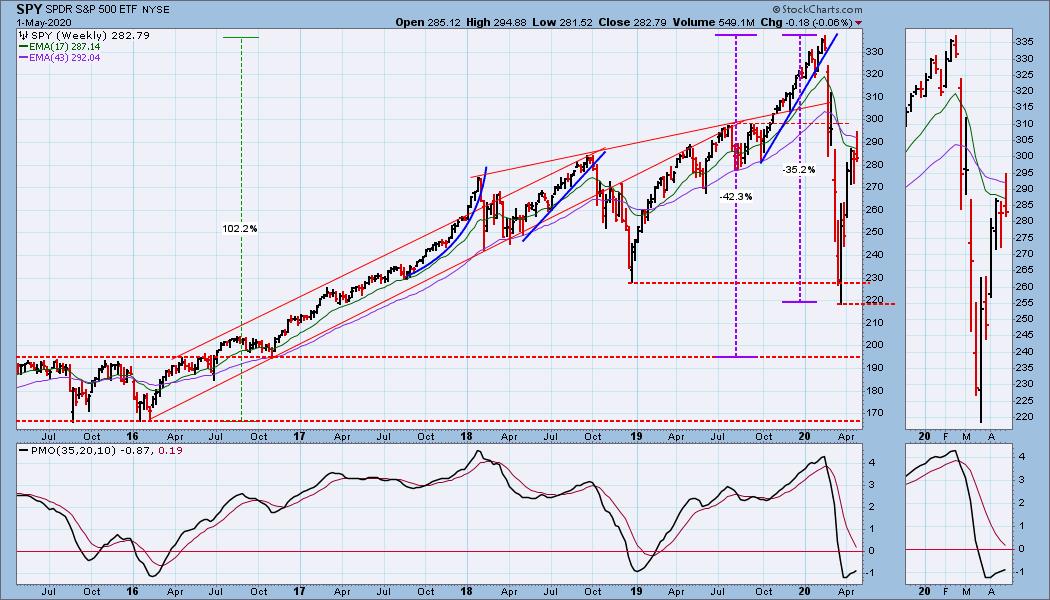
SPY Weekly Chart: What started as a stellar week ended slightly down. The weekly PMO is flattening. If it turns down, that would be very bearish.
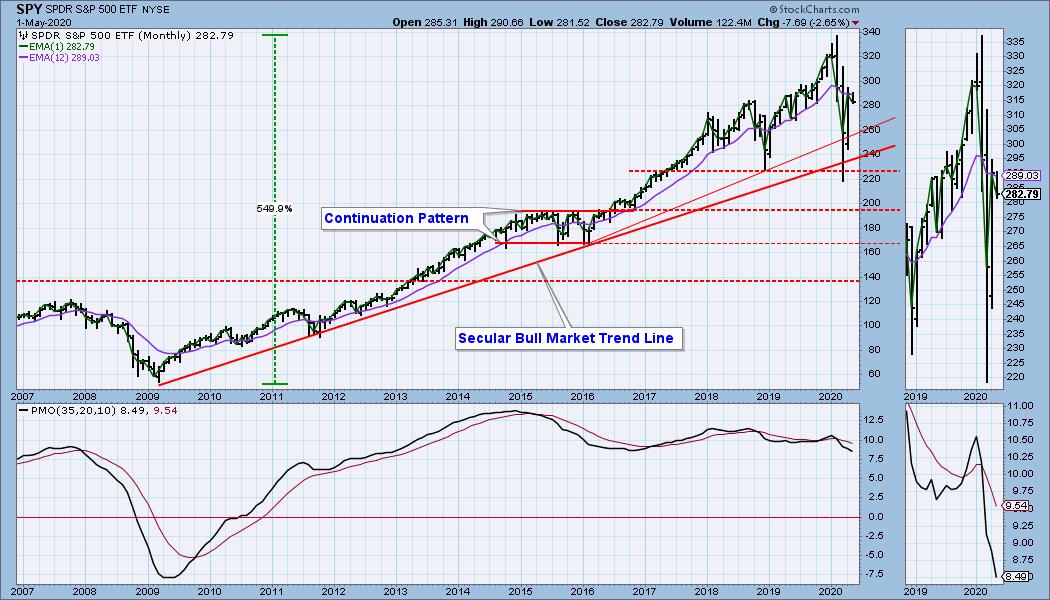
SPY Monthly Chart: Objectively speaking, we have to say that the secular bull market rising trend line has been recaptured.
Climactic Market Indicators: There were two climactic down days. Since price was coming off of a top, I'll interpret that as a downside initiation climax.
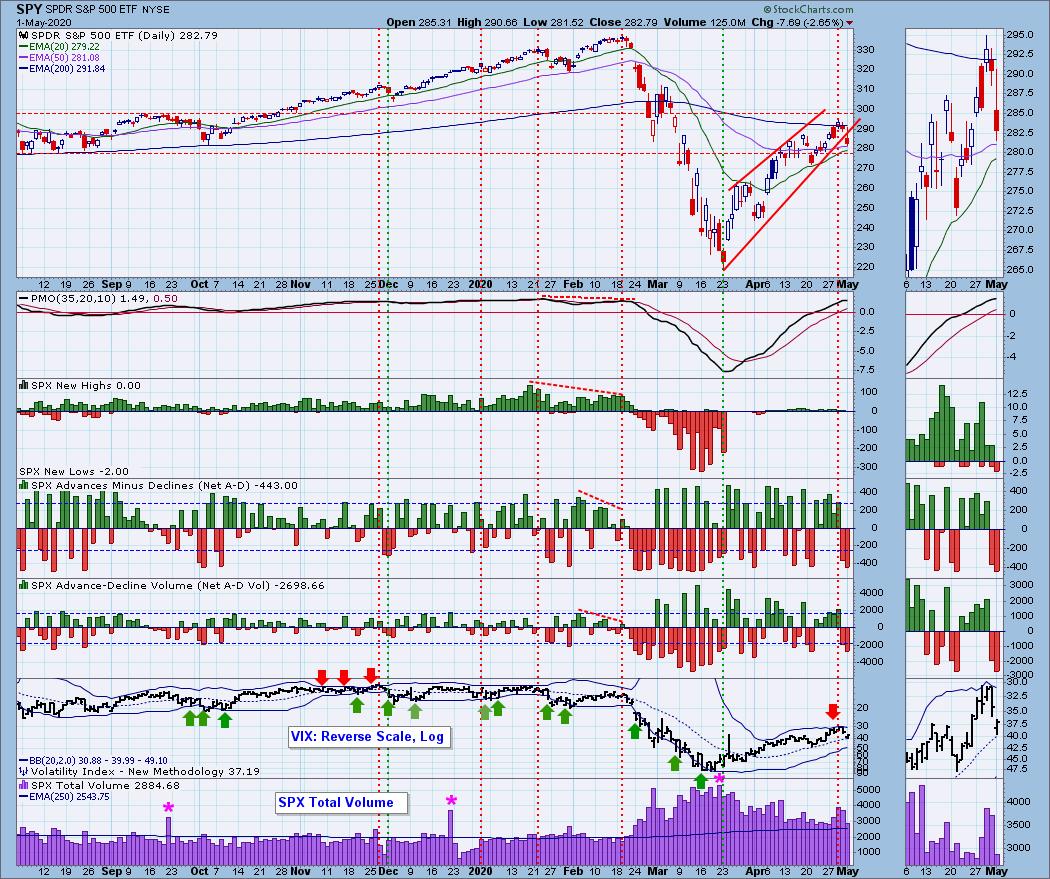
Short-Term Market Indicators: The short-term market trend is DOWN and the condition is OVERBOUGHT.
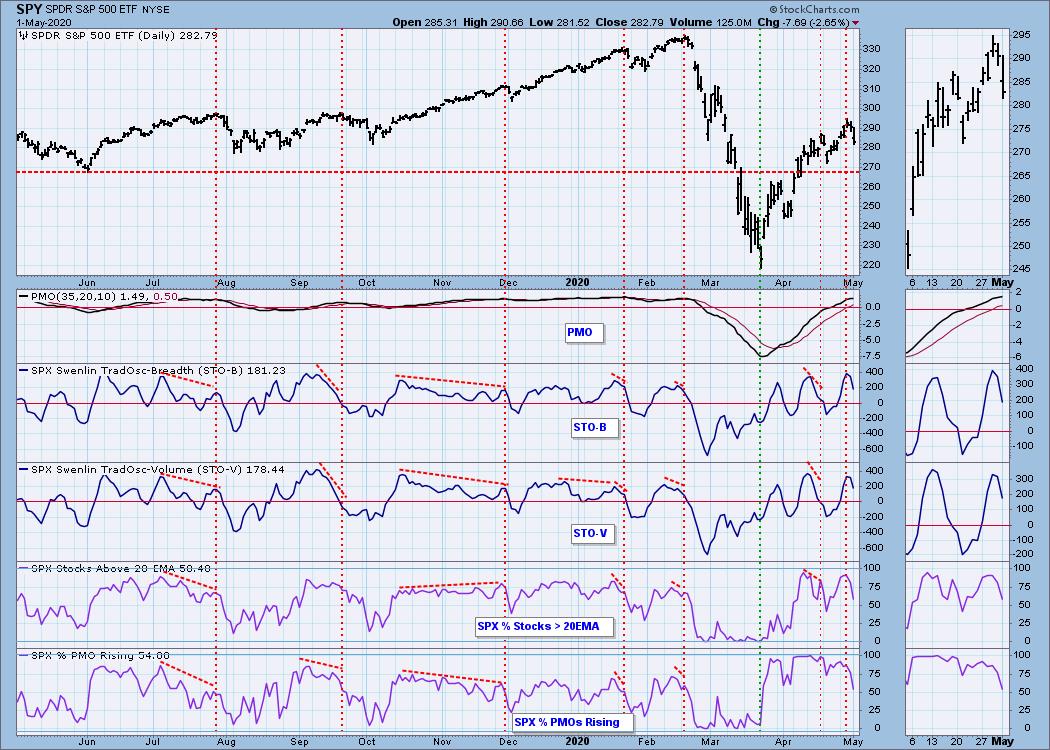
Intermediate-Term Market Indicators: The Bullish Percent Index has a negative divergence.
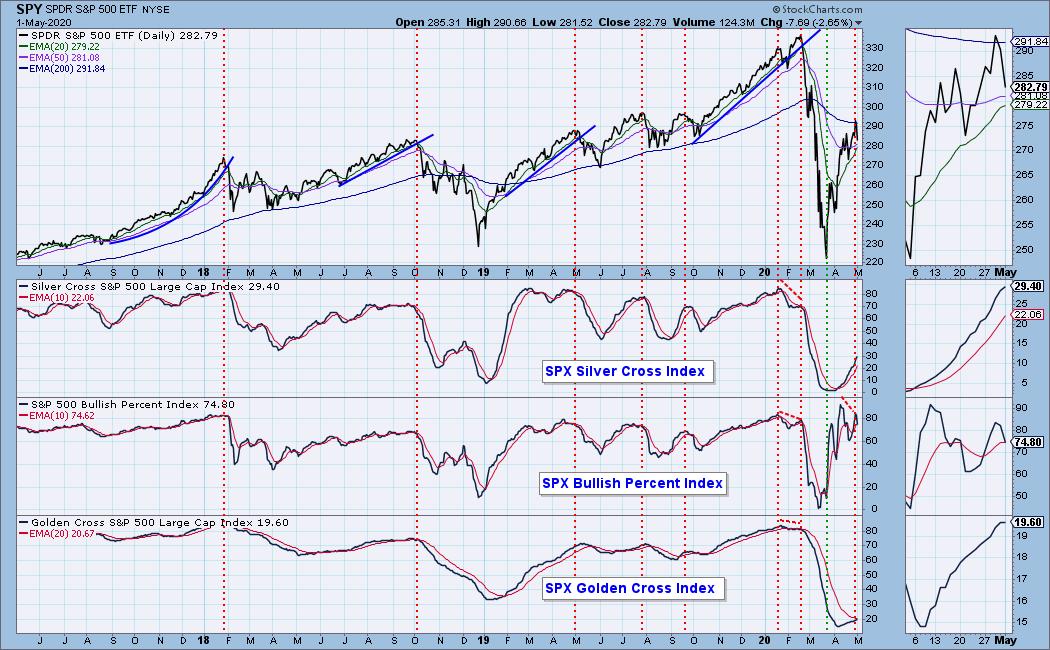
While the intermediate-term market trend is UP, the condition is OVERBOUGHT, and it is probable that a change in trend has commenced. Note that the PMO is near the top of its three-year range and is quite overbought. Based upon the distance traveled from their the March low, the ITBM and ITVM are also overbought, and they topped today.
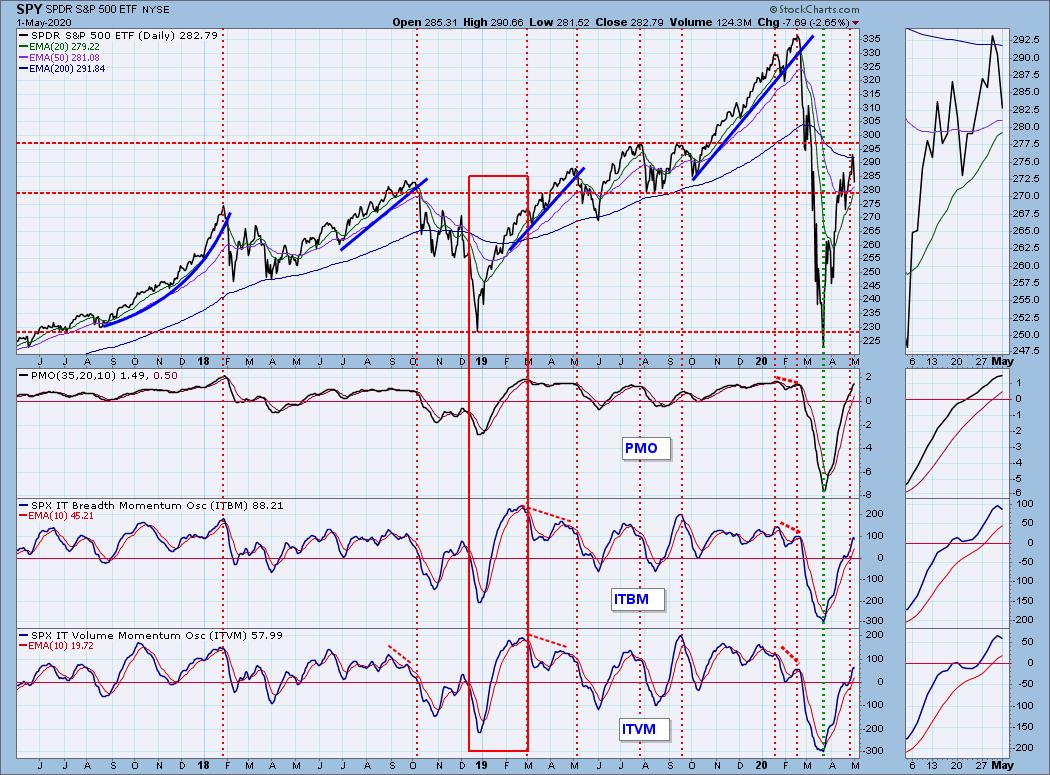
CONCLUSION: As of today, the 6-Month Seasonality will be unfavorable until October 30. With such massively turbulent fundamental forces currently at work, I'm not sure seasonality matters, but, to be sure, it's not going to help the situation.
Earnings for 2020 Q1 are coming in, and for the most part, they do not reflect the problems that rolled over us in April. Investors know that Q2 will be much worse, but they seem to be "looking across the valley" to the happy days on the other side. Standby for the rude awakening.
Short-term indicators are still somewhat overbought and falling, putting them in gear with the overbought intermediate-term indicators, which are just topping. Technically, this is a great bearish setup, and it should be good for more than just a quick pullback.
Have you subscribed the DecisionPoint Diamonds yet? DP does the work for you by providing handpicked stocks/ETFs from exclusive DP scans! Add it with a discount! Contact support@decisionpoint.com for more information!
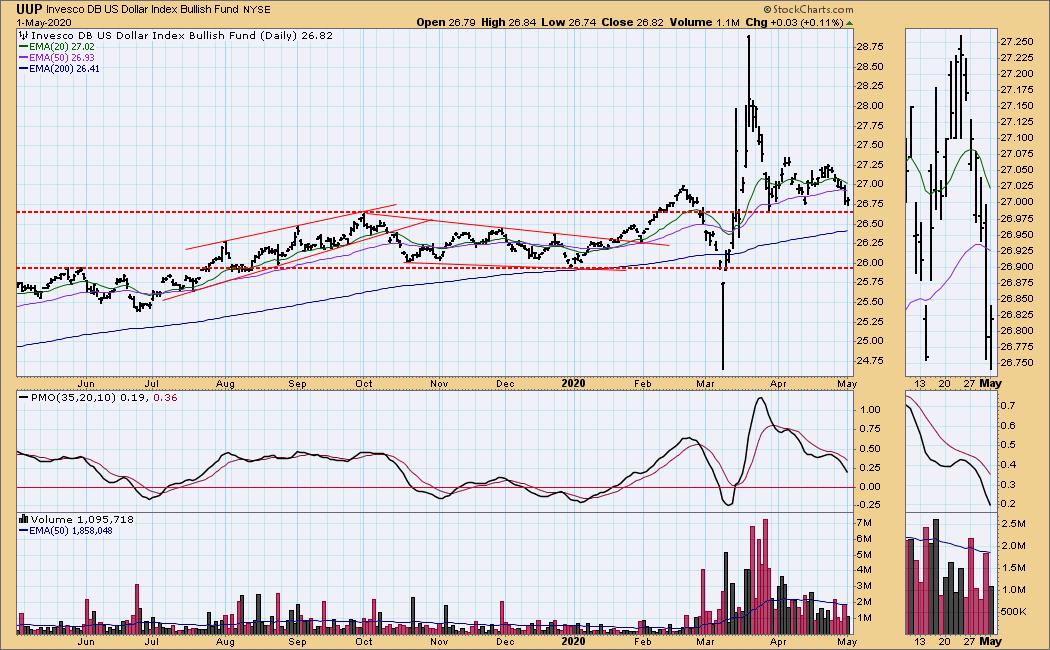
DOLLAR (UUP)
IT Trend Model: BUY as of 3/13/2020
LT Trend Model: BUY as of 5/25/2018
UUP Daily Chart: I think we need to view the March volatility as an outlier, in other words, ignore it. Price is below the 20EMA and 50EMA, and the PMO is falling. I read this as probable continuation of the weakness.
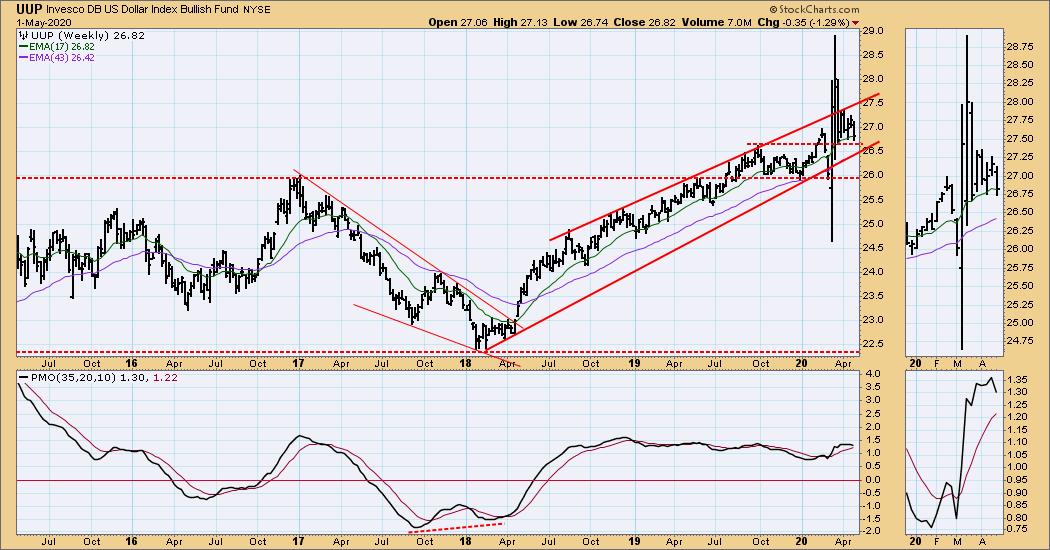
UUP Weekly Chart: The rising trend channel dominates this chart. The weekly PMO is falling, but overall it is moving sideways.
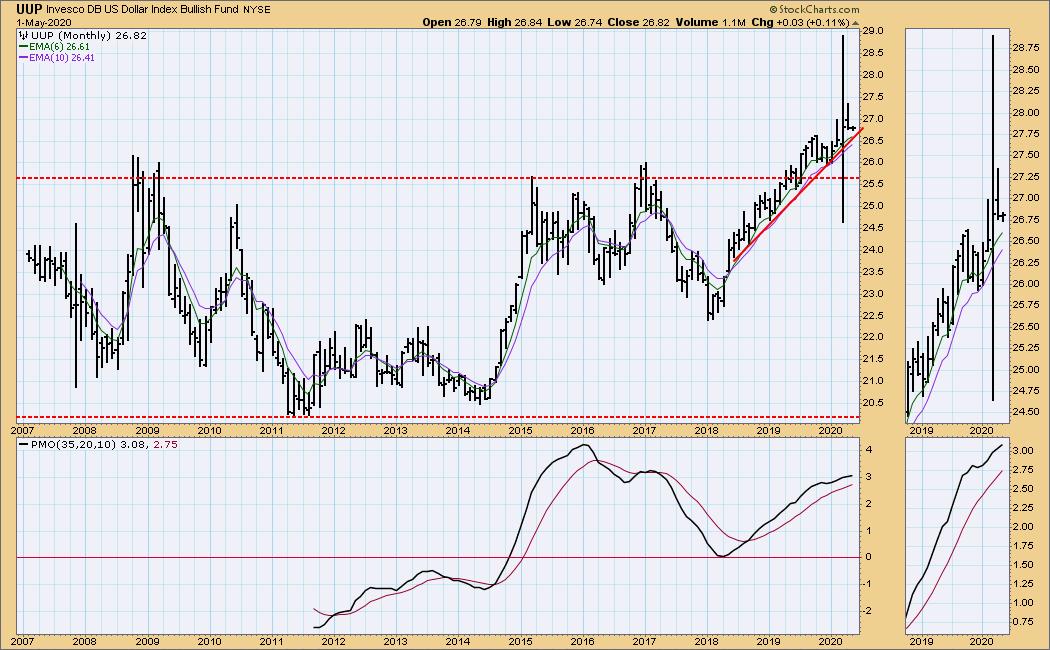
UUP Monthly Chart: The rising trend looks solid in this time frame.
GOLD
IT Trend Model: BUY as of 12/26/2019
LT Trend Model: BUY as of 1/8/2019
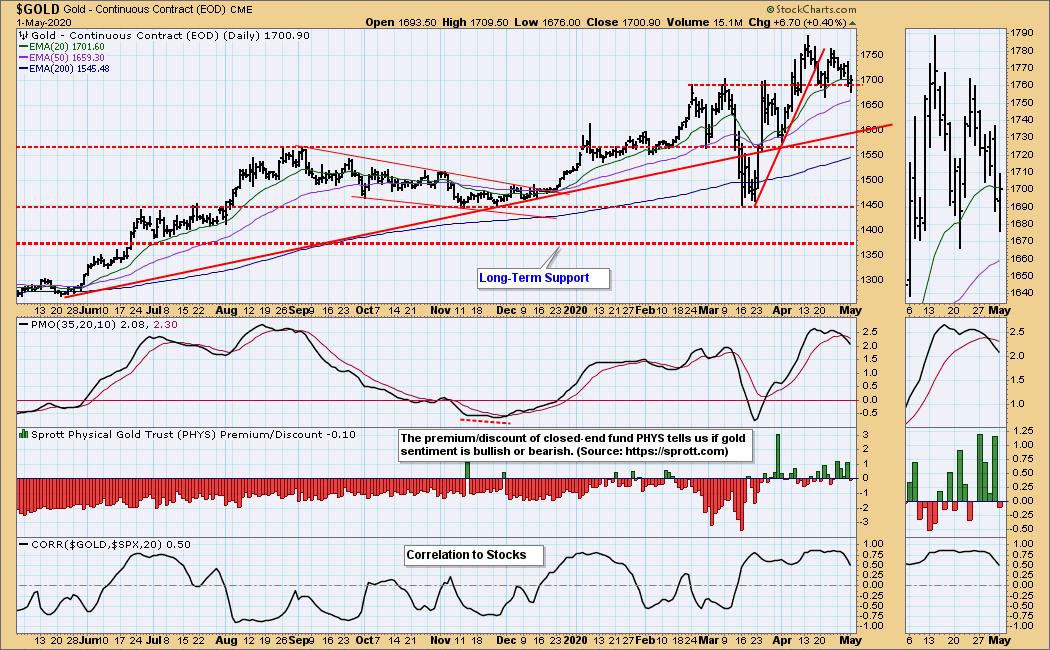
GOLD Daily Chart: The overbought daily PMO has crossed down through the signal line, so some weakness, possibly continued sideways movement will continue for a few weeks. Note that sentiment is becoming more persistently bullish.
GOLD Weekly Chart: March volatility pushed price down through the rising trend line, but I'm considering that to be an outlier abd that the rising trend line is still valid.
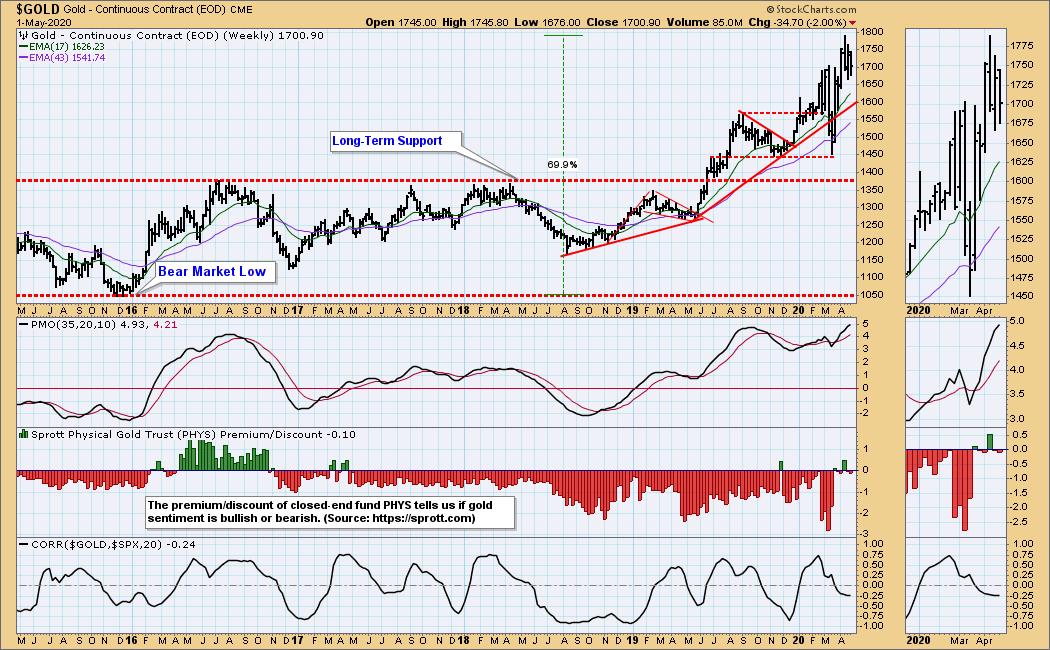
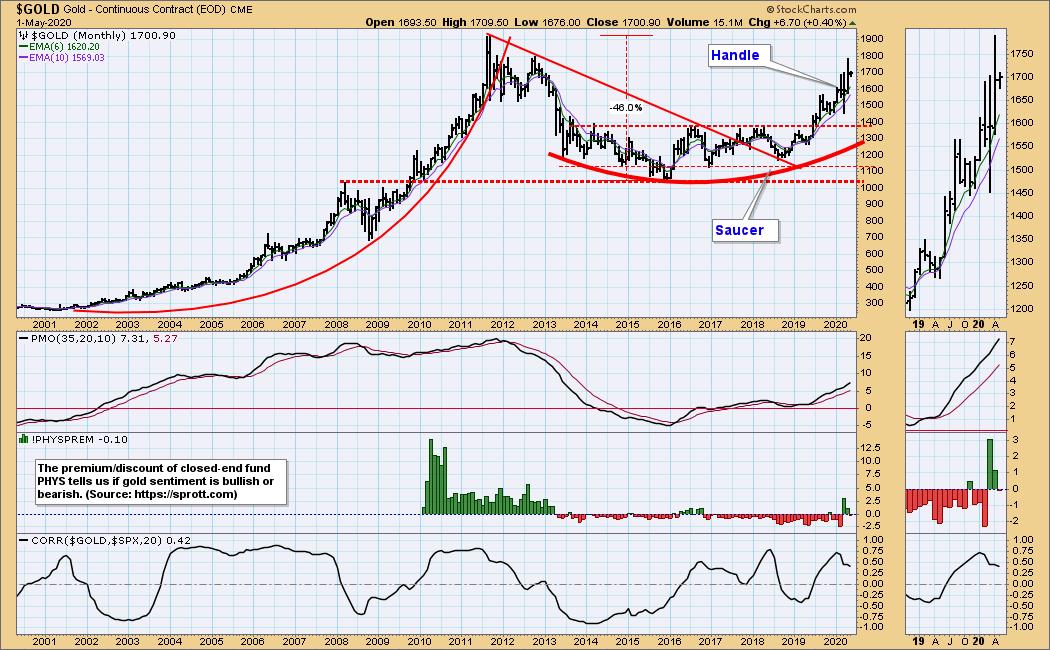
GOLD Monthly Chart: Gold, still coming out of the saucer, looks thoroughly bullish in this time frame.
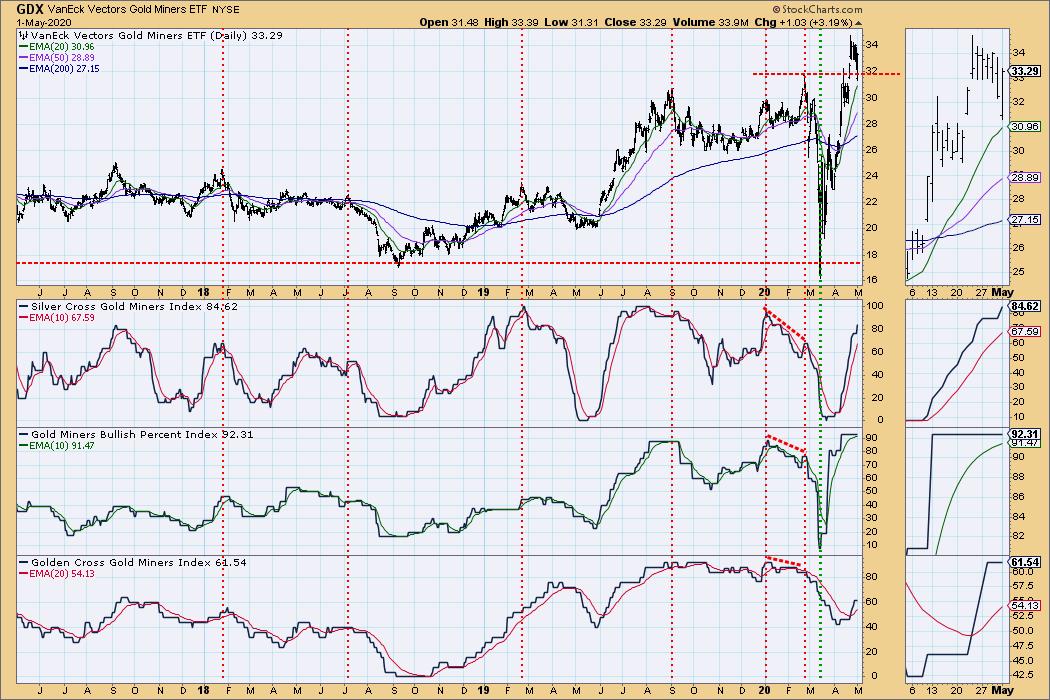
GOLD MINERS Golden and Silver Cross Indexes: GDX dropped down below support briefly today, but it closed back above the line. That top cluster looks like a bullish flag, albeit a little droopy.
CRUDE OIL (USO)
IT Trend Model: NEUTRAL as of 1/27/2020
LT Trend Model: SELL as of 2/3/2020
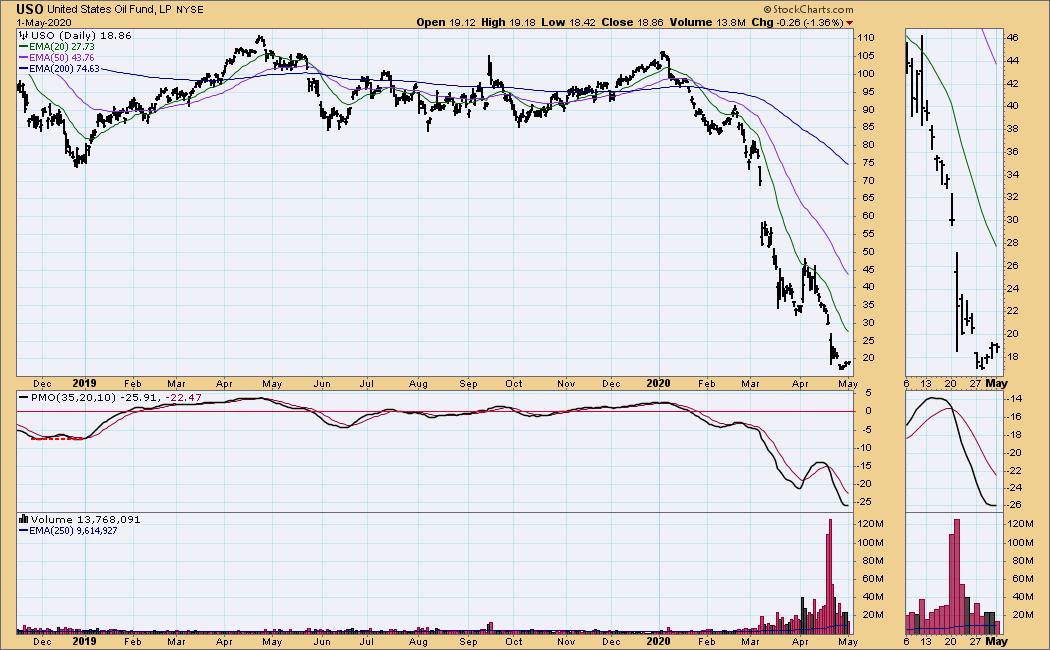
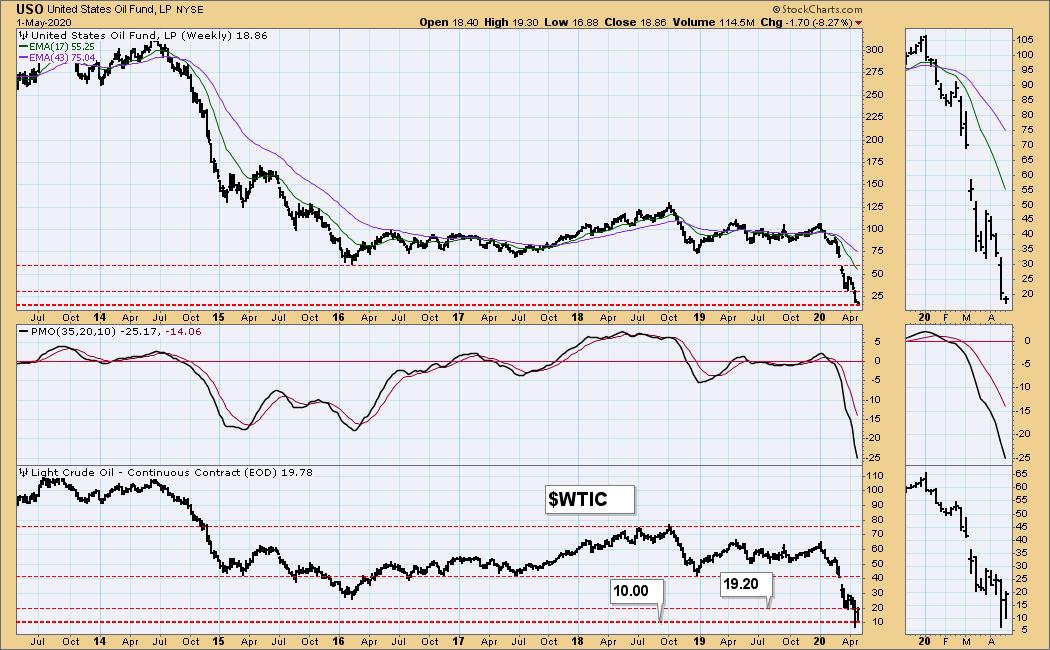
USO Daily Chart: Last week I mentioned that USO was so low, so close to the zero line, that I thought it might reverse split. On Wednesday it did just that with an 1:8 reverse split, giving it plenty of room to decline without hitting bottom. In his 10th Man newsletter Jared Dillian gave a great description of how this ETF works. It's not long and is worth a read.
USO is very oversold now, but the oversupply problem is still not worked out. With the economy opening up, some of the pressure will be relieved, and maybe we won't have to worry any longer about the near contract going below zero.
USO Weekly Chart: WTIC dropped below the long-term support line at $10.00 briefly, but that still looks like solid support. The weekly PMO is very oversold.
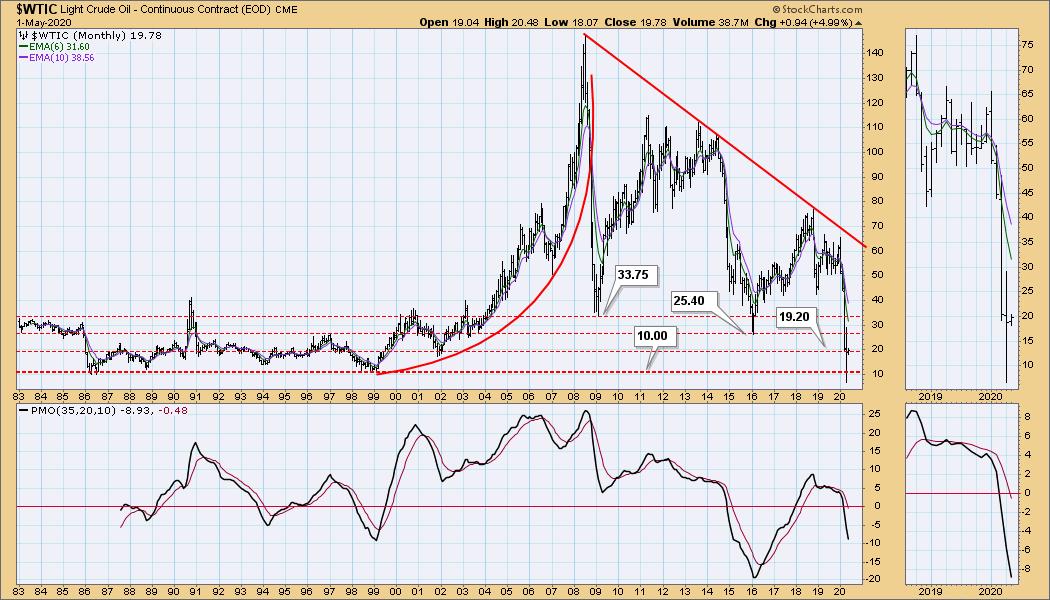
WTIC Monthly Chart: Again, the support at $10.00 looks solid.
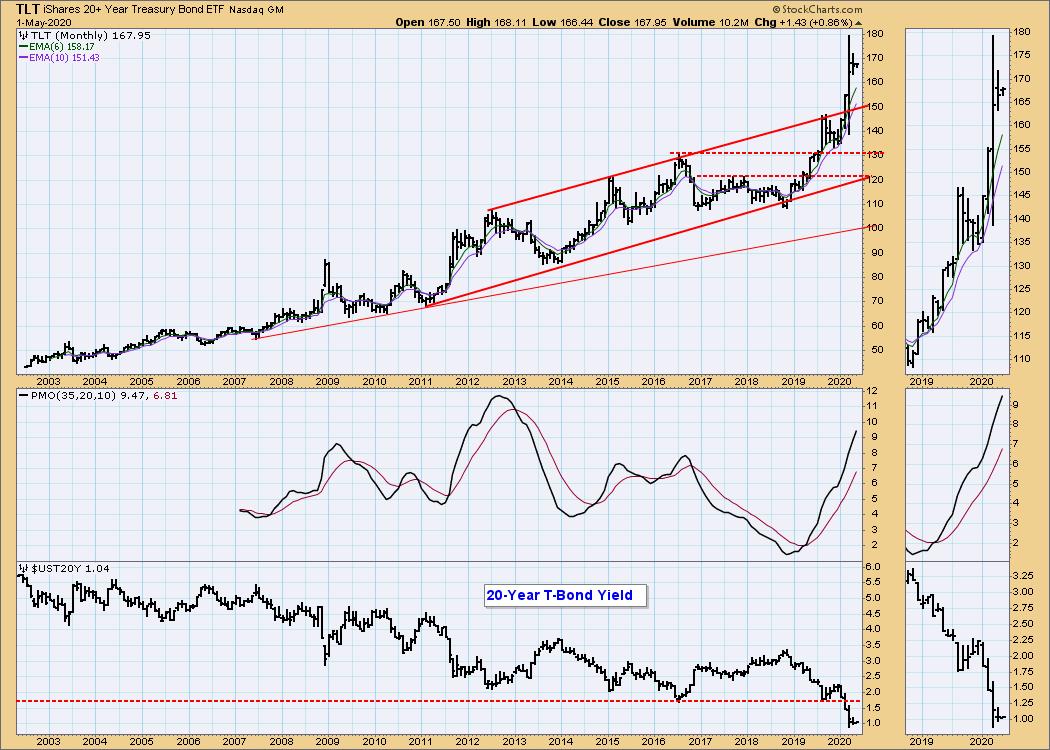
BONDS (TLT)
IT Trend Model: BUY as of 1/22/2020
LT Trend Model: BUY as of 1/2/2019
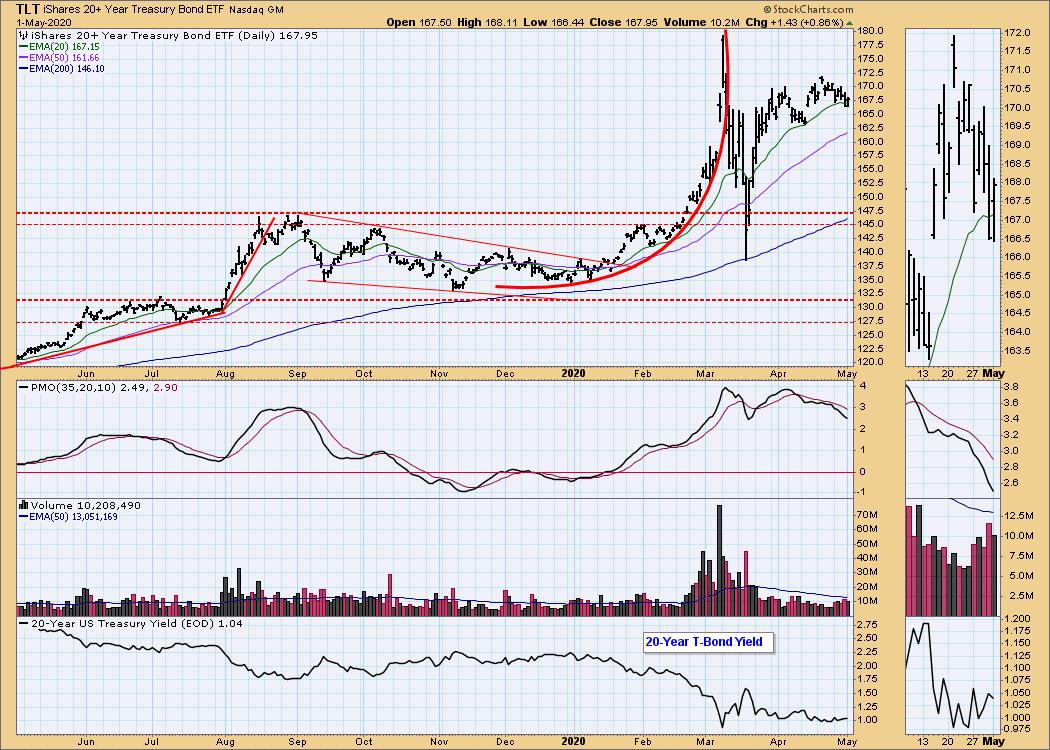
TLT Daily Chart: As with the dollar and gold, bonds experienced some wild swings in March. With yield at 0ne percent, I'd guess that the March top is the probable limit to the upside. Price looks as if it is trying to roll over, or at least settle into a sideways pattern.
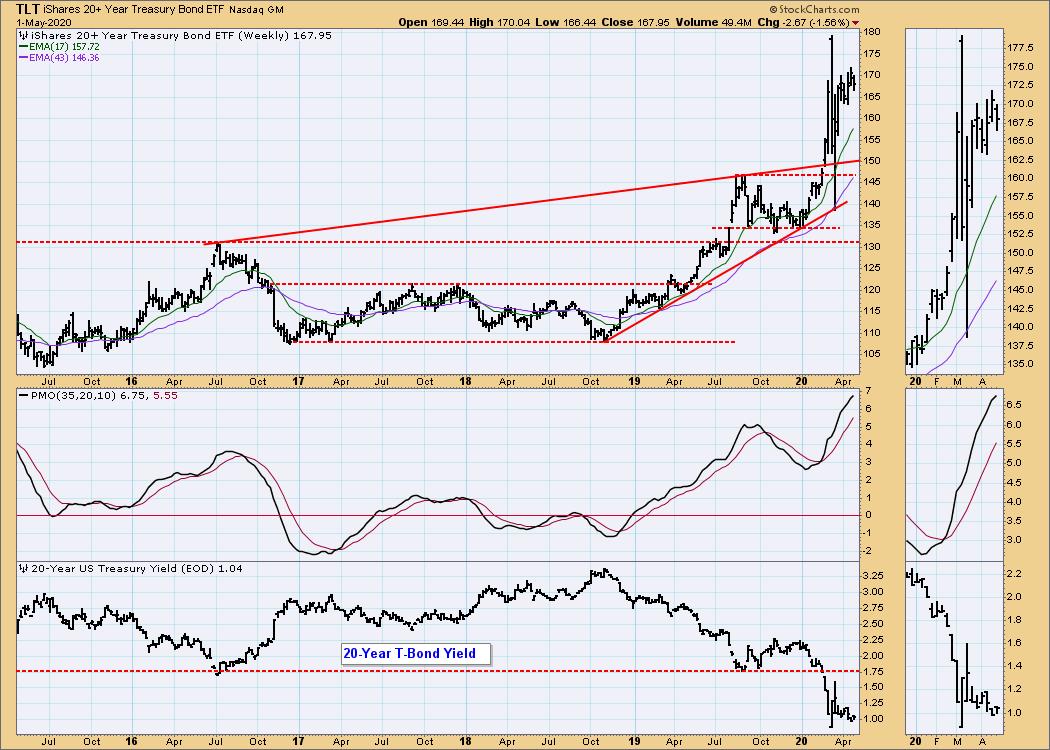
TLT Weekly Chart: Based upon the high monthly PMO reading, bonds are very overbought in this time frame.
TLT Monthly Chart: Again, very overbought.
Technical Analysis is a windsock, not a crystal ball.
Happy Charting! - Carl
NOTE: The signal status reported herein is based upon mechanical trading model signals, specifically, the DecisionPoint Trend Model. They define the implied bias of the price index based upon moving average relationships, but they do not necessarily call for a specific action. They are information flags that should prompt chart review. Further, they do not call for continuous buying or selling during the life of the signal. For example, a BUY signal will probably (but not necessarily) return the best results if action is taken soon after the signal is generated. Additional opportunities for buying may be found as price zigzags higher, but the trader must look for optimum entry points. Conversely, exit points to preserve gains (or minimize losses) may be evident before the model mechanically closes the signal.
Helpful DecisionPoint Links:
DecisionPoint Alert Chart List
DecisionPoint Golden Cross/Silver Cross Index Chart List
DecisionPoint Sector Chart List
Price Momentum Oscillator (PMO)
Swenlin Trading Oscillators (STO-B and STO-V)