
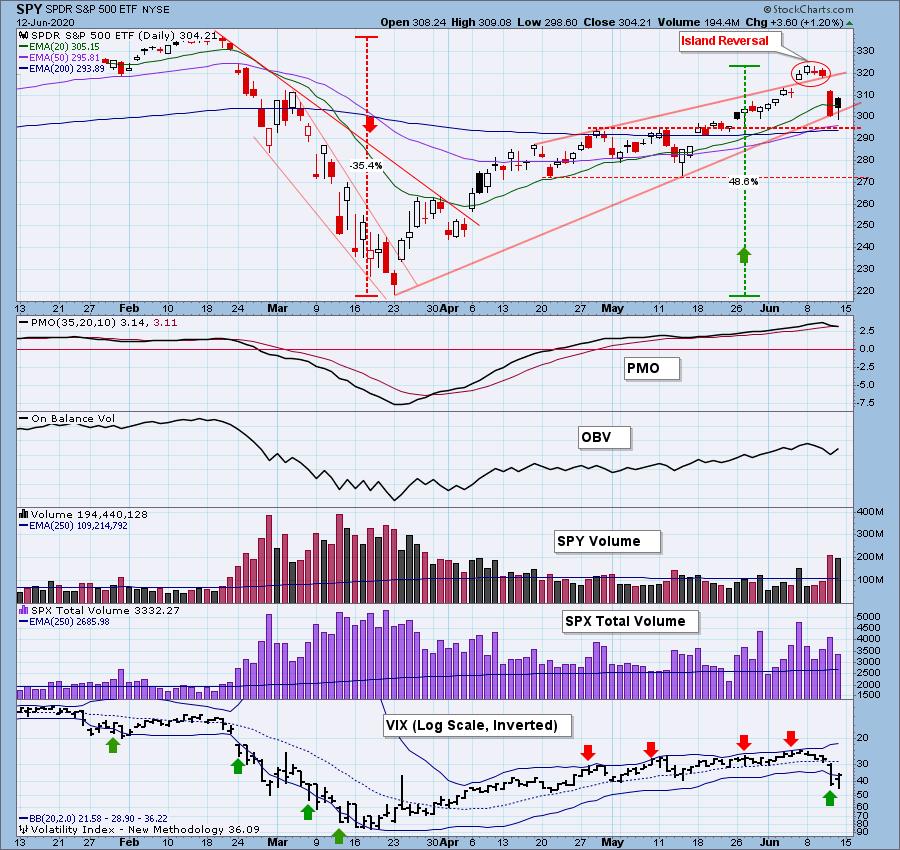
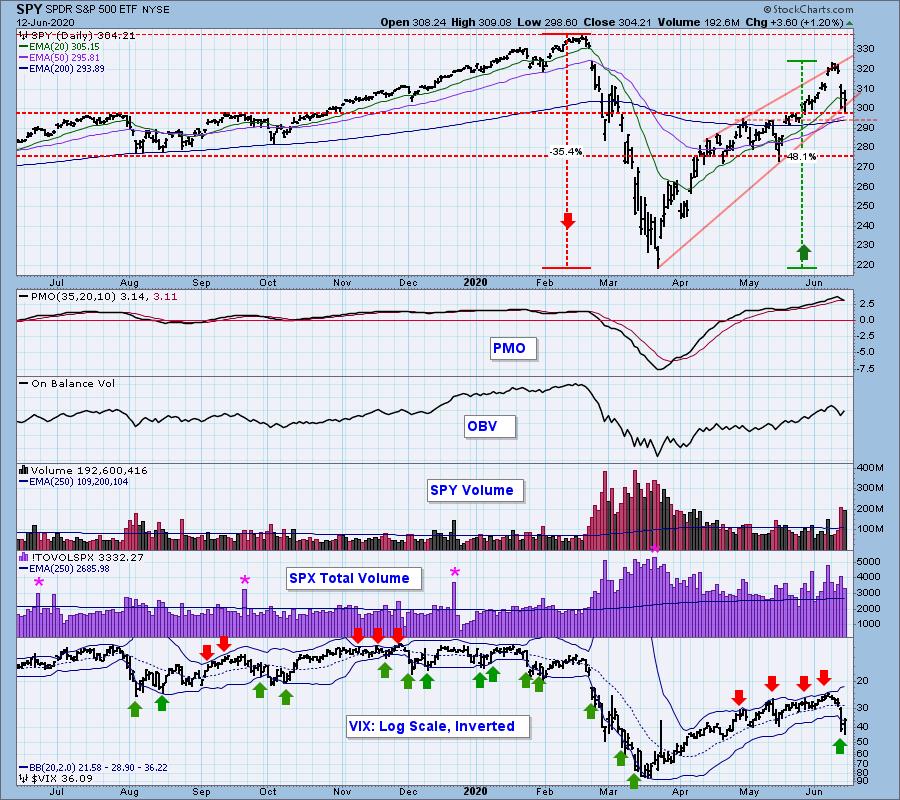
On our Wednesday StockCharts TV show, Erin and I agreed that an island was forming on the SPY chart, and the next day the market crashed -- notice the gap between the island and the prices that preceded and followed it. Today's rally was encouraging to the bulls, but put in the context of the breakdown, we can see that a lot of damage needs to be repaired.
The DecisionPoint Alert Weekly Wrap presents an end-of-week assessment of the trend and condition of the Stock Market, the U.S. Dollar, Gold, Crude Oil, and Bonds. The DecisionPoint Alert daily report (Monday through Thursday) is abbreviated and gives updates on the Weekly Wrap assessments.
Watch the latest episode of DecisionPoint on StockCharts TV's YouTube channel here!
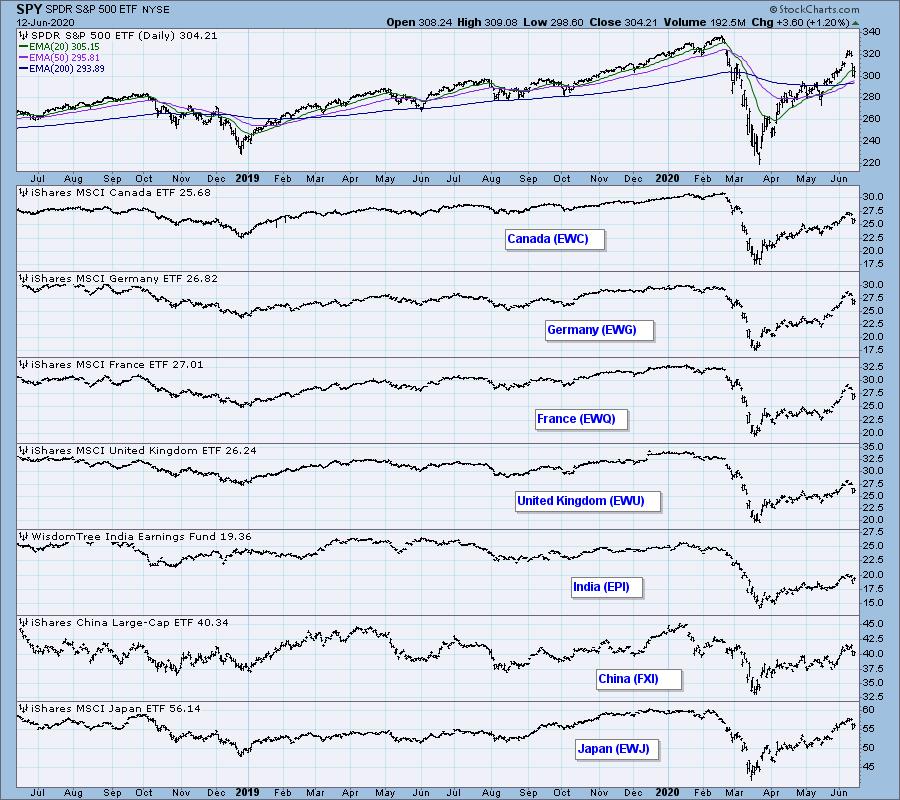
GLOBAL MARKETS
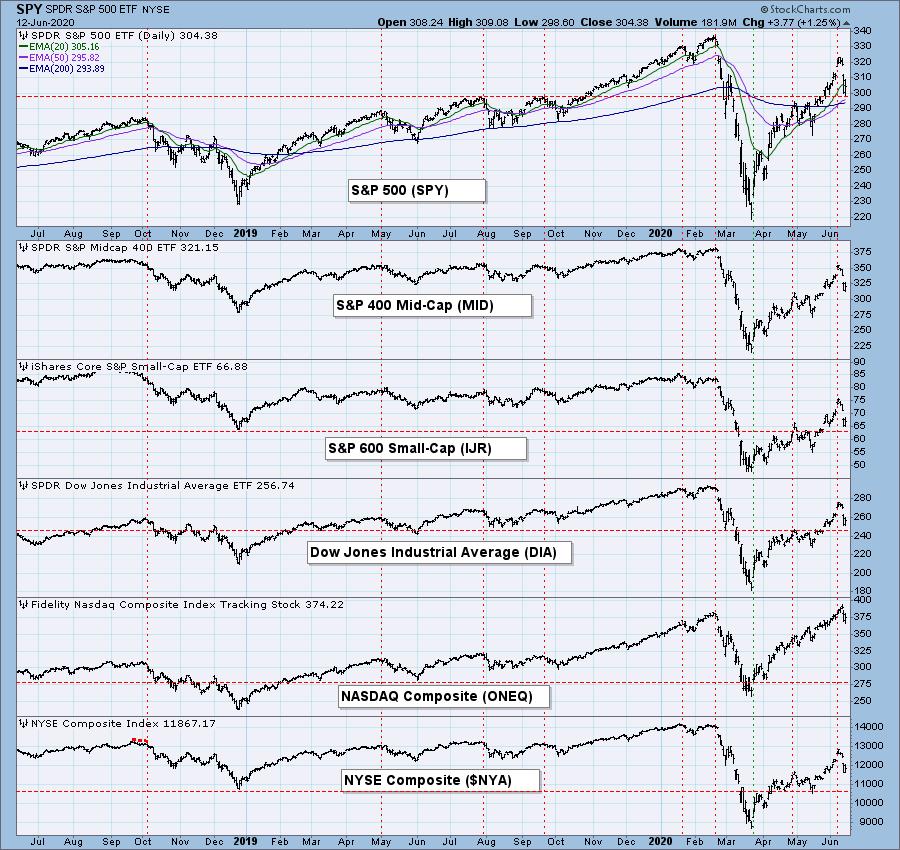
BROAD MARKET INDEXES
SECTORS
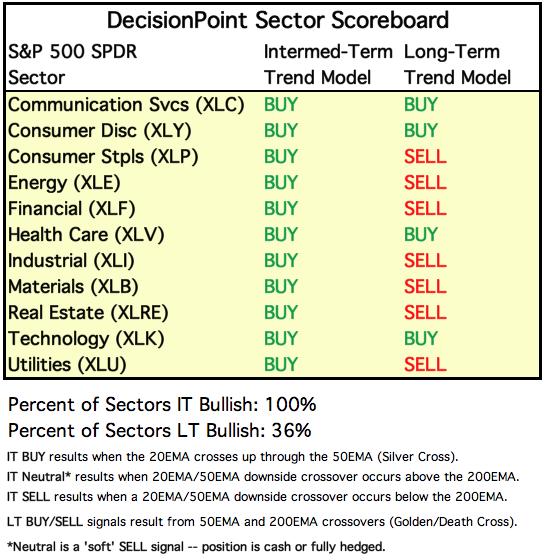
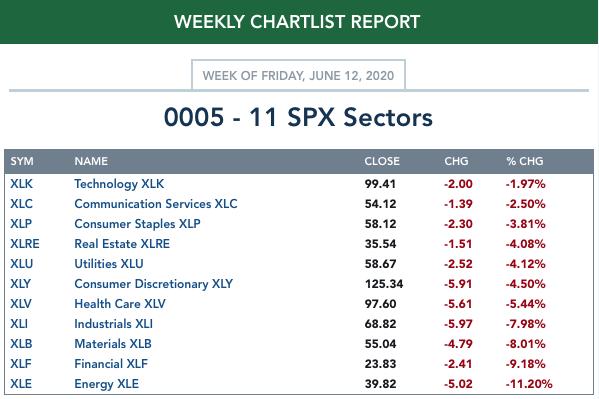
Each S&P 500 Index component stock is assigned to one, and only one, of 11 major sectors. This is a snapshot of the Intermediate-Term (Silver Cross) and Long-Term (Golden Cross) Trend Model signal status for those sectors.
ETF TRACKER: This is a list of about 100 ETFs intended to track a wide range of U.S. market indexes, sectors, global indexes, interest rates, currencies, and commodities. StockCharts.com subscribers can acquire it in the DecisionPoint Trend and Condition ChartPack.
Top 10 . . .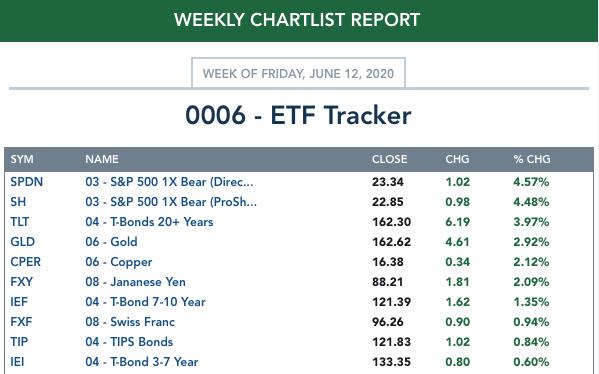
. . . and bottom 10: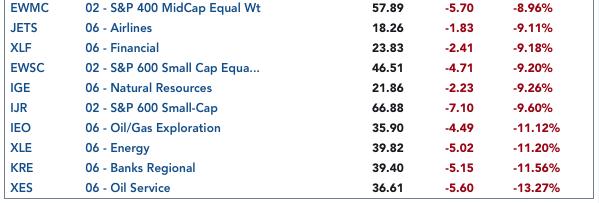
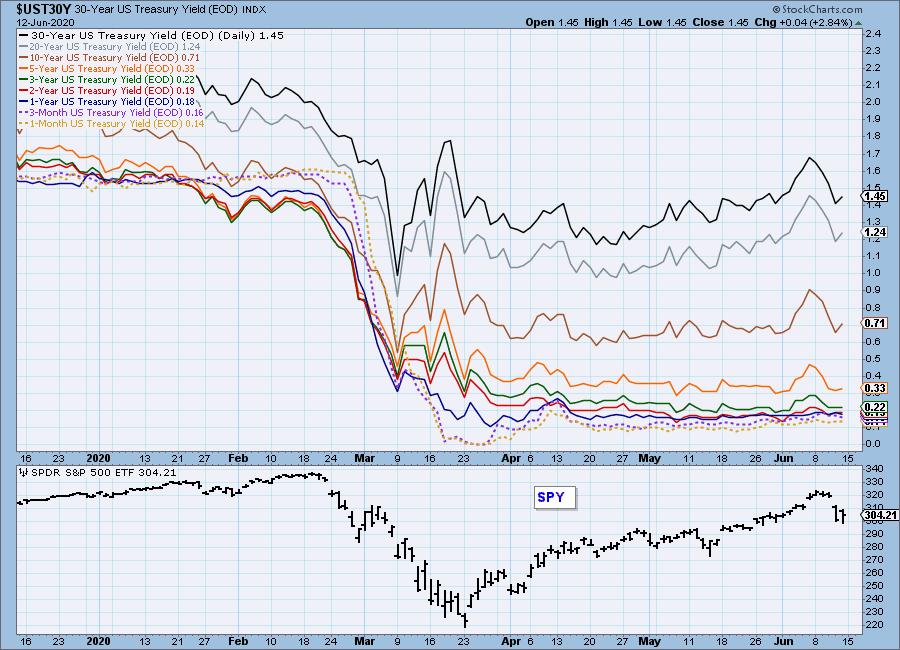
INTEREST RATES
This chart is included so we can monitor rate inversions. In normal circumstances the longer money is borrowed the higher the interest rate that must be paid. When rates are inverted, the reverse is true.
STOCKS
IT Trend Model: BUY as of 5/8/2020
LT Trend Model: BUY as of 6/8/2020
SPY Daily Chart: As we look at the one-year chart, we can see the support line upon which the market settled today. The daily PMO is very overbought and has topped, but it is still above the signal line, a smidge away from a crossover sell signal. Notice that SPX Total Volume contracted on today's rally. The rising trend line drawn from the March low forms the bottom of a bearish rising wedge.
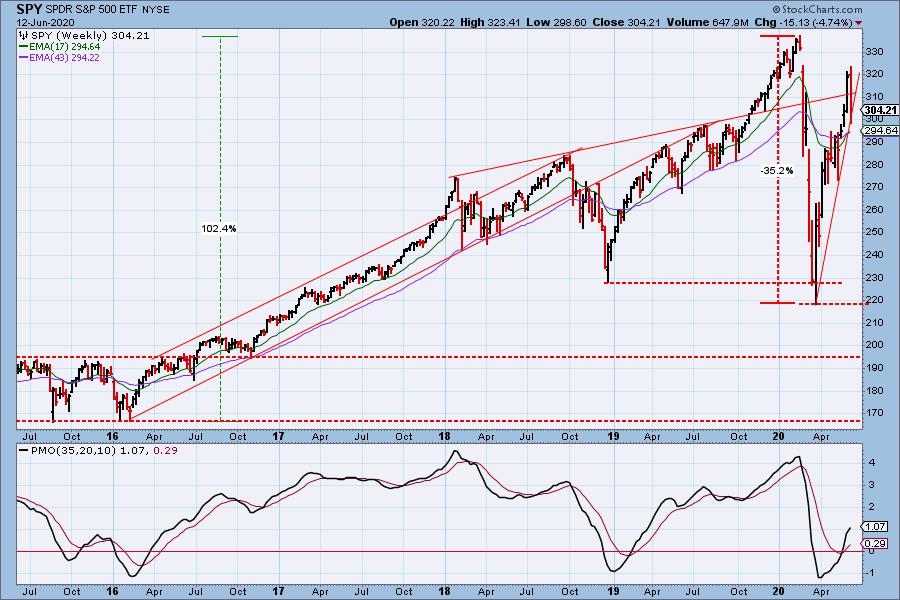
SPY Weekly Chart: The rally from the March low is extremely steep, and, like a parabolic, we should expect it to collapse.
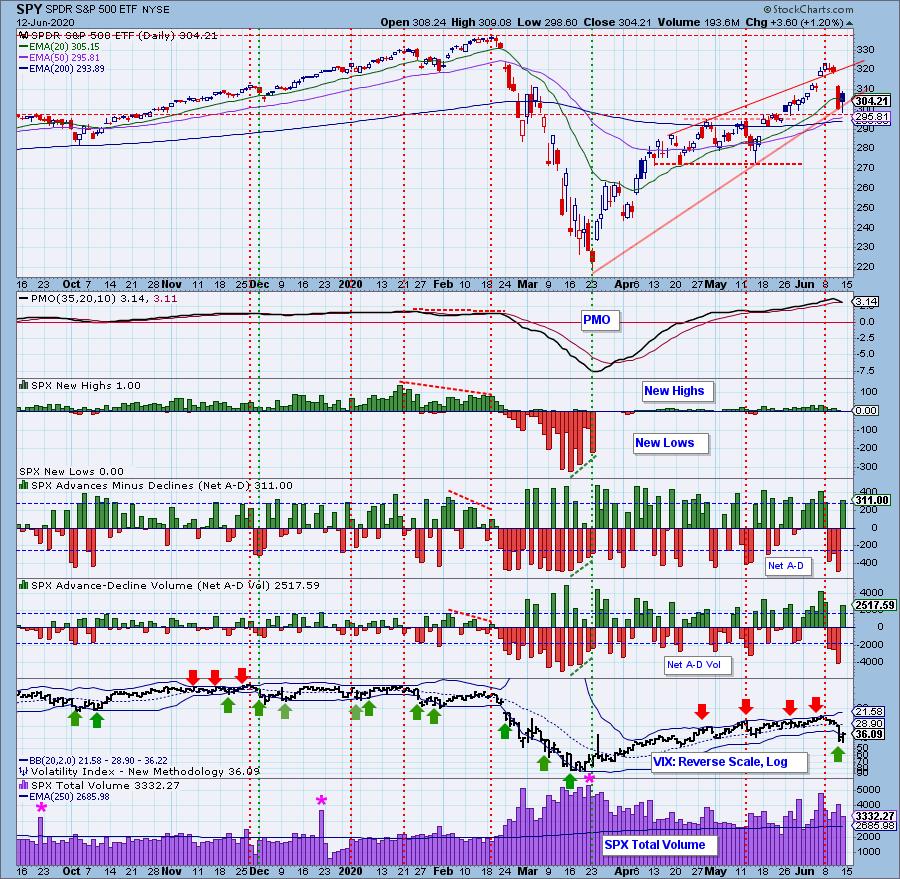
Climactic Market Indicators: We had three downside climax days this week, with Thursday's being a downside exhaustion climax. For now, I'm going to call today's climax an upside initiation, but we shall see.
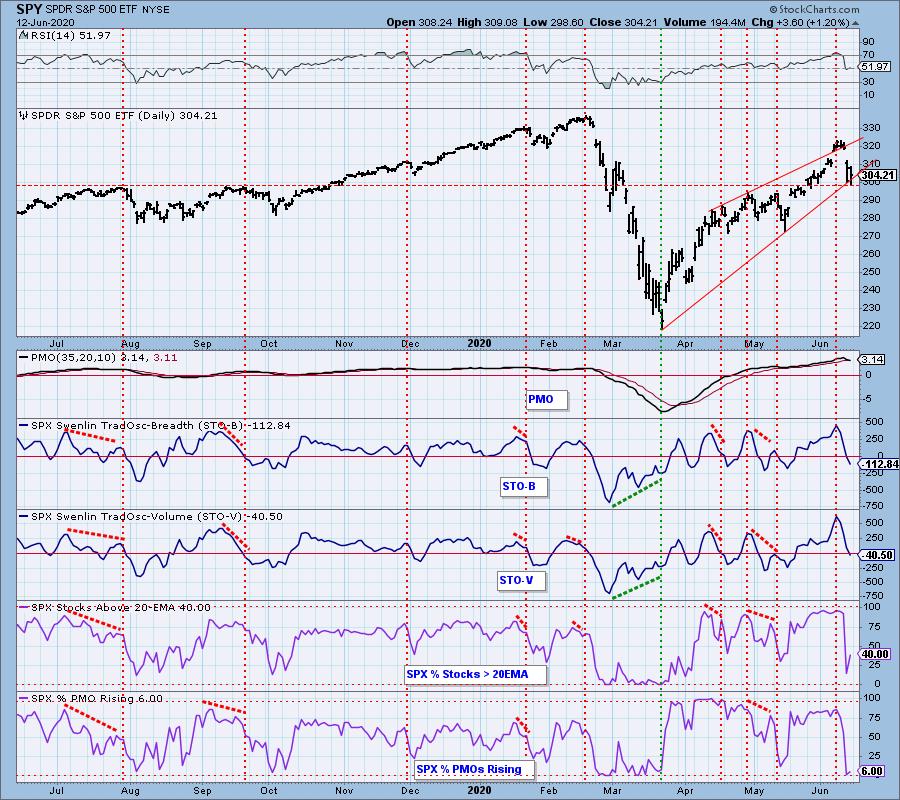
Short-Term Market Indicators: The short-term market trend is DOWN and the condition is OVERSOLD; however, the STO-B and STO-V can get a lot more oversold if price breaks down through the rising trend line.
Intermediate-Term Market Indicators: The Silver Cross and Bullish Percent Indexes are overbought. On Monday SPY got a Golden Cross (50EMA moved above the 200EMA) BUY Signal, but the Golden Cross Index shows that only 39% of S&P 500 component stocks have Golden Cross BUY Signals.
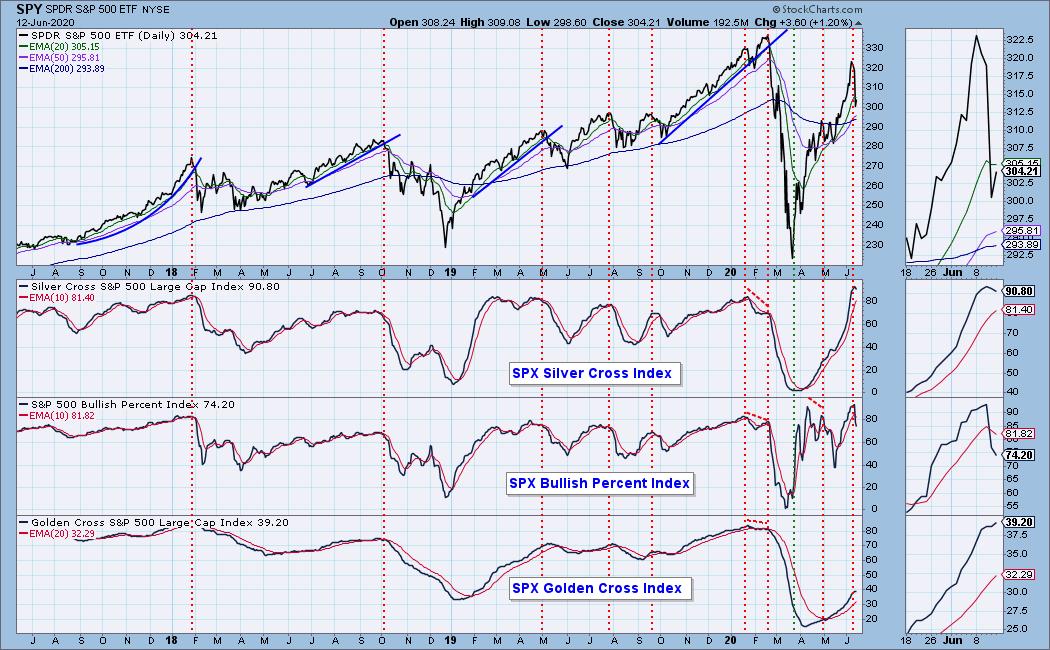
The intermediate-term market trend is UP and the condition is OVERBOUGHT. Only one negative divergence developed during the 12-week rally. This makes it difficult because we get little or no warning ahead of price tops. While it is comforting when indicators confirm market moves, it's going to be something of a surprise when breakdowns occur.
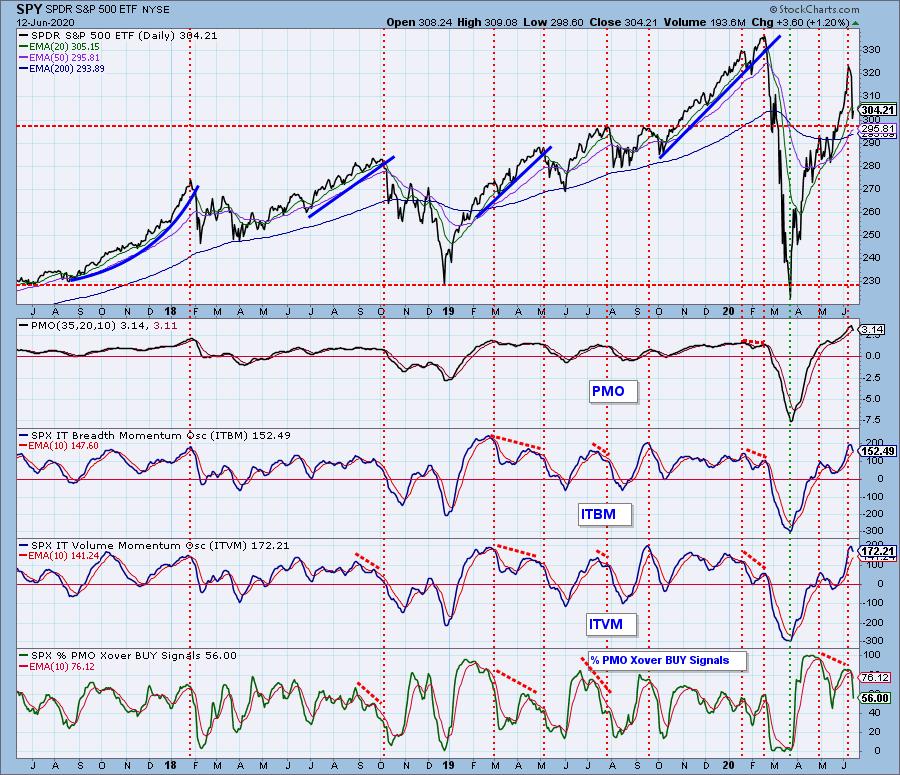
CONCLUSION: That was one killer breakdown on Thursday. We almost got some follow through on Friday, but horizontal support and the rising trend line stopped the decline. Short-term indicators allow for the bounce to continue, and next week we may see some more progress up toward this week's down gap; however, intermediate-term indicators are uniformly overbought, and this week's support is in danger of failing next week or soon thereafter.
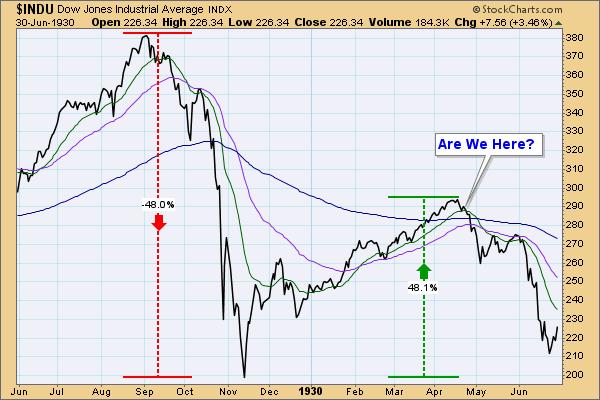
On Wednesday's DecisionPoint Show pointed out the similarities between this year's price action and the price action during the 1929 crash and the rally that followed. Whether or not we have just seen the top of the rally, I believe there will be a top soon and that it will look something like this.
Also on Wednesday's Show, I discussed the concept that investors are "looking across the valley" to the good times that await us there, seeming to believe that we will just levitate across the valley. But we can't levitate. We have to go down into the valley and confront the many difficulties that await us there. People haven't begun to imagine the storm we are walking into.
NOTE: Next week is quadruple witching options expiration. Expect very high volume on Friday, and probably low volatility toward the end of the week.
Have you subscribed the DecisionPoint Diamonds yet? DP does the work for you by providing handpicked stocks/ETFs from exclusive DP scans! Add it with a discount! Contact support@decisionpoint.com for more information!
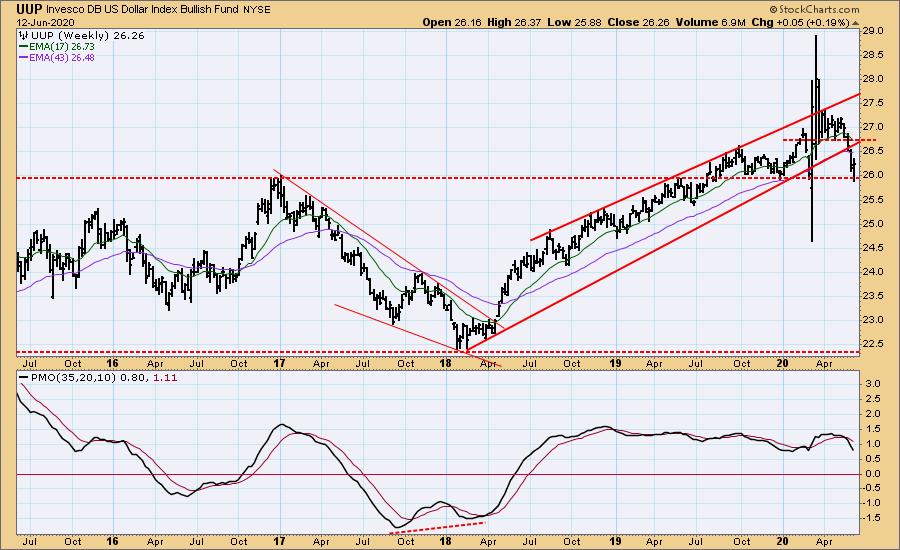
DOLLAR (UUP)
IT Trend Model: NEUTRAL as of 5/28/2020
LT Trend Model: BUY as of 5/25/2018
UUP Daily Chart: The dollar bottomed on an obvious support level.
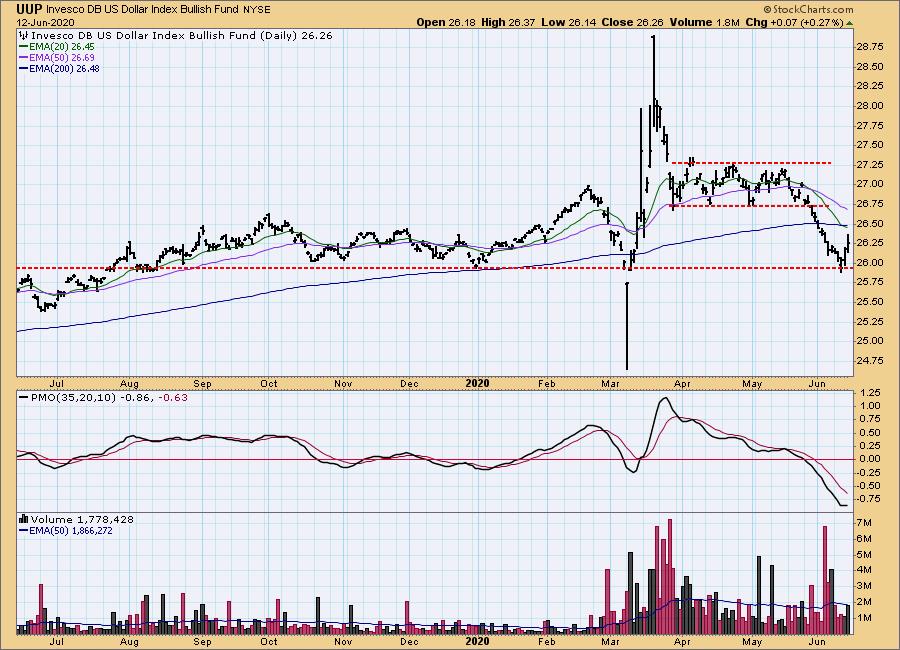
UUP Weekly Chart: The support line looks even more compelling in this time frame.
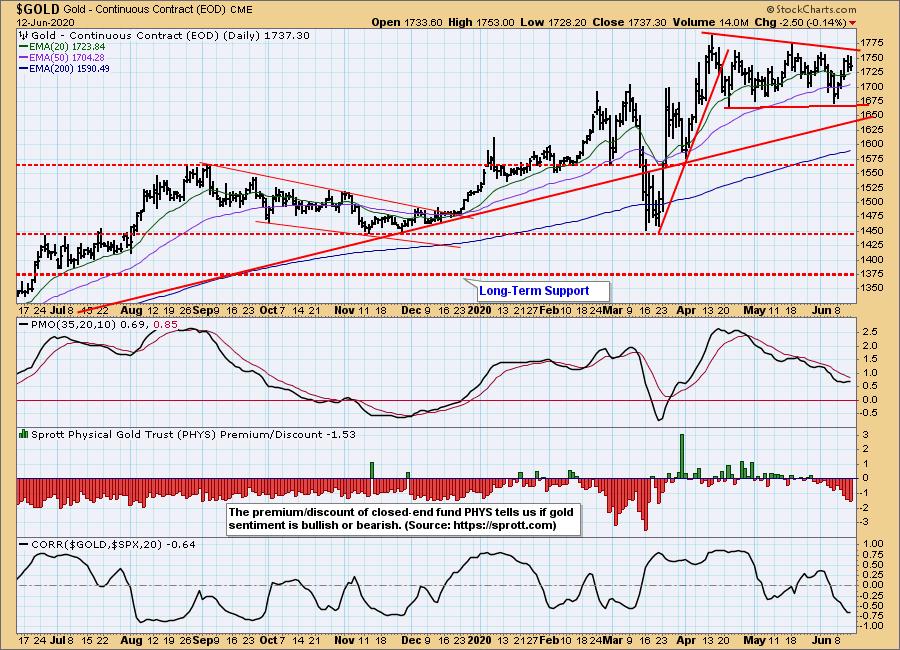
GOLD
IT Trend Model: BUY as of 3/24/2020
LT Trend Model: BUY as of 1/8/2019
GOLD Daily Chart: The bullish flag formation is still viable, if not a little top heavy, and the daily PMO is trying to bottom.
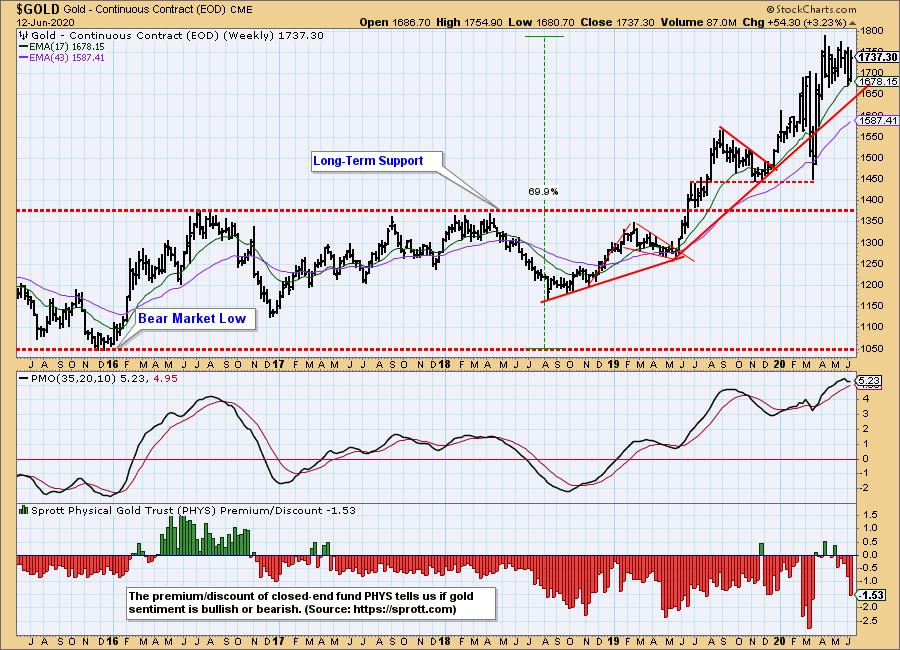
GOLD Weekly Chart: The rising trend line was drawn by ignoring the March down spike. The weekly PMO, while overbought, is turning up again, so gold still looks bullish in this time frame.
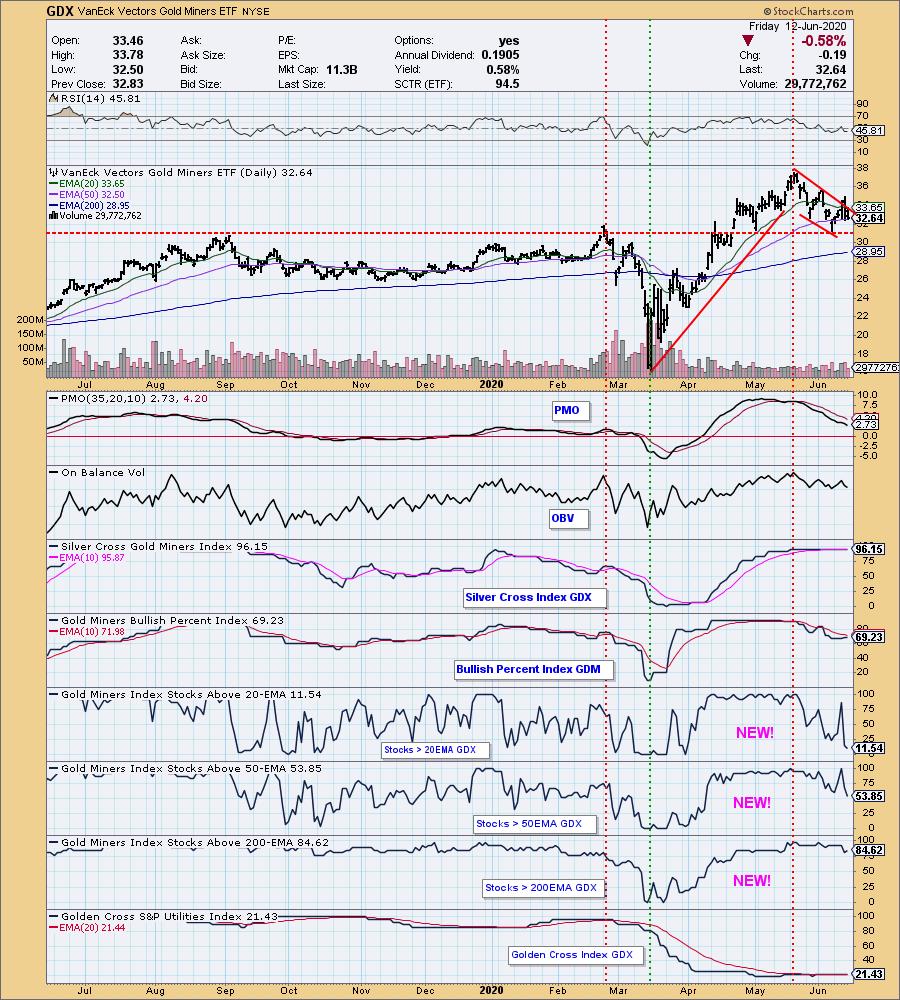
GOLD MINERS Index: GDX has formed a bullish flag formation. A breakout attempt failed this week, but I have to believe that an upside resolution is still likely. We have added three new indicators: Percent of Stocks Above Their 20EMA, 50EMA, and 200EMA. Each reflects the amount of bullishness/bearishness in their respective time frames. It is of note that, while a large percentage of GDX stocks are above their 200EMA, the Golden Cross Index (stocks with the 50EMA above the 200EMA) is still at one-year lows.
CRUDE OIL ($WTIC)
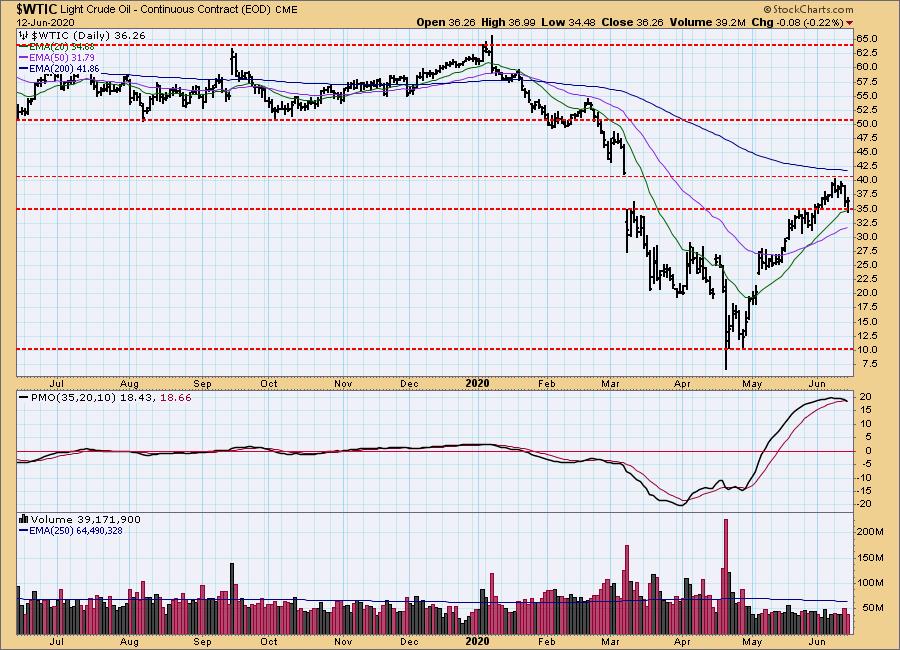
Until further notice we will use $WTIC to track the oil market. Since this is a continuous contract dataset, it doesn't "play well" with our Trend Models, and we will not report Trend Model signals for oil.
$WTIC Daily Chart: Crude filled the gap between 35 and 40 this week, and the PMO top implies that it will probably head lower. My guess, and it is a guess, is that a reasonable range for it to settle in is around 27.50 to 35.00.
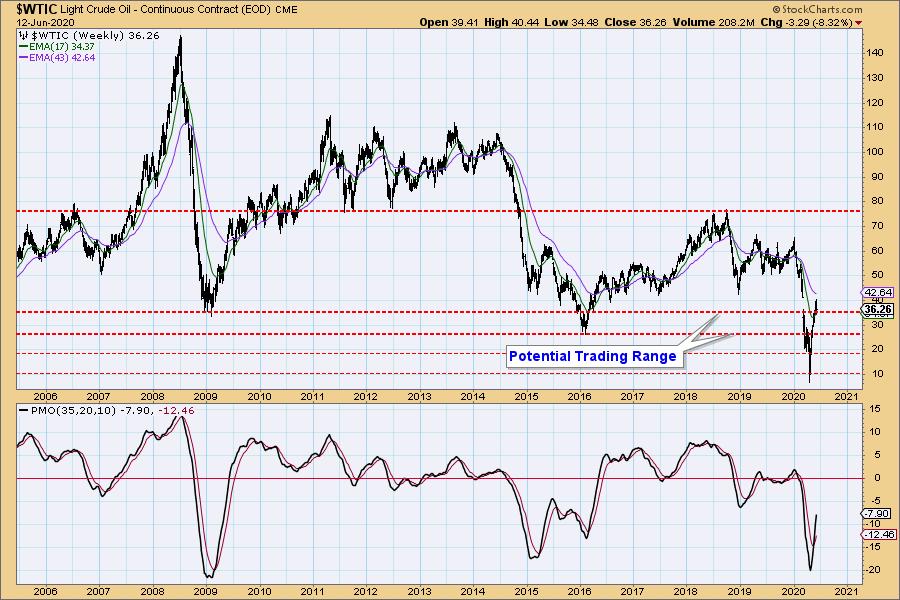
$WTIC Weekly Chart: Below you can see the basis of my trading range target, although it it is currently above the top of that range.
BONDS (TLT)
IT Trend Model: BUY as of 1/22/2020
LT Trend Model: BUY as of 1/2/2019
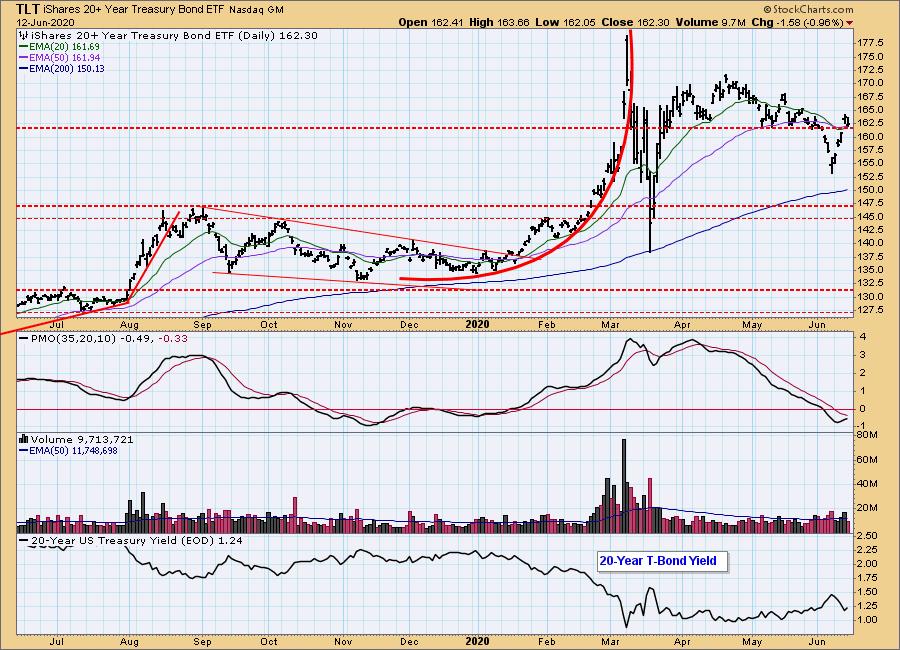
TLT Daily Chart: Bonds rallied as stocks stalled last week, but Thursday's crash got bonds back above a two-month support level.
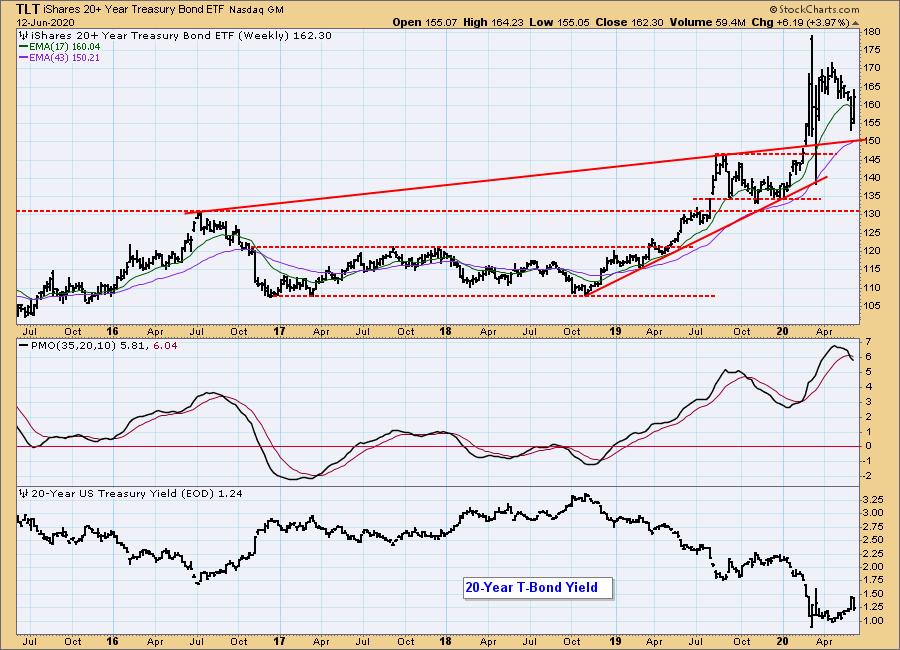
TLT Weekly Chart: The weekly PMO has topped and crossed down through the signal line, but, fo now, I think the likely outcome will be a trading range between, say, 155 to 170.
Technical Analysis is a windsock, not a crystal ball.
NOTE: The signal status reported herein is based upon mechanical trading model signals, specifically, the DecisionPoint Trend Model. They define the implied bias of the price index based upon moving average relationships, but they do not necessarily call for a specific action. They are information flags that should prompt chart review. Further, they do not call for continuous buying or selling during the life of the signal. For example, a BUY signal will probably (but not necessarily) return the best results if action is taken soon after the signal is generated. Additional opportunities for buying may be found as price zigzags higher, but the trader must look for optimum entry points. Conversely, exit points to preserve gains (or minimize losses) may be evident before the model mechanically closes the signal.
Helpful DecisionPoint Links:
DecisionPoint Alert Chart List
DecisionPoint Golden Cross/Silver Cross Index Chart List
DecisionPoint Sector Chart List
Price Momentum Oscillator (PMO)
Swenlin Trading Oscillators (STO-B and STO-V)