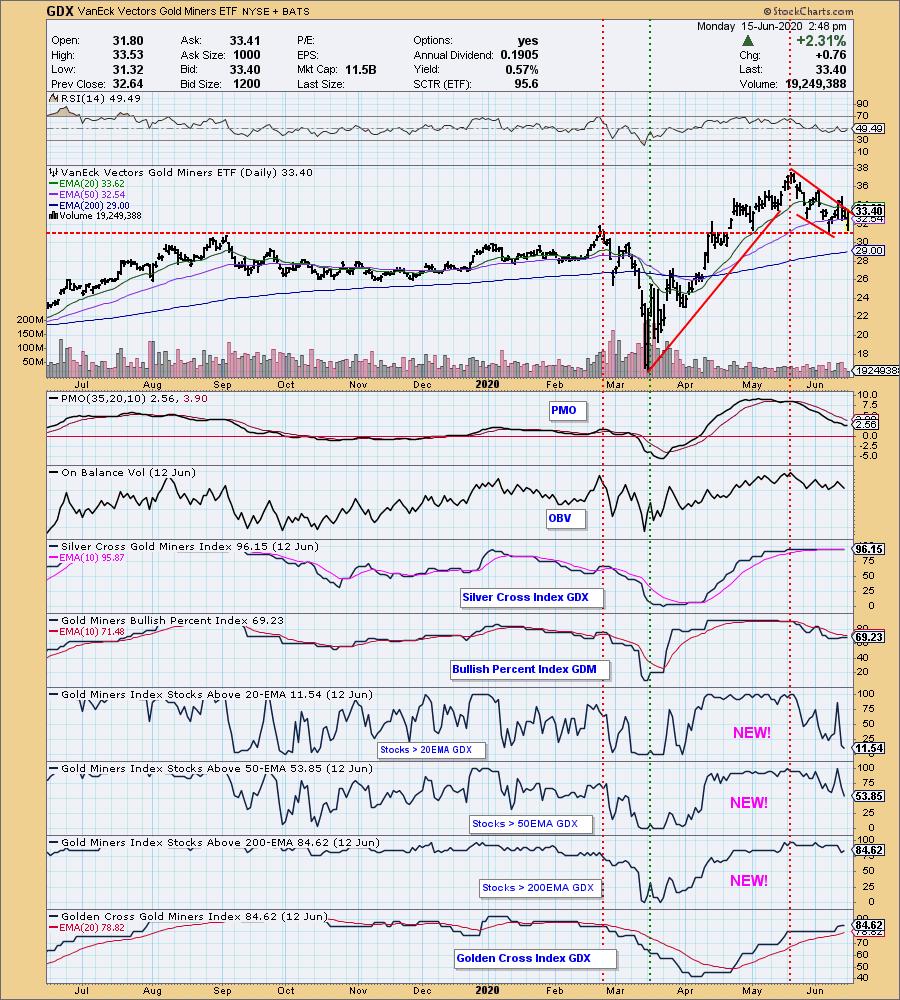
(Editor's Note: This is an expanded version of an item in last Friday's DP ALERT WEEKLY WRAP.)
Last week we added some indicators to the Gold Miners Index (GDX) chart. First, Erin really likes the RSI, so she encouraged me to put that on the daily charts, GDX included. Next, the Percent Stocks Above Their 20EMA, 50EMA, and 200EMA indicators are some of my faves, and StockCharts.com is now calculating the GDX version of them for us. What do these indicators tell us? When price is above a particular EMA (Exponential Moving Average), we can consider it to be positive in that time frame. Pretty simple.


As investors we want to accomplish two basic things: (1) Determine the trend and condition of the market, and (2) select stocks that will ride that tide. The DecisionPoint Alert helps with the first step, and DecisionPoint Diamonds helps with the second. Go to DecisionPoint.com and SUBSCRIBE TODAY!
We hope you find our more robust set of indicators for the Gold Miners Index to be helpful.
Happy Charting! - Carl
Technical Analysis is a windsock, not a crystal ball.
Helpful DecisionPoint Links:
DecisionPoint Alert Chart List
DecisionPoint Golden Cross/Silver Cross Index Chart List
DecisionPoint Sector Chart List
Price Momentum Oscillator (PMO)
Swenlin Trading Oscillators (STO-B and STO-V)