
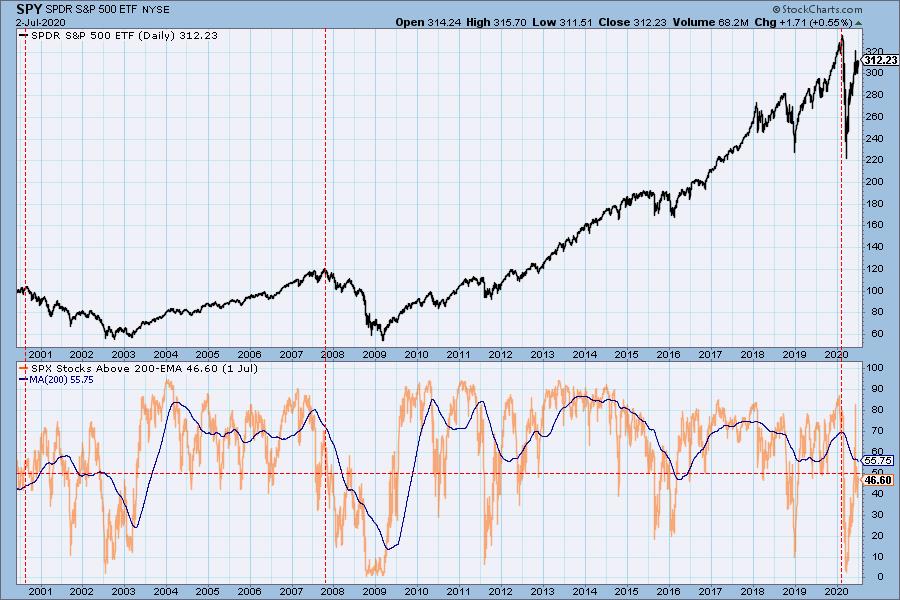
I mentioned to Erin on our StockCharts TV show this week that I thought that the market participation was narrowing somewhat like it did in 2000. As I recall, as the market hit an all-time high that year, one of the models I was following showed only 50% of S&P 500 stocks on BUY signals. This was because focus had narrowed to the largest of the large-cap stocks. That particular model has been lost in the march of progress, but we have another indicator that we can use to see if there is a similar narrowing of participation today. The Index of Stocks Above 200EMA has a reading of 47%, which is close to what it was at the 2000 top; however, the 200-day moving average of the the index is about 10 points higher than it was in 2000, thanks to the sharp advance to the top in 2019. To be fair, I'm not making a direct top to top comparison, but the current rally is not far from the all-time high, and there should be a much higher percentage of stocks above their 200EMA, so my sense that participation has narrowed is legit, just not 2000-ish yet.
The DecisionPoint Alert Weekly Wrap presents an end-of-week assessment of the trend and condition of the Stock Market, the U.S. Dollar, Gold, Crude Oil, and Bonds. The DecisionPoint Alert daily report (Monday through Thursday) is abbreviated and gives updates on the Weekly Wrap assessments.
Watch the latest episode of DecisionPoint on StockCharts TV's YouTube channel here!
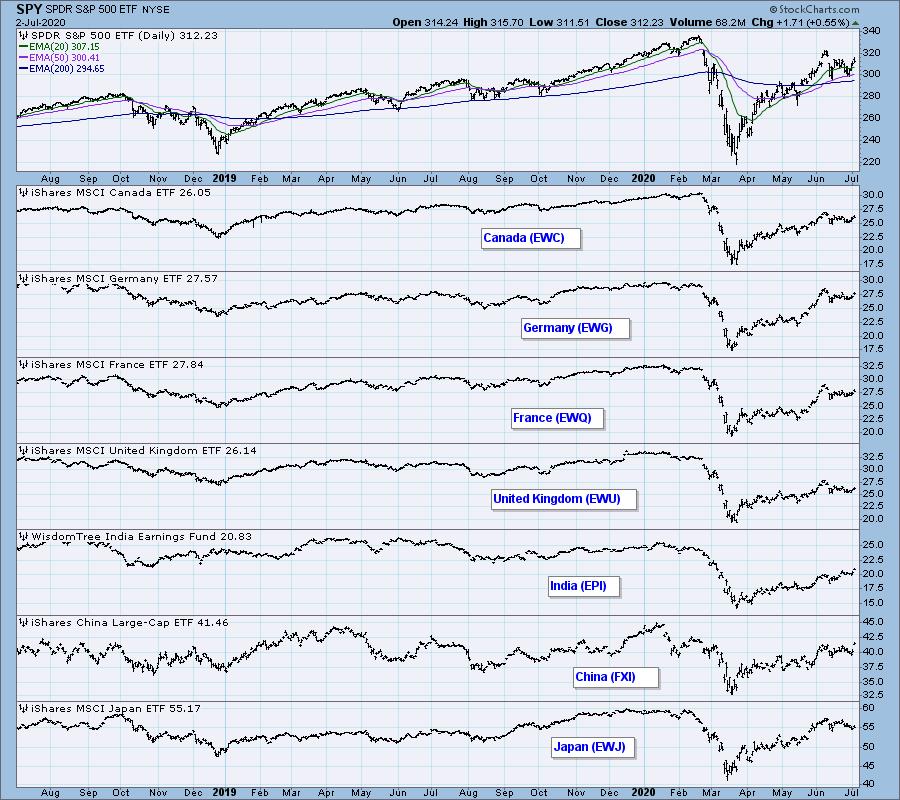
GLOBAL MARKETS
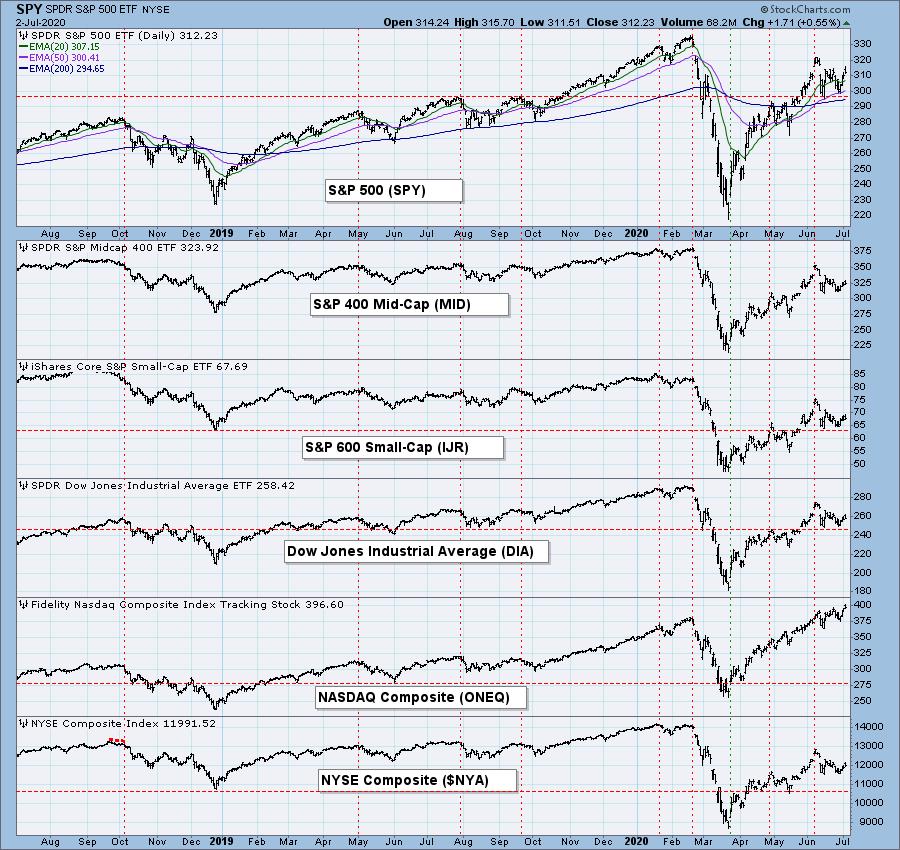
BROAD MARKET INDEXES
SECTORS
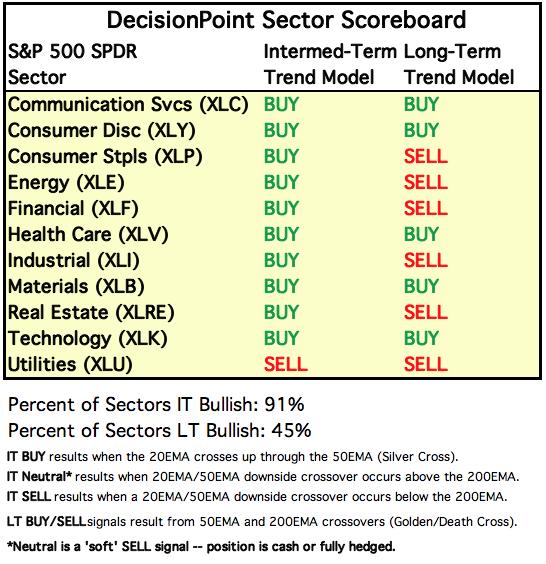
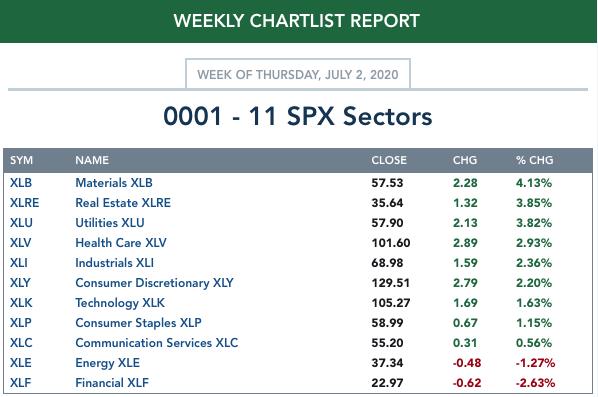
Each S&P 500 Index component stock is assigned to one, and only one, of 11 major sectors. This is a snapshot of the Intermediate-Term (Silver Cross) and Long-Term (Golden Cross) Trend Model signal status for those sectors.
ETF TRACKER: This is a list of about 100 ETFs intended to track a wide range of U.S. market indexes, sectors, global indexes, interest rates, currencies, and commodities. StockCharts.com subscribers can acquire it in the DecisionPoint Trend and Condition ChartPack.
Top 10 . . .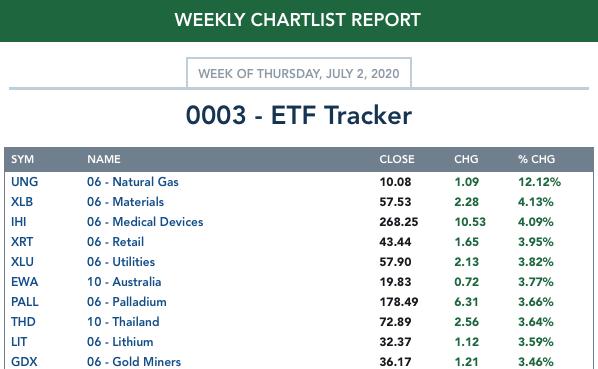
. . . and bottom 10: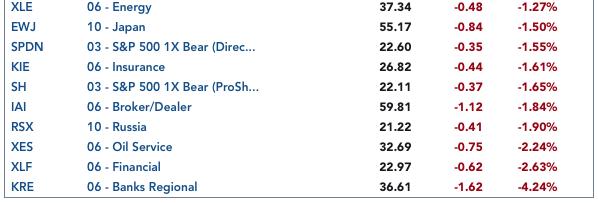
INTEREST RATES
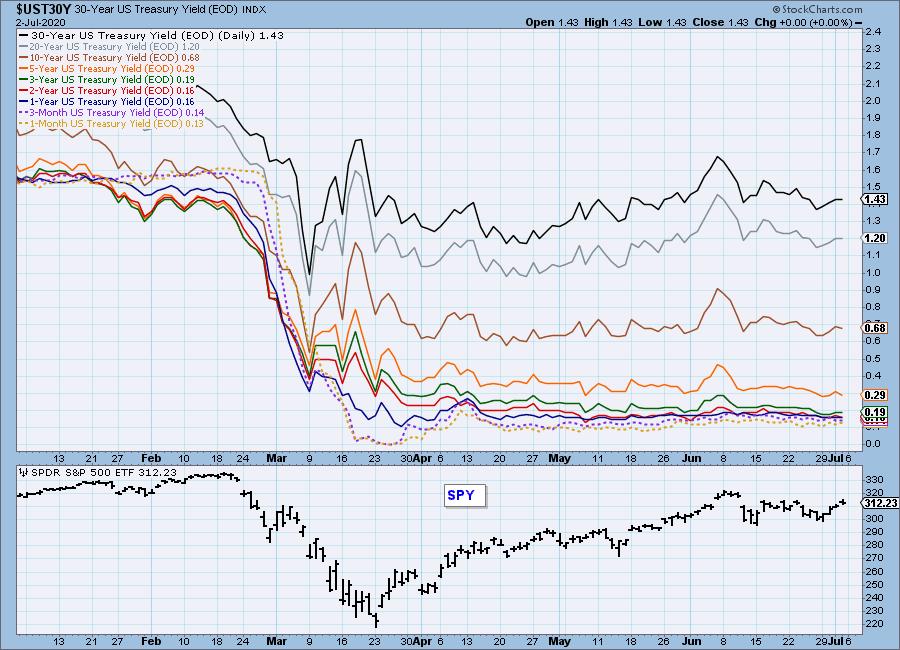
This chart is included so we can monitor rate inversions. In normal circumstances the longer money is borrowed the higher the interest rate that must be paid. When rates are inverted, the reverse is true.
STOCKS
IT Trend Model: BUY as of 5/8/2020
LT Trend Model: BUY as of 6/8/2020
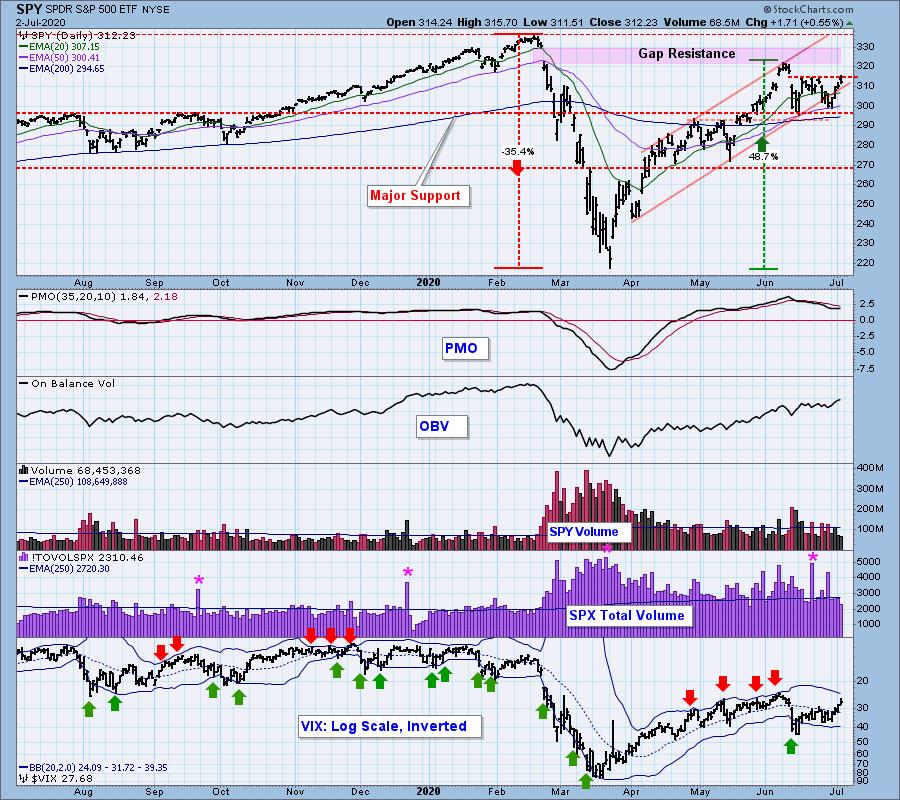
SPY Daily Chart: Price was stopped at overhead resistance for the fourth time in three weeks. Pre-holiday volume contracted, but I don't think we should read anything into that.
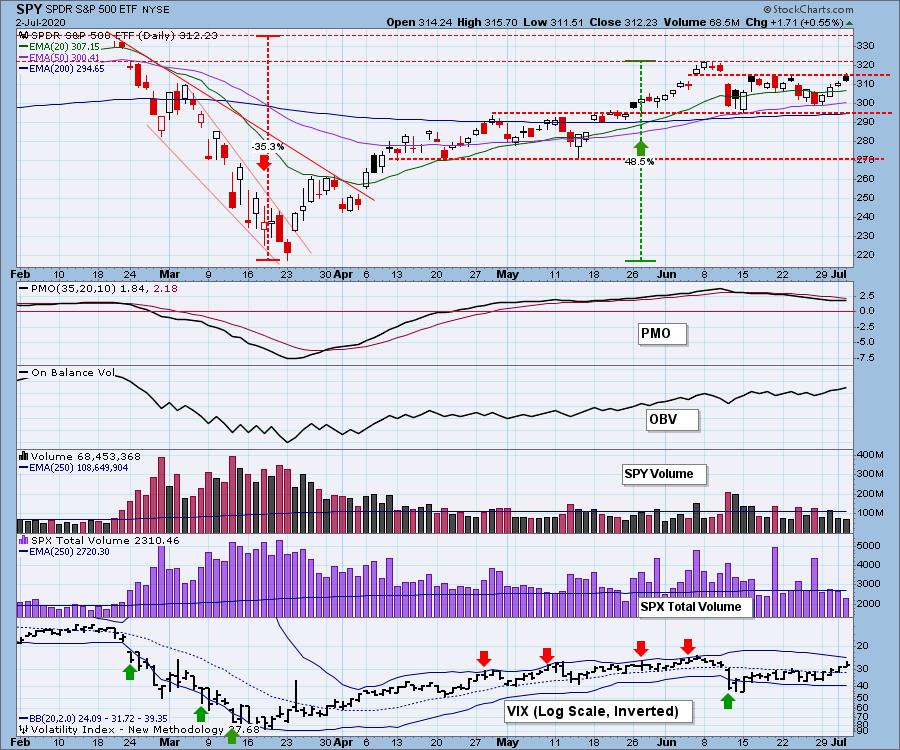
The VIX is getting close to the upper Bollinger Band -- overbought.
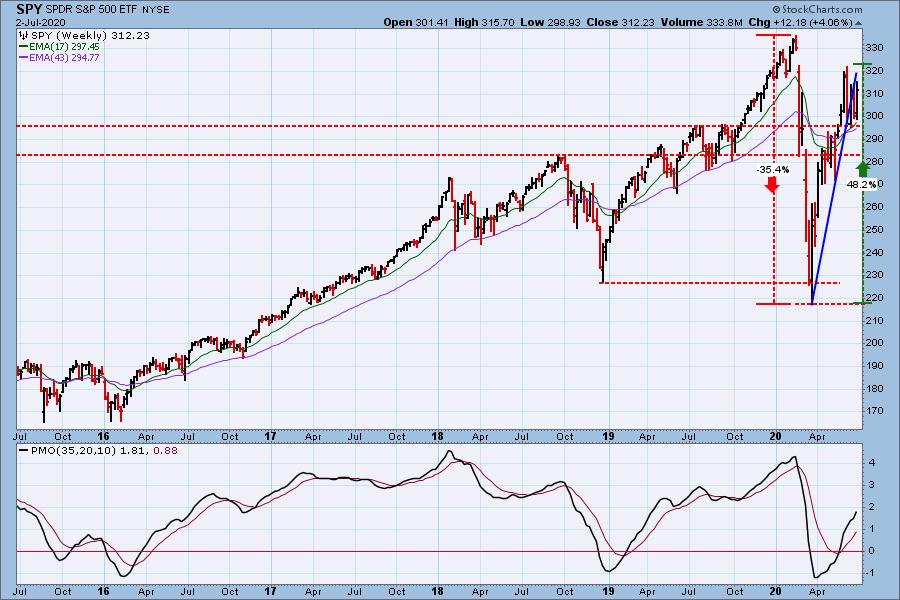
SPY Weekly Chart: The trading range is beginning to show in this time frame. The weekly PMO is far from overbought.
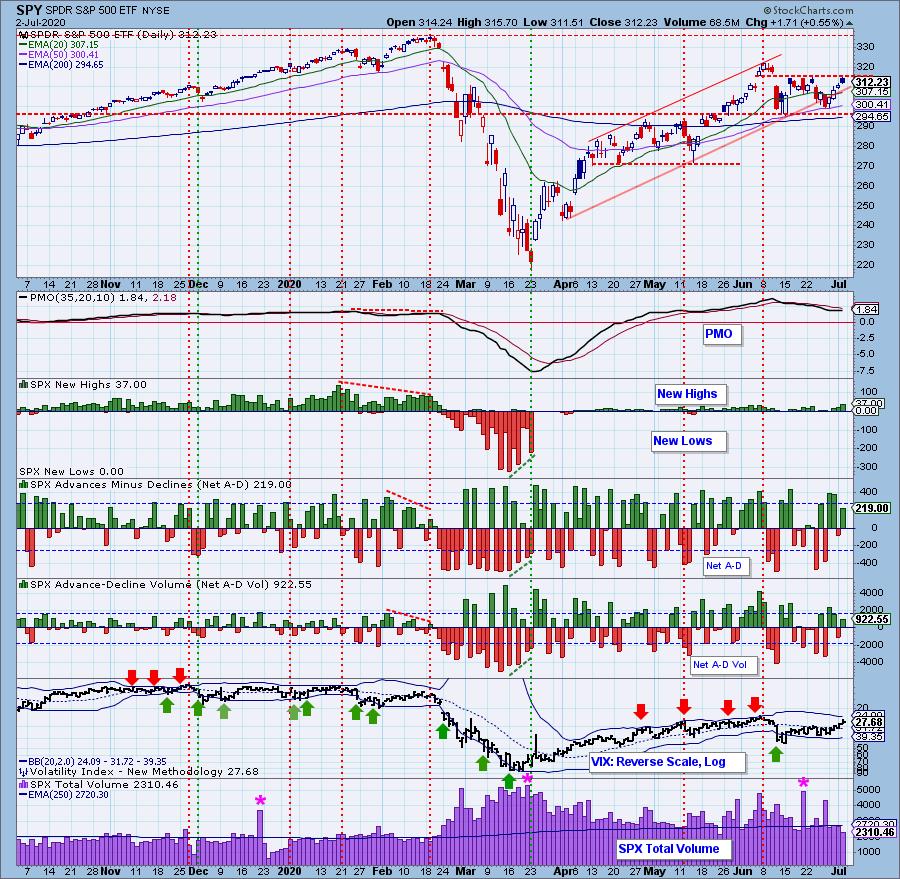
Climactic Market Indicators: There was upside climactic action on Monday and Tuesday, but the trading range for price was maintained.
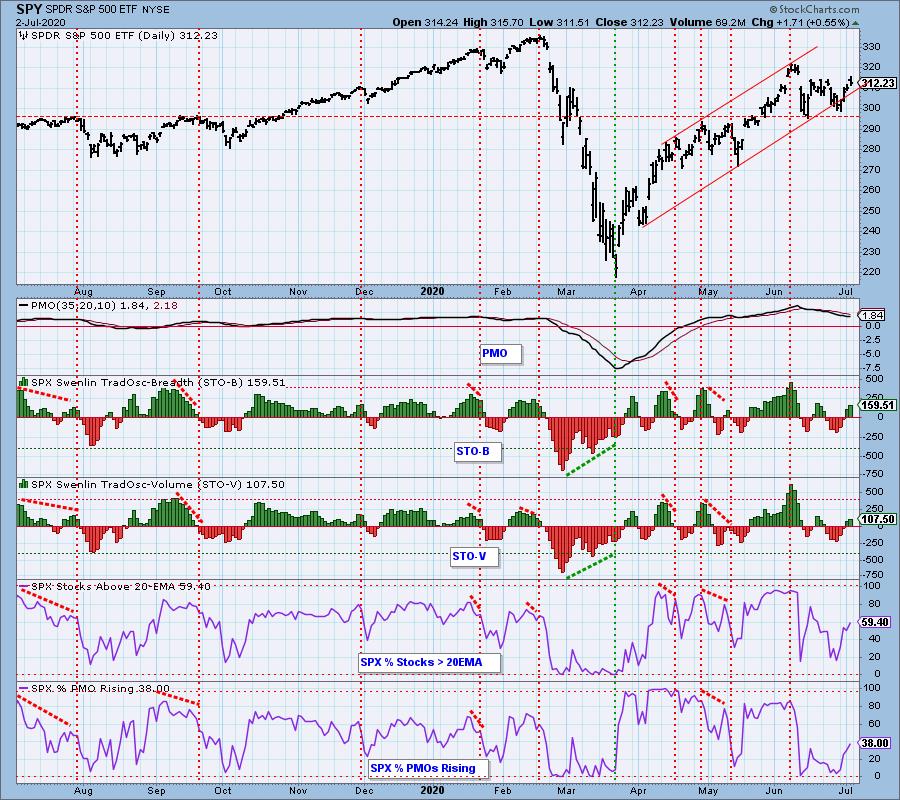
Short-Term Market Indicators: The short-term market trend is NEUTRAL and the condition is NEUTRAL. For the last two weeks the STOs have straddled the zero line in a narrow range, so the bias is neutral for now.
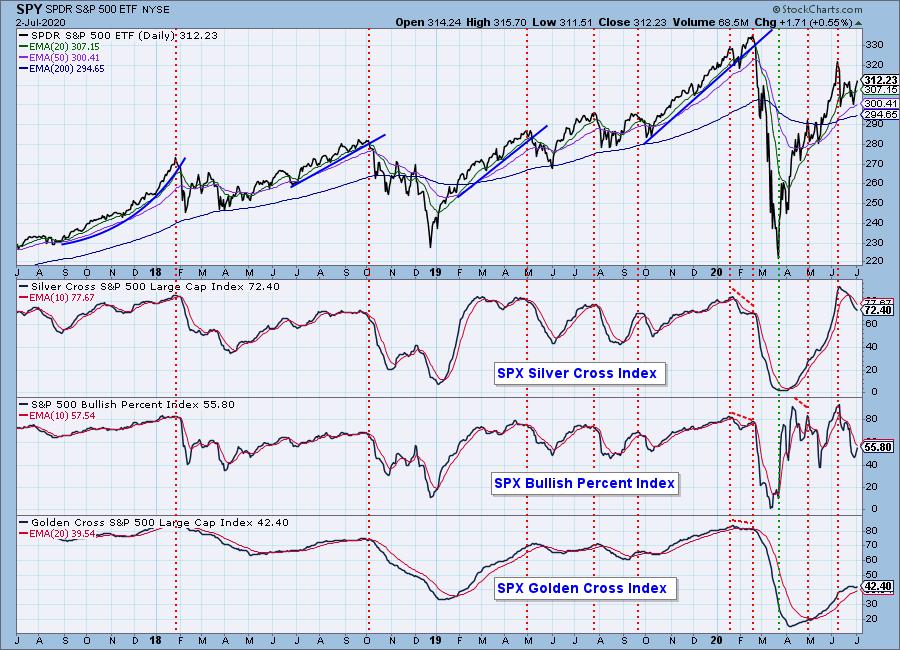
Intermediate-Term Market Indicators: The Silver Cross and Golden Cross Indexes have topped, which is bearish.
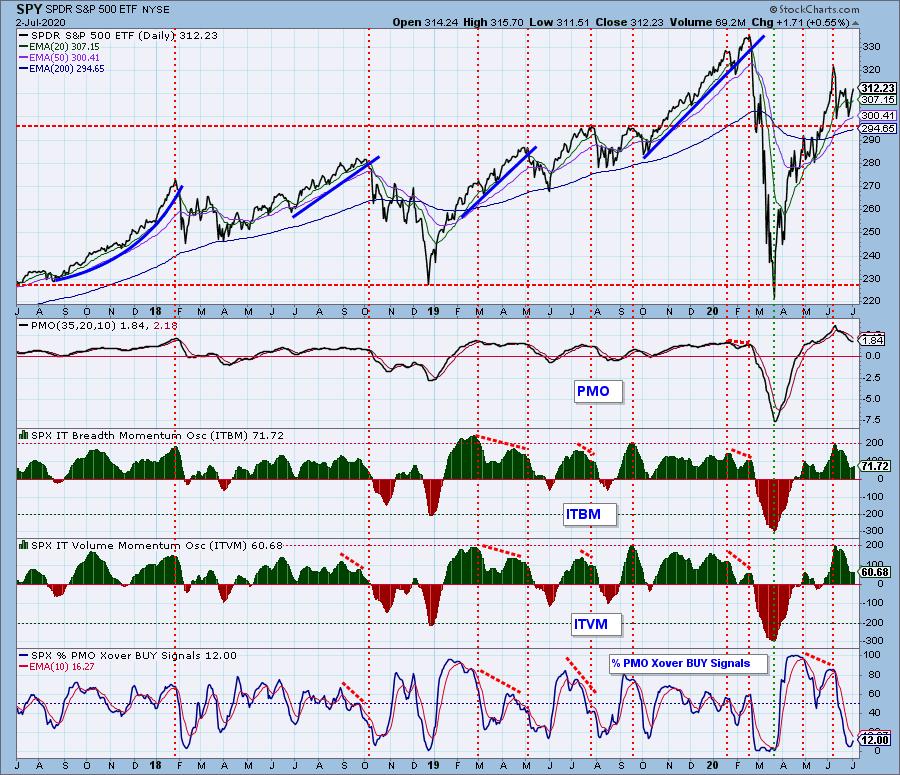
The intermediate-term market trend is UP and the condition based upon the ITBM and ITVM is modestly OVERBOUGHT. The market bias is BULLISH.
FUNDAMENTALS: With a P/E of 27, the market is extremely OVERVALUED, and I believe we are in another Fed-induced bubble. The irrationality of it reminds me of the dot.com bubble in 2000, one of the reasons I looked at participation in the opening paragraph of this commentary. Stimulus money "needs to go somewhere," so prices are being bid higher in spite of a dismal outlook for earnings in the next three quarters. Last week, the Evergreen Gavekal blog led with the title "No Revenue, No Profits, No Problem?," which pretty well defines the current situation. It is always nice to have a fundamental rationale to accompany a technical decision, but, sorry, there is no help of that kind at present. People are in a single-entry bookkeeping mode -- they are enjoying the effects of the stimulus, but they haven't mentally booked the liability.
CONCLUSION: From a technical point of view, the advance from the March low is as steep as the tail end of a parabolic advance, so I think parabolic rules should apply. By that I mean we should be prepared to exit at an appropriate time after price peaks, but it is hard to pick a top for a parabolic. When price peaked in early-June, I thought the top might have arrived, but price has merely consolidated for the last three weeks. That implies that we may see another leg up. We shall see.
Have you subscribed the DecisionPoint Diamonds yet? DP does the work for you by providing handpicked stocks/ETFs from exclusive DP scans! Add it with a discount! Contact support@decisionpoint.com for more information!
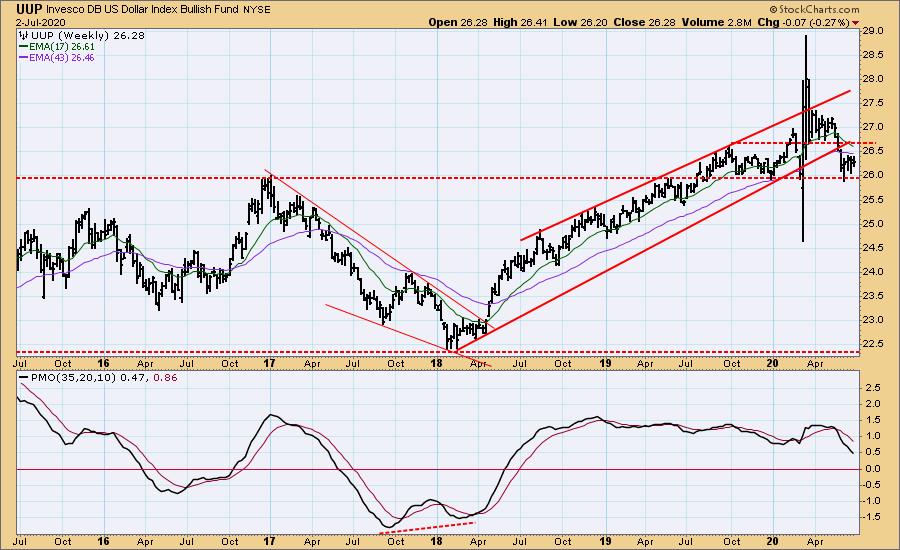
DOLLAR (UUP)
IT Trend Model: NEUTRAL as of 5/28/2020
LT Trend Model: BUY as of 5/25/2018
UUP Daily Chart: UUP has settled back into the range it held before the crash.
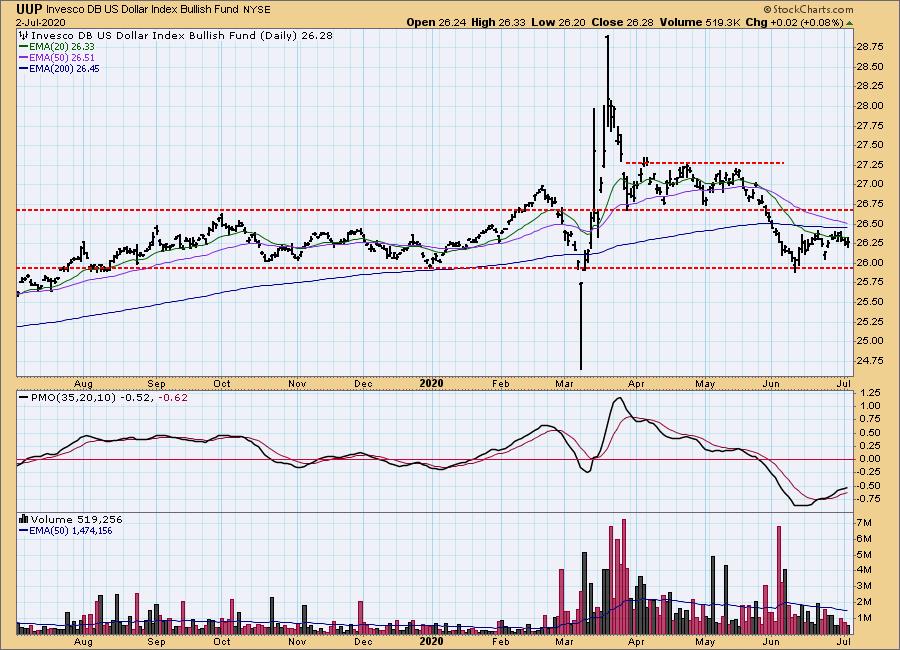
UUP Weekly Chart: The support line around 26 seems to be the dominant feature at this point.
GOLD
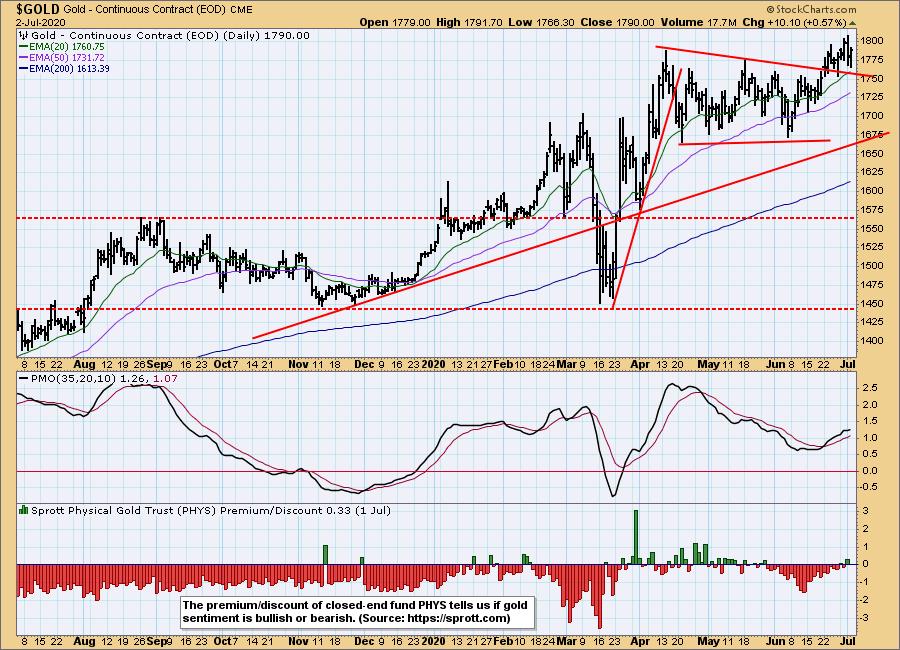
IT Trend Model: BUY as of 3/24/2020
LT Trend Model: BUY as of 1/8/2019
GOLD Daily Chart: A totally bullish chart with gold making new highs. The daily PMO has bottomed above the zero line and has plenty of room to the upside. I have chosen to ignore the March down spike, considering it an outlier.
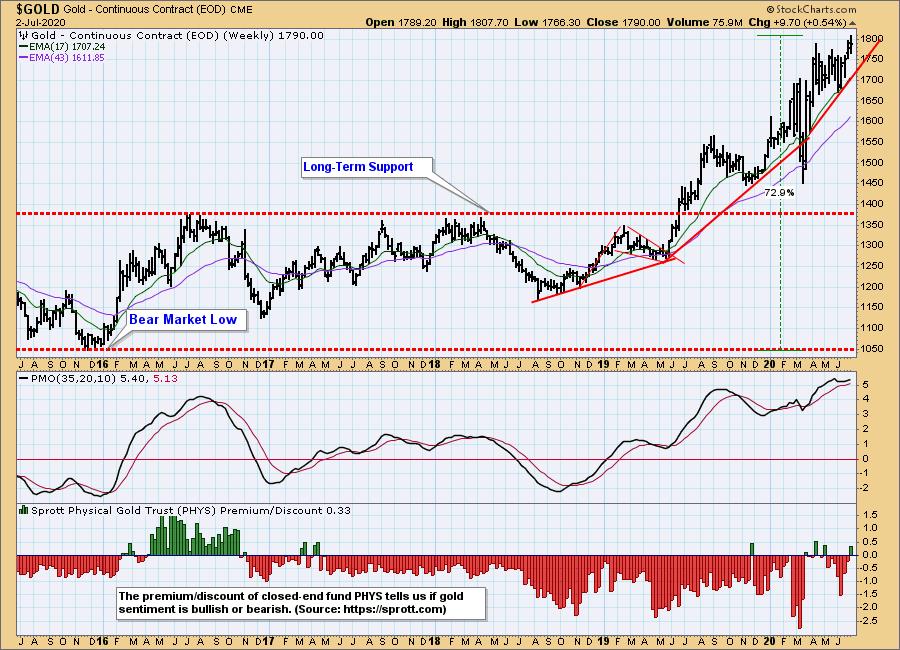
GOLD Weekly Chart: Gold is also bullish in this time frame. The weekly PMO is overbought, but it could become more so if the rally continues.
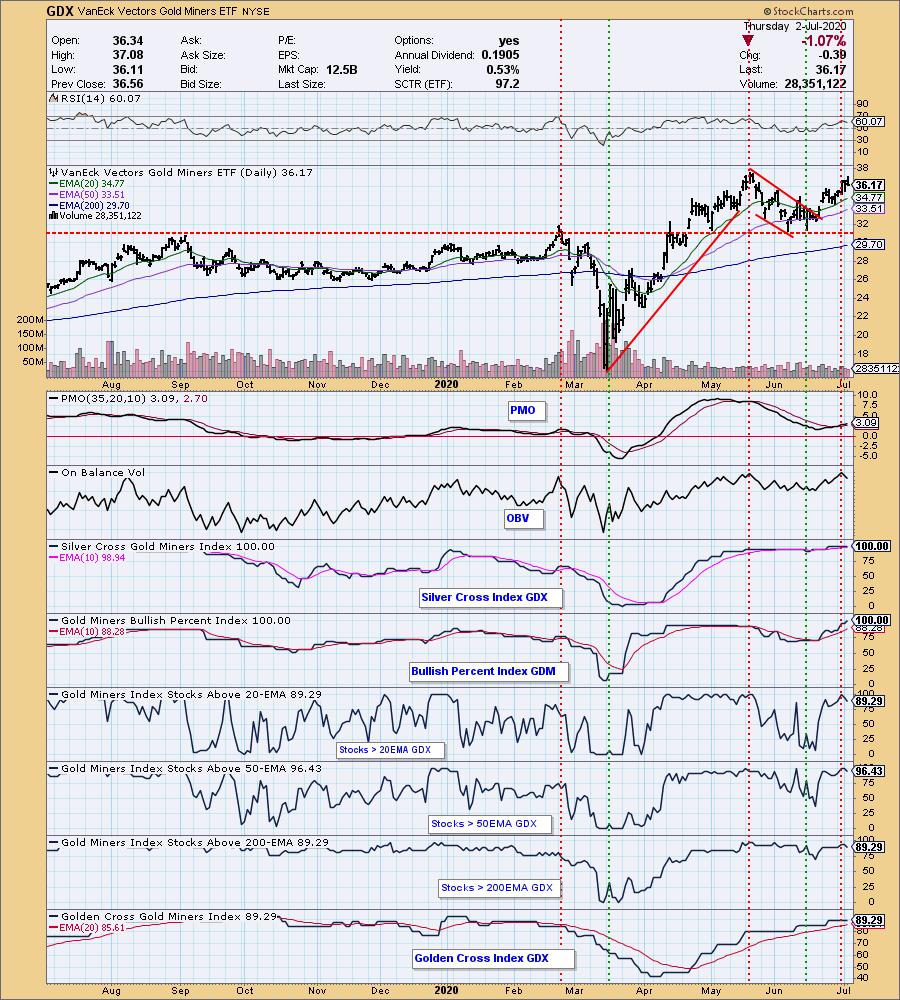
GOLD MINERS Golden and Silver Cross Indexes: All indicators except the PMO are overbought, but that condition can persist for some time. The daily PMO has bottomed, and the overbought benchmark set in May is far above its current reading.
CRUDE OIL ($WTIC)
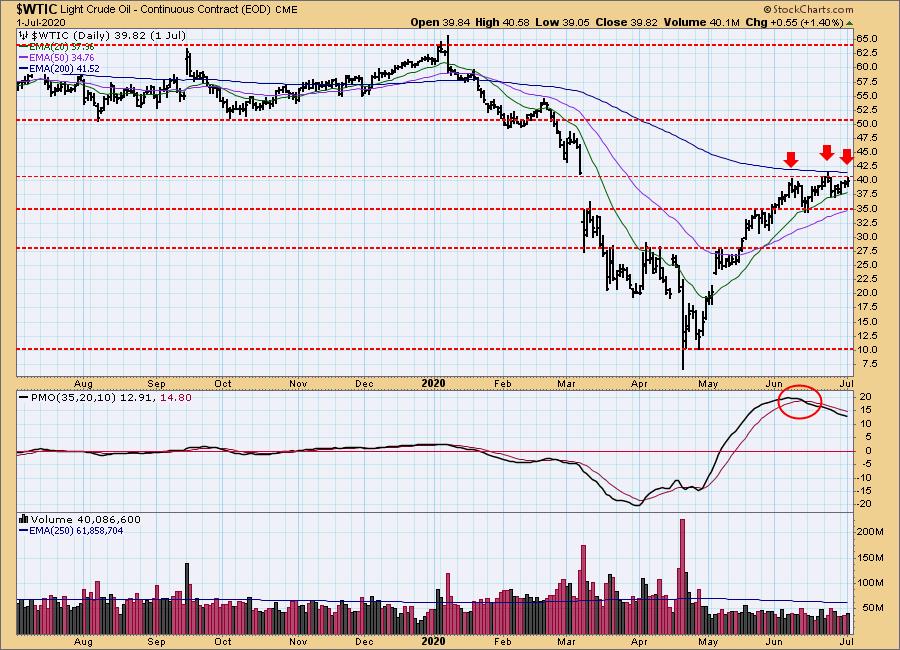
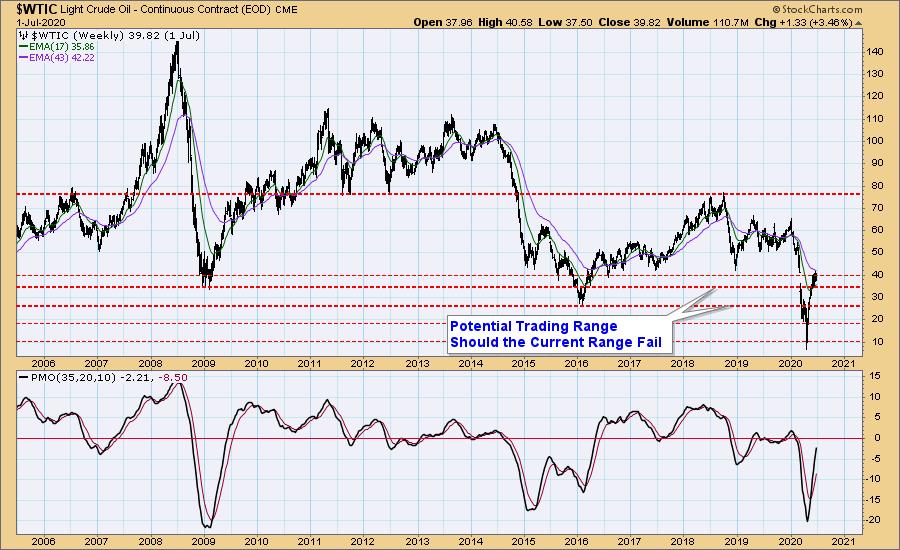
Until further notice we will use $WTIC to track the oil market. Since this is a continuous contract dataset, it doesn't "play well" with our Trend Models, and we will not report Trend Model signals for oil.
$WTIC Daily Chart: Oil is being stopped by overhead resistance at the top of the March down gap.
$WTIC Weekly Chart: Overhead resistance at 40 goes back about four years, and fundamentals for the industry do not appear favorable for higher prices at this time.
BONDS (TLT)
IT Trend Model: BUY as of 6/26/2020
LT Trend Model: BUY as of 1/2/2019
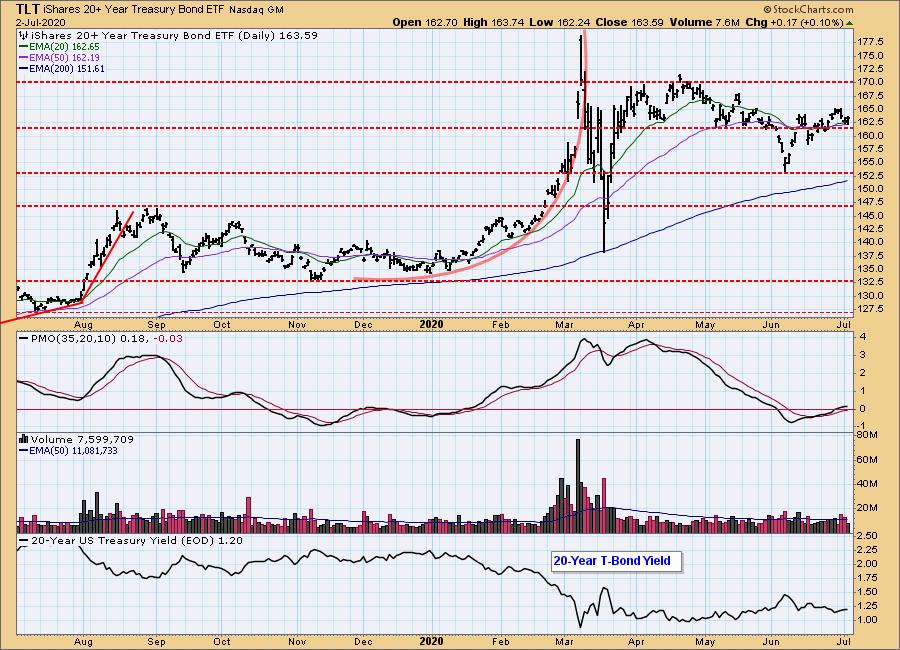
TLT Daily Chart: Until the Fed changes interest rates, I am assuming that TLT will remain within a range of about 153 to 170.
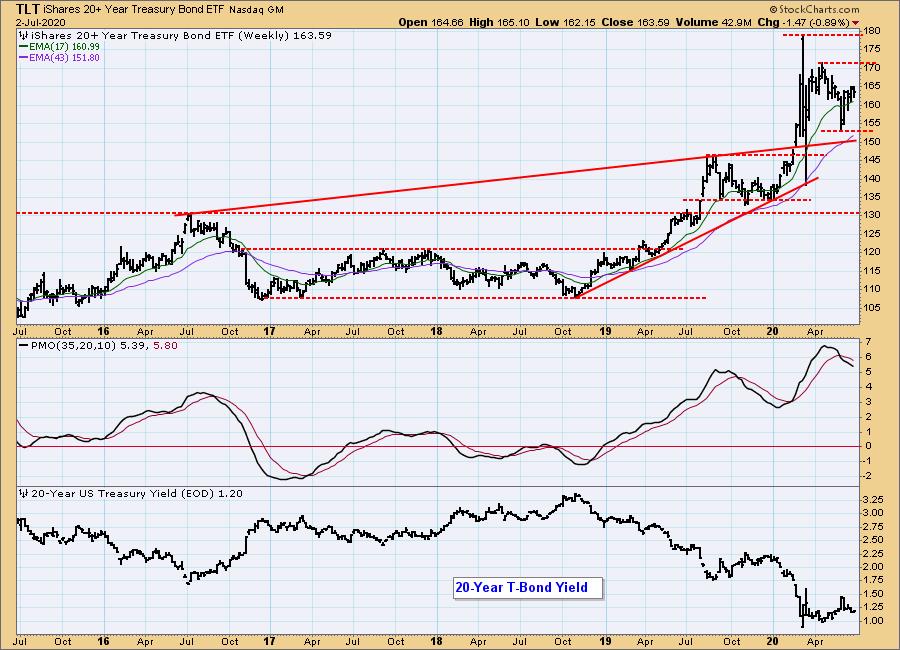
TLT Weekly Chart: No change in expectations for this time frame.
Technical Analysis is a windsock, not a crystal ball.
Happy Charting! - Carl
Disclaimer: This blog is for educational purposes only and should not be construed as financial advice. The ideas and strategies should never be used without first assessing your own personal and financial situation, or without consulting a financial professional. Any opinions expressed herein are solely those of the author, and do not in any way represent the views or opinions of any other person or entity.
NOTE: The signal status reported herein is based upon mechanical trading model signals, specifically, the DecisionPoint Trend Model. They define the implied bias of the price index based upon moving average relationships, but they do not necessarily call for a specific action. They are information flags that should prompt chart review. Further, they do not call for continuous buying or selling during the life of the signal. For example, a BUY signal will probably (but not necessarily) return the best results if action is taken soon after the signal is generated. Additional opportunities for buying may be found as price zigzags higher, but the trader must look for optimum entry points. Conversely, exit points to preserve gains (or minimize losses) may be evident before the model mechanically closes the signal.
Helpful DecisionPoint Links:
DecisionPoint Alert Chart List
DecisionPoint Golden Cross/Silver Cross Index Chart List
DecisionPoint Sector Chart List
Price Momentum Oscillator (PMO)
Swenlin Trading Oscillators (STO-B and STO-V)