
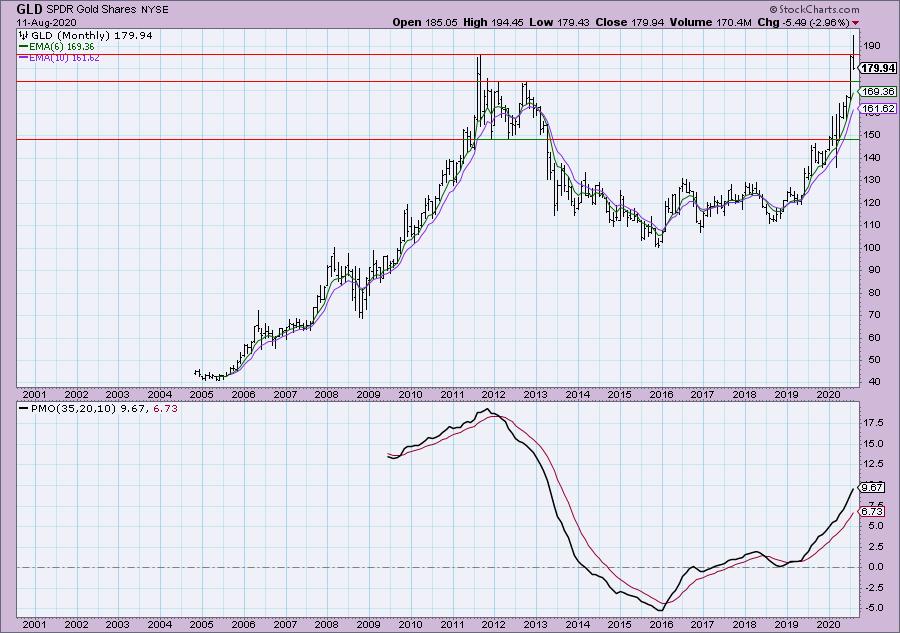
It would be impossible not to open with the correction in Gold today! I have comments from Carl in the section on Gold. The best news for Gold is it did hold support at the 2011 top and the bad news is that the Gold ETF (GLD) did NOT hold that support area. Below is the chart on GLD. At least we can see support at the 2012 top nearby. I'll go over the $GOLD chart in the section on Gold below.
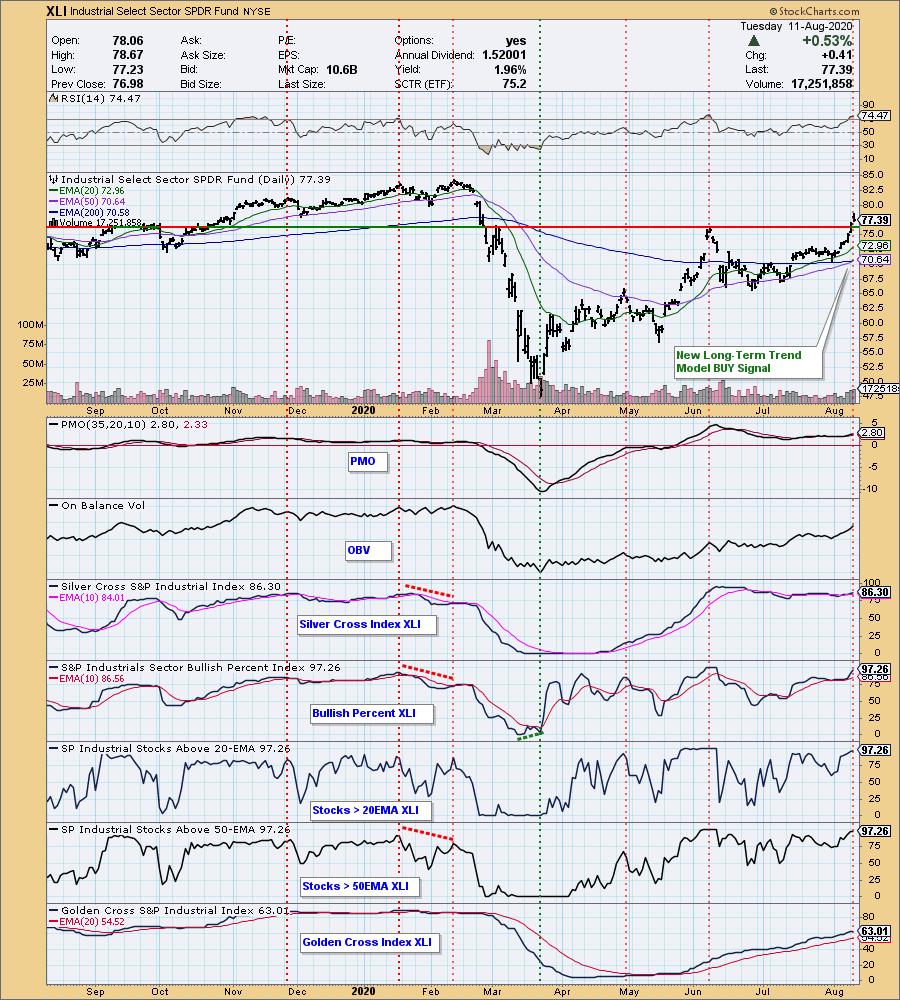
XLI triggered a new Long-Term Trend Model BUY signal as the 50-EMA crossed above the 200-EMA for a "Golden Cross". I still like this sector as money is rotating its way, but I do note that the RSI is overbought. The indicators are going the right way and certainly could support higher prices.
** PRICES ARE GOING UP! **
You do NOT need to concern yourself if you're happy with what you have. Your current rate will stay the same as long as your subscription remains in good standing. You can also switch to an annual subscription at anytime where you pay for 10 months and get 12 months.
For our DP Alert-only subscribers: You should consider our Bundle package. DP Diamonds Reports will be doubling to $50/mo so adding DP Diamonds later will be more expensive by far. Bundles currently are $50/mo or $500/yr.
If you add DP Diamonds after August 16th, it will cost you an additional $50/mo or $500/yr for a Bundle total of $80/mo or $800/yr after August 16th!
To summarize, if you don't have the Bundle, subscribe now before it becomes very expensive!
For my Diamonds subscribers, there will be a new 1-hour trading room, "The DecisionPoint Diamond Mine" on Fridays! It will be an opportunity for us to talk live, review current and past Diamonds for possible entries/exits/stops/targets and take your questions and symbol requests in this intimate trading room. But wait, there's more for Diamonds subscribers! I will be adding a Friday Diamonds Recap where I will look at the performance of that week's Diamonds and their prospects moving forward. Over the weekend we clean the slate and start over again.
There will also be a once a week free trading room, the "DecisionPoint Trading Room" for 1 hour on Tuesdays (we will keep our "diamonds" to ourselves though). I hope you enjoy the new changes that will be underway soon! **

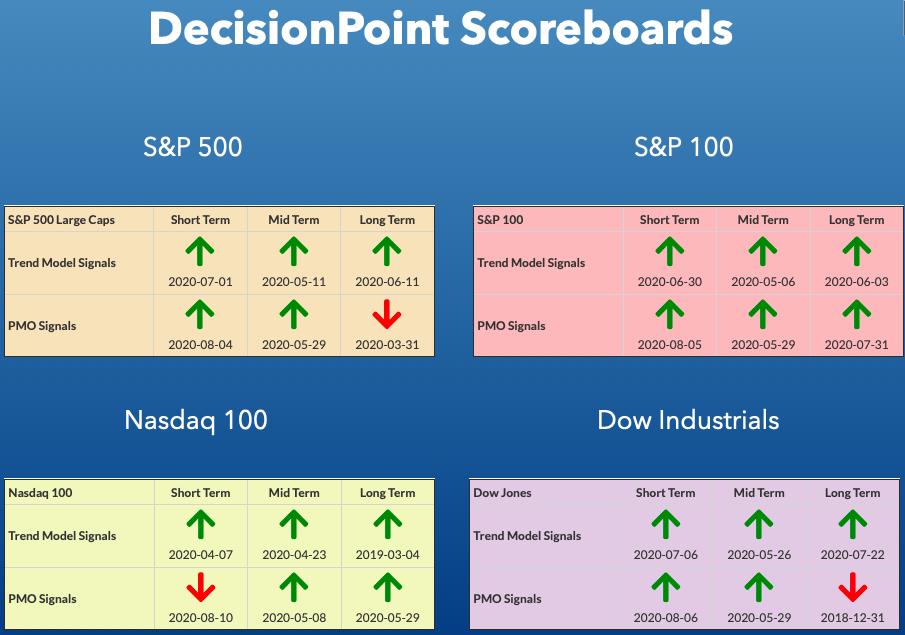
DP INDEX SCOREBOARDS:
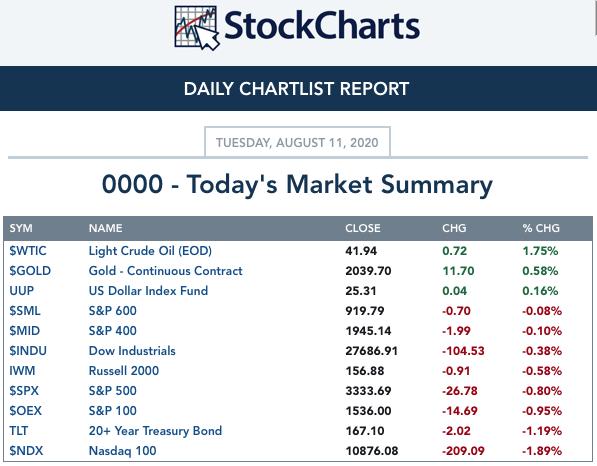
TODAY'S Broad Market Action:
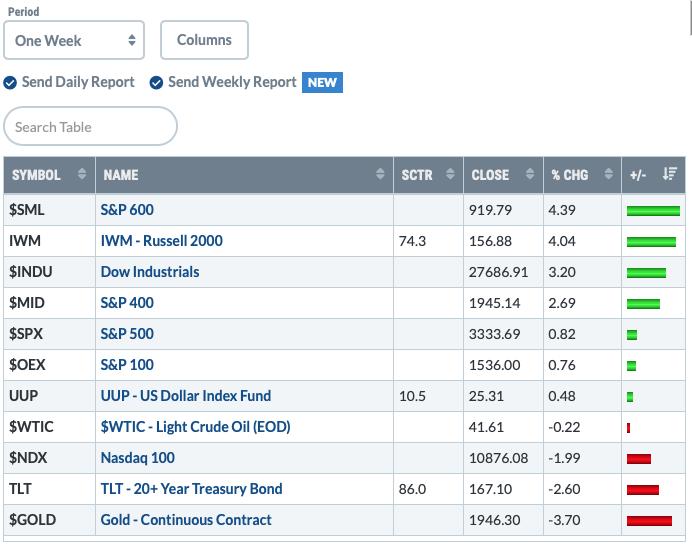
One WEEK Results:
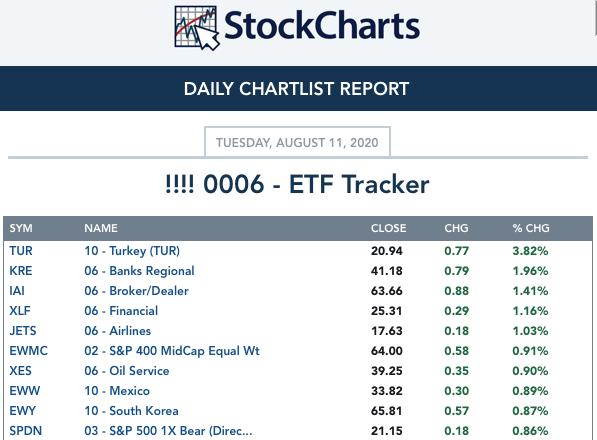
Top 10 from ETF Tracker:
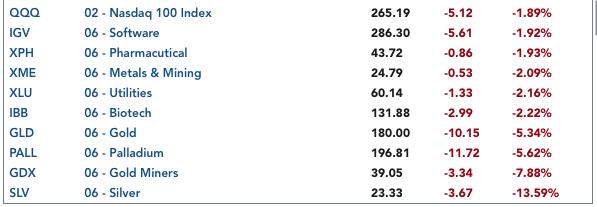
Bottom 10 from ETF Tracker:
On Friday, the DecisionPoint Alert Weekly Wrap presents an assessment of the trend and condition of the stock market (S&P 500), the U.S. Dollar, Gold, Crude Oil, and Bonds. Monday through Thursday the DecisionPoint Alert daily report is abbreviated and covers changes for the day.
Watch the latest episode of DecisionPoint on StockCharts TV's YouTube channel here!
SECTORS
SIGNALS:
Each S&P 500 Index component stock is assigned to one, and only one, of 11 major sectors. This is a snapshot of the Intermediate-Term (Silver Cross) and Long-Term (Golden Cross) Trend Model signal status for those sectors.
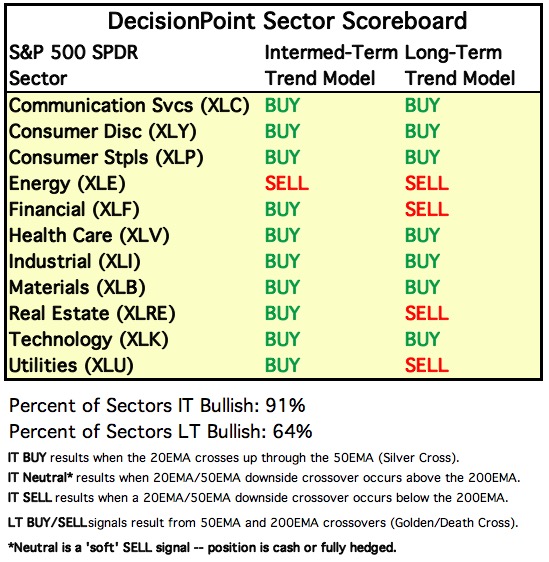
TODAY'S RESULTS:
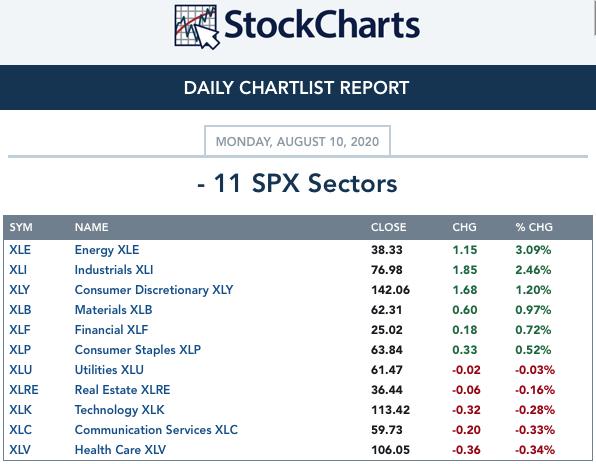
One WEEK Results: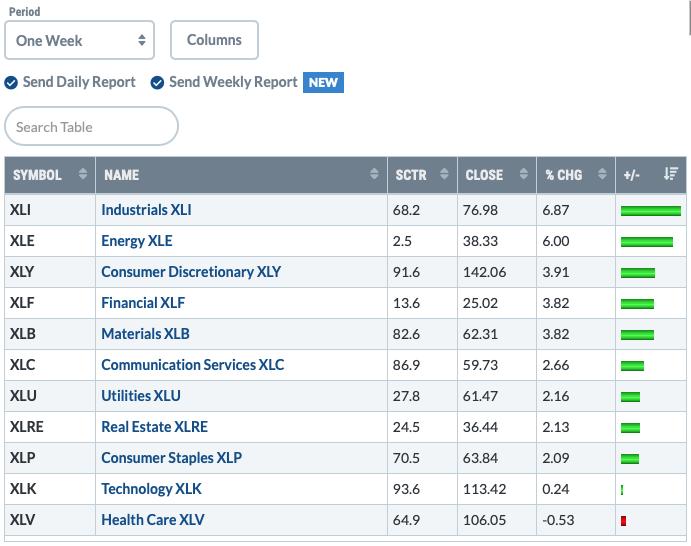
STOCKS
IT Trend Model: BUY as of 5/8/2020
LT Trend Model: BUY as of 6/8/2020
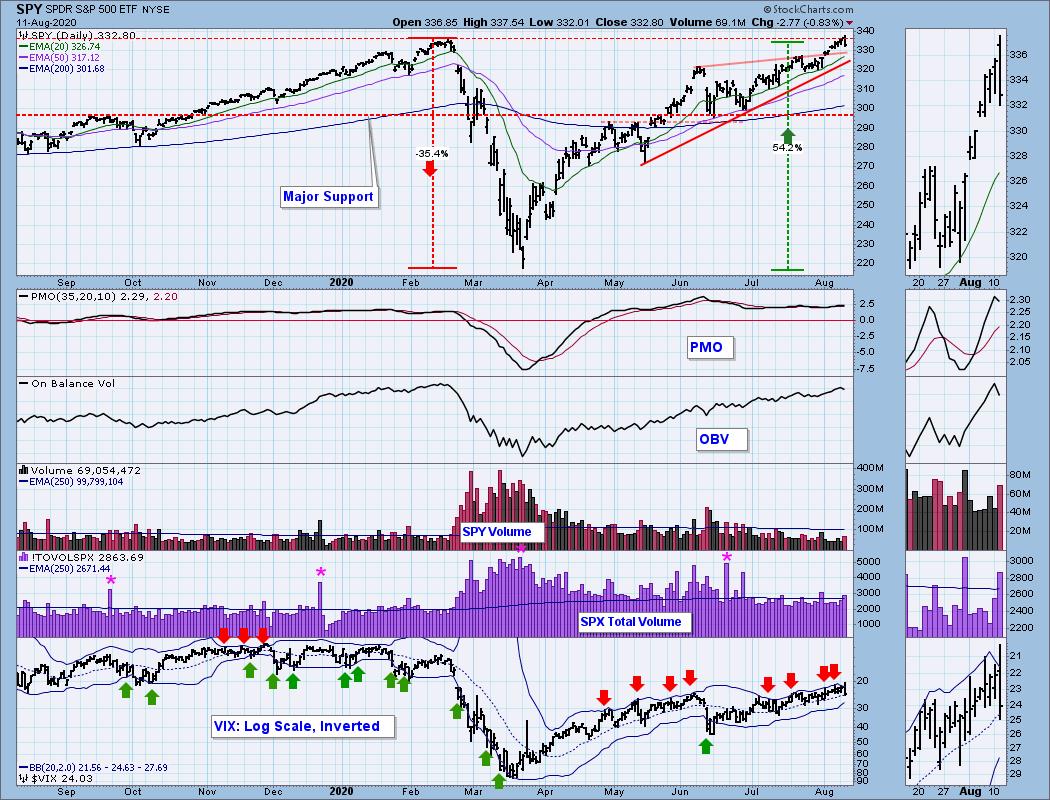
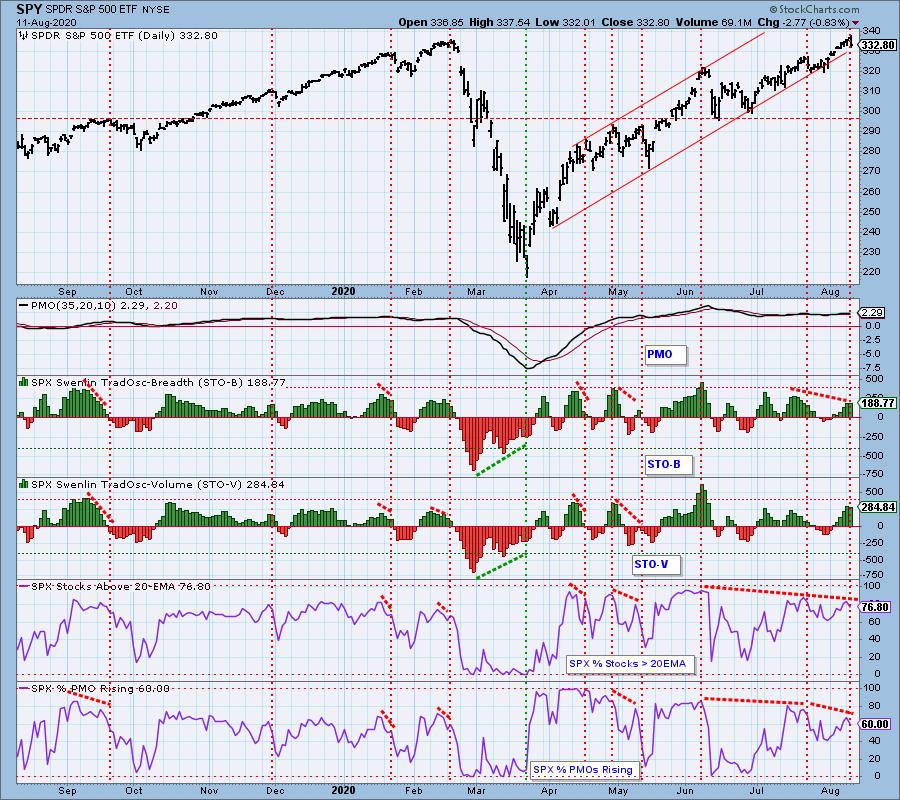
SPY Daily Chart: At long last we got a pullback today. All-time highs apparently are going to pose some problems for the SPY. There are few important things to note on today's chart. 1) The 20-EMA and rising bottoms trendlines are intact. Below that the 50-EMA awaits as support. 2) The VIX looks sickly. We got a puncture of the upper Bollinger Band on the inverted scale and that generally leads to a day or two of downside. 3) The PMO has topped. 4) Volume was very high on a decline.
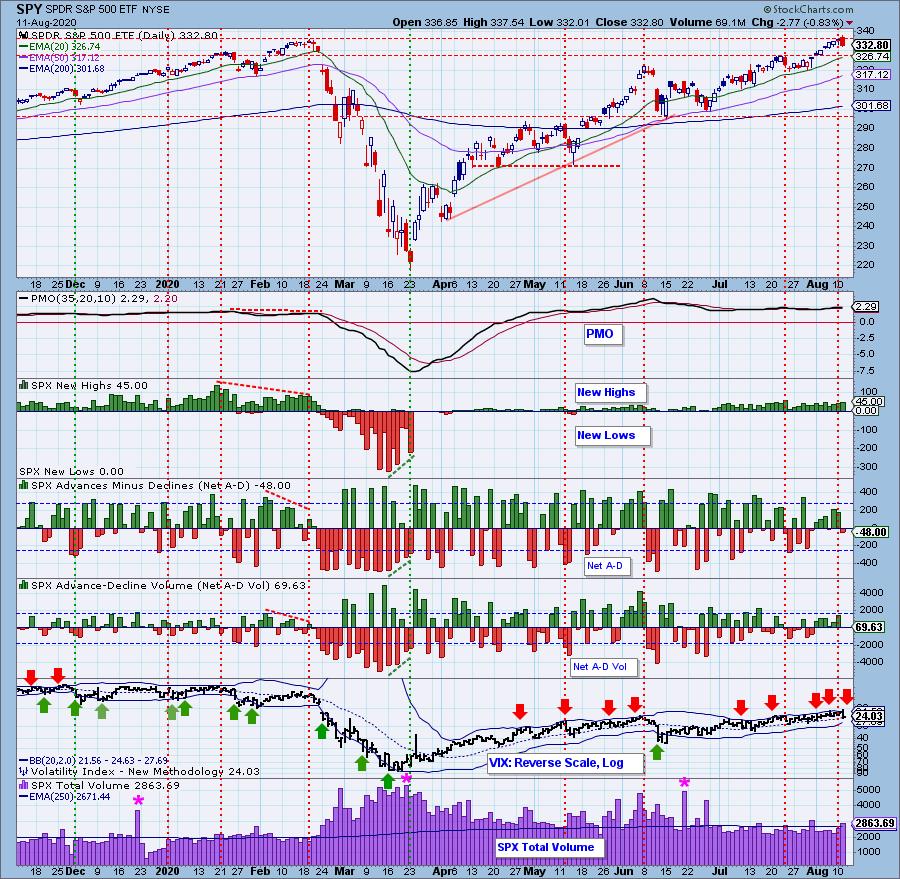
Climactic Market Indicators: I was actually very surprised to not see climactic readings to the downside today. In fact, Net A-D Volume was actually climactic to the upside and we saw more New Highs. I called for a buying exhaustion on Thursday, so perhaps we are seeing a continuation of that exhaustion and instead of an initiation impulse to the downside, it is just a the buying exhaustion playing out.
Short-Term Market Indicators: The short-term market trend is UP and the condition is OVERBOUGHT. Based upon the STO ranges, market bias is BULLISH. These indicators are tipping over in overbought territory which is bearish and negative divergences persist.
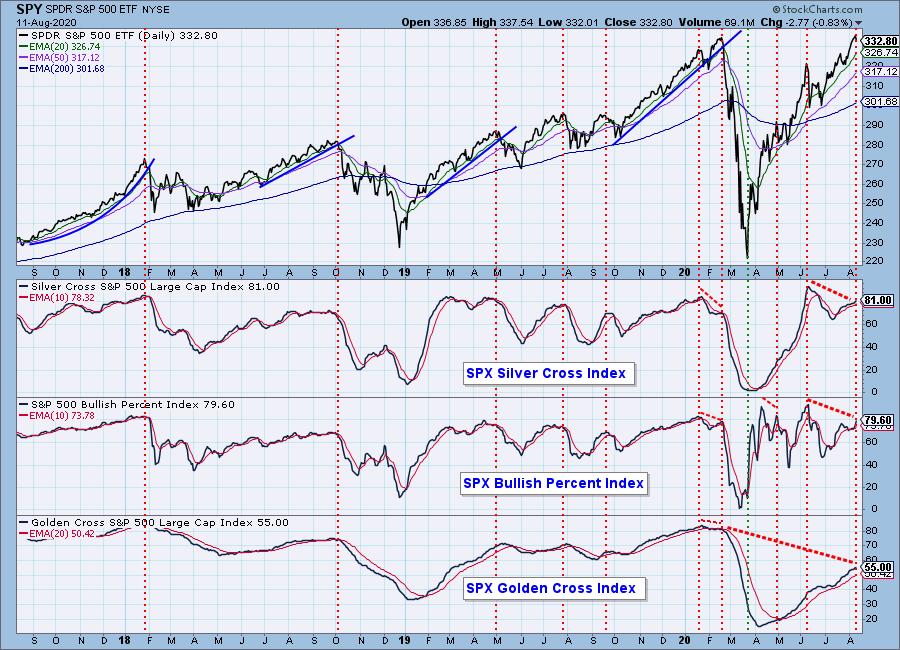
Intermediate-Term Market Indicators: The following chart uses different methodologies for objectively showing the depth and trend of participation for intermediate- and long-term time frames.
- The Silver Cross Index (SCI) shows the percentage of SPX stocks on IT Trend Model BUY signals (20-EMA > 50-EMA).
- The Golden Cross Index (GCI) shows the percentage of SPX stocks on LT Trend Model BUY signals (50-EMA > 200-EMA).
- The Bullish Percent Index (BPI shows the percentage of SPX stocks on Point & Figure BUY signals.
All of these indicators are rising, but still have negative divergences in play.
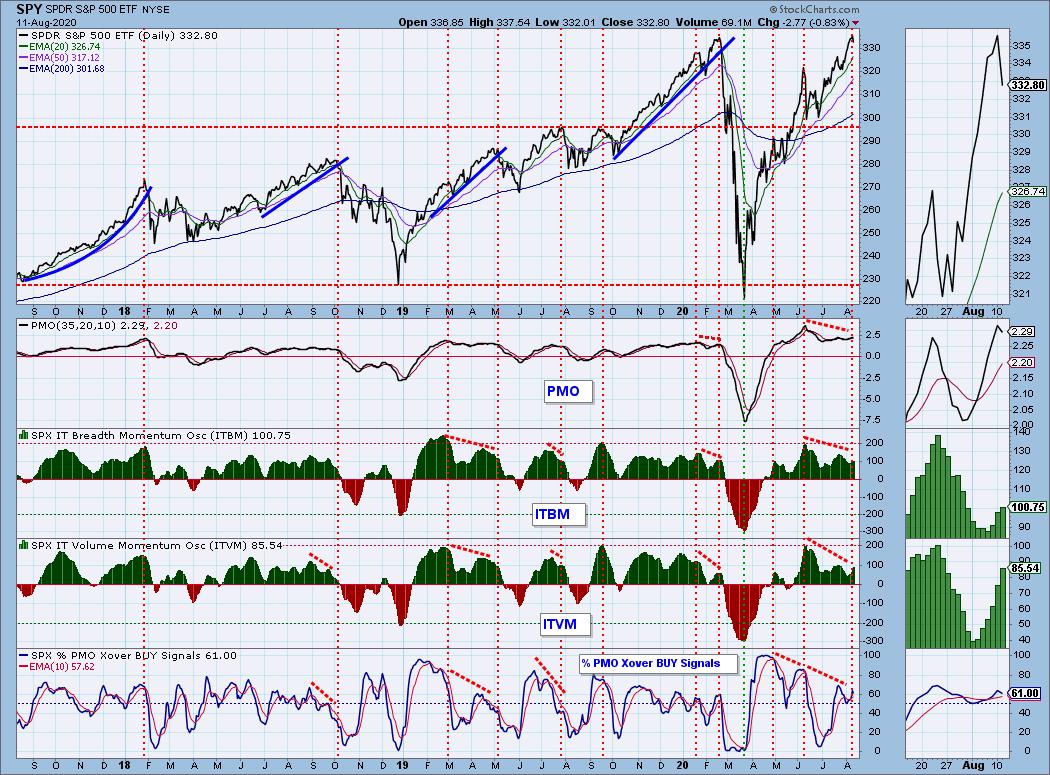
The intermediate-term market trend is UP and the condition is OVERBOUGHT. With most of the ITBM/ITVM readings since the end of April being above the zero lines, the market bias is BULLISH. The ITBM/ITVM continue to rise and are now overbought. I note that %PMO Xover BUY Signals ticked lower.
CONCLUSION: It seems time for the market to pullback and the short-term indicators are confirming that. Negative divergences are in play. We saw high volume on a down day along with a puncture of the upper Bollinger Band for the VIX on the inverted scale. This suggests more decline ahead for the broad market. Fortunately there are plenty of areas for price to find support as it moves lower.
DOLLAR (UUP)
IT Trend Model: NEUTRAL as of 5/28/2020
LT Trend Model: SELL as of 7/10/2020
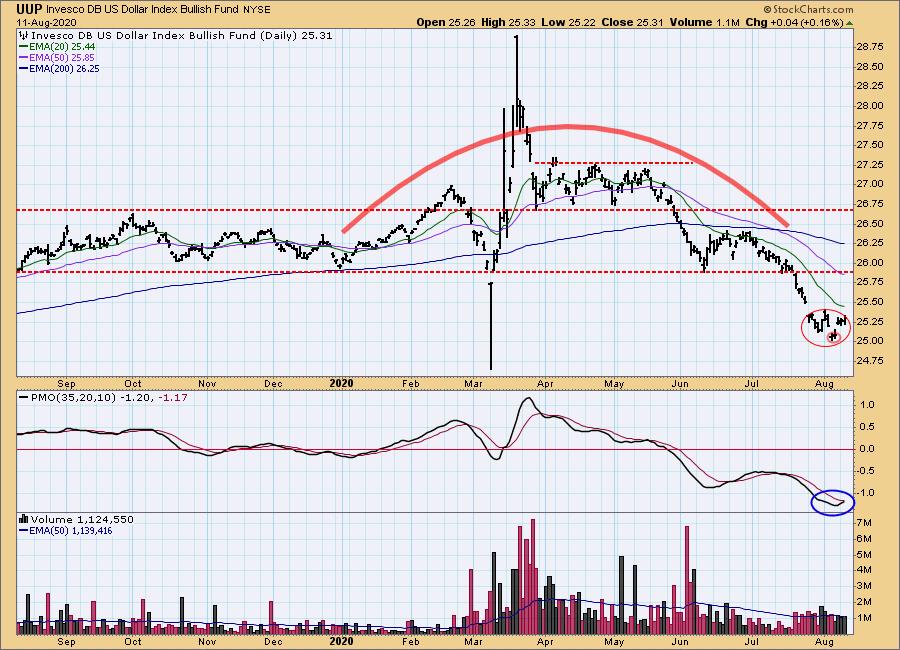
UUP Daily Chart: Yesterday's comments still apply:
"Carl suggested in Friday's Weekly Wrap that we could be looking at a two bar reverse island on UUP and he was correct. I also note the larger island. The PMO has turned up in oversold territory so this could be a possible rally point. Gold is in need of a pullback, so this could be the perfect storm."
GOLD
IT Trend Model: BUY as of 3/24/2020
LT Trend Model: BUY as of 1/8/2019
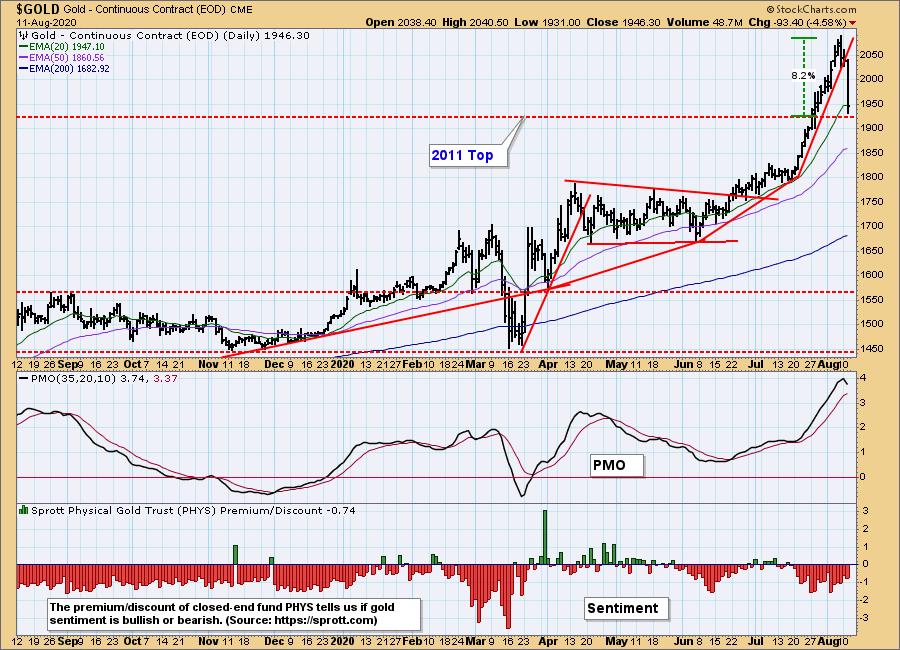
GOLD Daily Chart: While both Carl and I agreed that Gold needed a pause, this was unexpected. Although I did use the comment "perfect storm" yesterday when I talked about the Dollar turning back around. Here are Carl's comments:
I can find no news that rationally connects to gold's crash. Because of lack of bullish sentiment, I thought we would be spared a violent pullback, but I was wrong about that. The most compelling negative technical issue is the vertical up move since mid-July – vertical advances beg for vertical corrections. As of today, gold has taken back 50% of that move, which may be sufficient for the correction. Gold is still above the support line drawn across the 2011 top, but I will personally turn negative if that support is broken. Now would be a good time to see some sideways consolidation.
Full Disclosure: I own GLD long-term but will likely take profits this week.
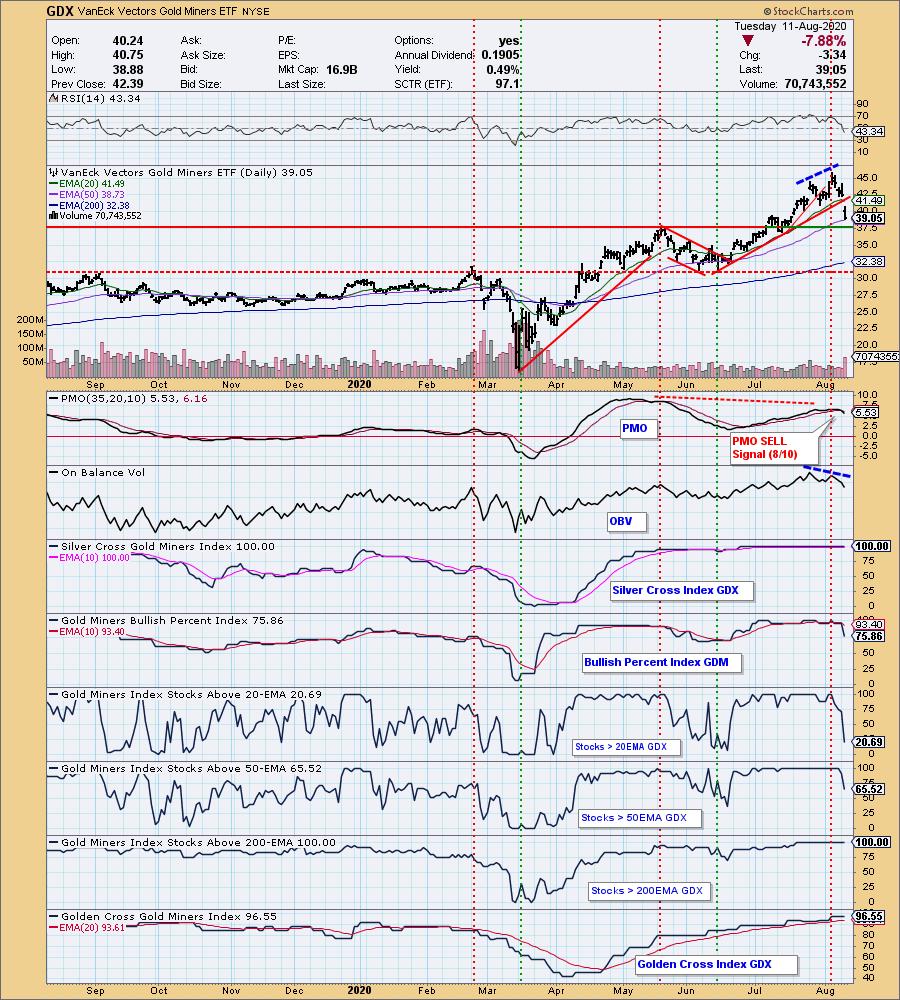
GOLD MINERS Golden and Silver Cross Indexes: Gold Miners had both the price of Gold and the broad market against them today so it wasn't too surprising to see this decline. The RSI has now turned negative, the PMO triggered a SELL signal in overbought territory. The OBV which is still in a negative divergence with price tops called this breakdown. Notice the drop in Miner members with their price above their 20-EMAs and 50-EMAs! The BPI also took a dive. The good news is that support at the May top and the 50-EMA are right here. Miners needed this pullback and while painful, it does open up the possibly of reentry should this support level hold. If it doesn't, it could be a long ride down to the 200-EMA.
CRUDE OIL (USO)
IT Trend Model: NEUTRAL as of 1/27/2020
LT Trend Model: SELL as of 2/3/2020
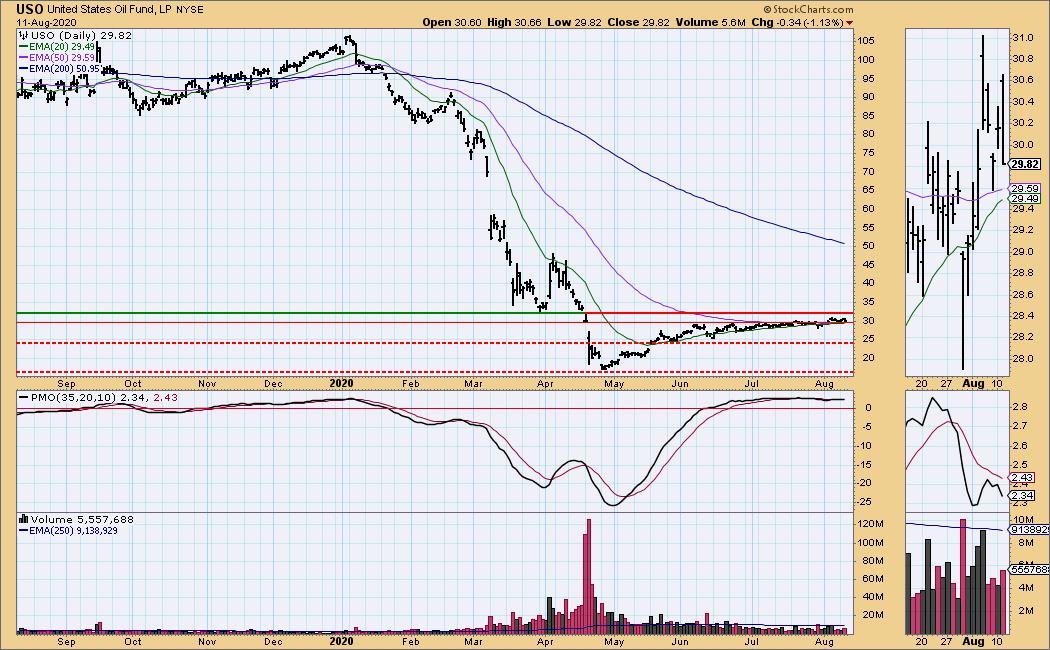
USO Daily Chart: Oil dropped and closed on its low. It was looking somewhat bullish as price has managed to remain above the 20/50-EMAs which are nearing a "Silver Cross" positive crossover. The PMO has topped a second time below its signal line which is especially bearish. I would look for price to remain stuck between the 20-EMA and resistance at the March low.
BONDS (TLT)
IT Trend Model: BUY as of 6/26/2020
LT Trend Model: BUY as of 1/2/2019
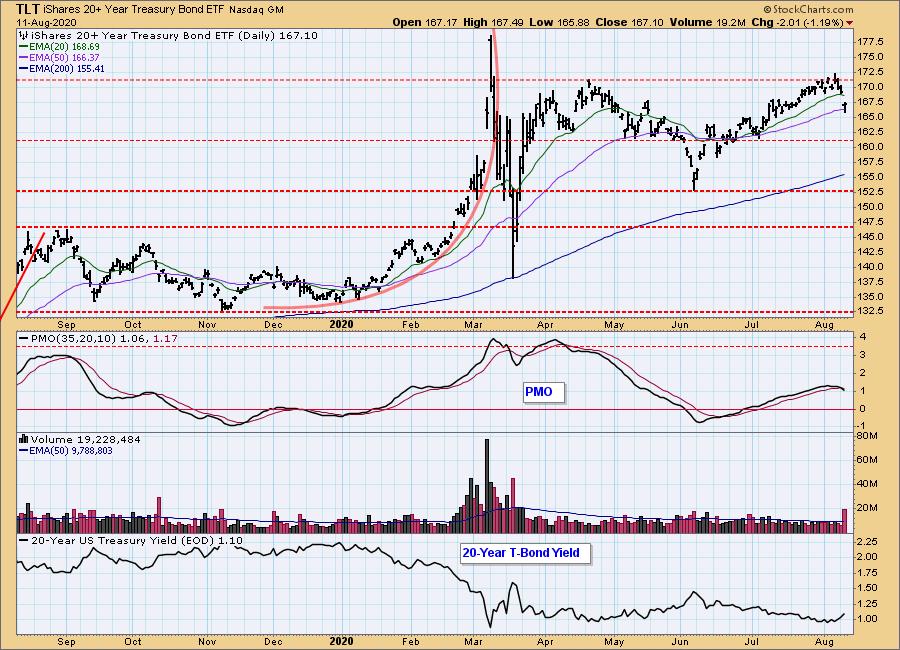
TLT Daily Chart: Today we saw a PMO SELL signal and a deep decline that had price testing the 50-EMA. While it held, the high volume on this decline that is accompanied by that PMO SELL signal will have me out of TLT this week, if not tomorrow.
Full disclosure: I own TLT.
Have you subscribed the DecisionPoint Diamonds yet? DP does the work for you by providing handpicked stocks/ETFs from exclusive DP scans! Get in on the new "DecisionPoint Diamond Mine" trading room as part of that subscription! Contact support@decisionpoint.com for more information!
Technical Analysis is a windsock, not a crystal ball.
Happy Charting! - Erin
Email: erin@decisionpoint.com
ANNOUNCEMENT:
I have the information for my VIRTUALpresentation at The Money Show!
I present on August 19th at 1:20p EST!
Click here for information on how to register to see me!

NOTE: The signal status reported herein is based upon mechanical trading model signals, specifically, the DecisionPoint Trend Model. They define the implied bias of the price index based upon moving average relationships, but they do not necessarily call for a specific action. They are information flags that should prompt chart review. Further, they do not call for continuous buying or selling during the life of the signal. For example, a BUY signal will probably (but not necessarily) return the best results if action is taken soon after the signal is generated. Additional opportunities for buying may be found as price zigzags higher, but the trader must look for optimum entry points. Conversely, exit points to preserve gains (or minimize losses) may be evident before the model mechanically closes the signal.
Helpful DecisionPoint Links (Can Be Found on DecisionPoint.com Links Page):
DecisionPoint Shared ChartList and DecisionPoint Chart Gallery
Price Momentum Oscillator (PMO)