
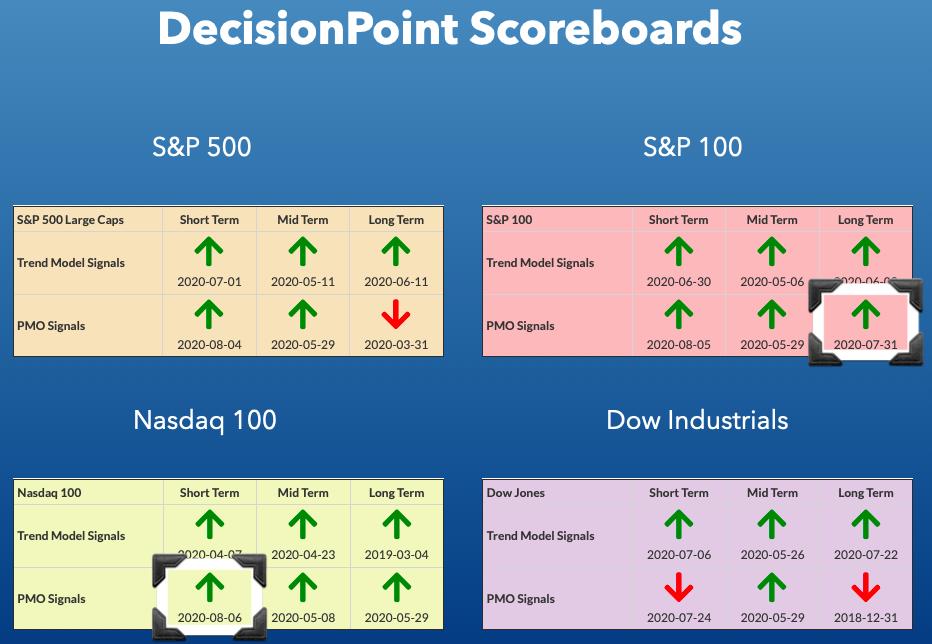
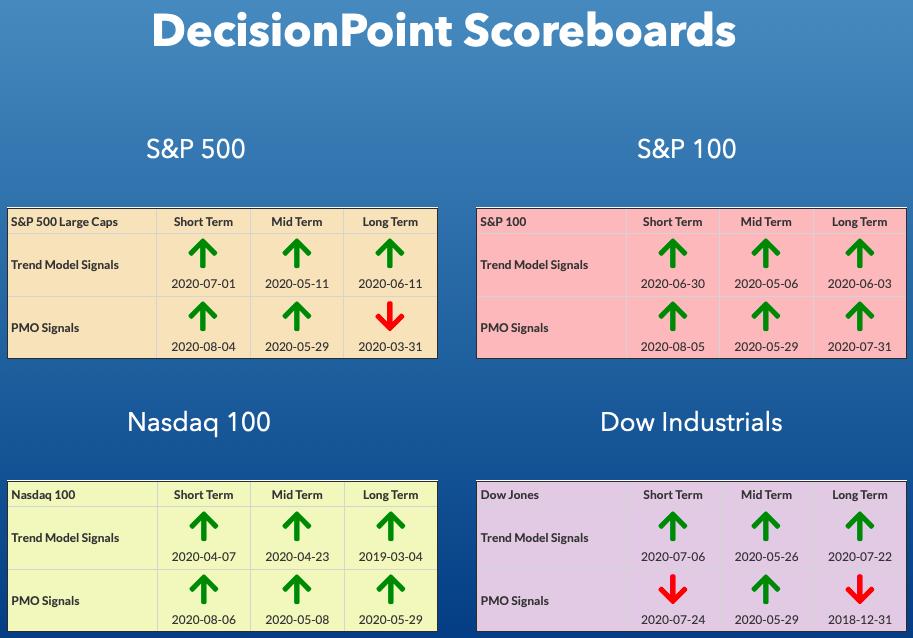
Two of the DecisionPoint Scoreboards are now completely green; meaning they have BUY signals on the Trend Models and on all three Price Momentum Oscillator (PMO) timeframes. The Nasdaq 100 (NDX) triggered a new Short-Term PMO BUY signal today and as I was reviewing a few monthly charts, I realized the the SP100 (OEX) generated a Long-Term PMO BUY signal last Friday.
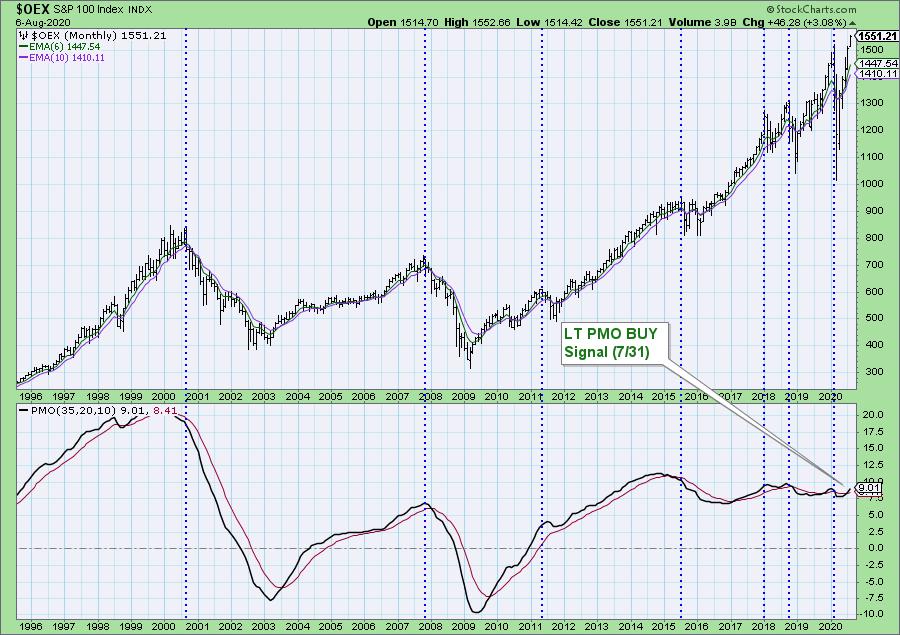
The PMO on the monthly chart had a positive crossover to generate a LT BUY signal. As you can see, usually the long-term PMO doesn't generate a whole lot of signals and it used to travel without so much twitch. With the volatility generated in 2018, the PMO began to move sideways and whipsaw. Consequently, right now I don't put as much emphasis on these LT PMO signals.
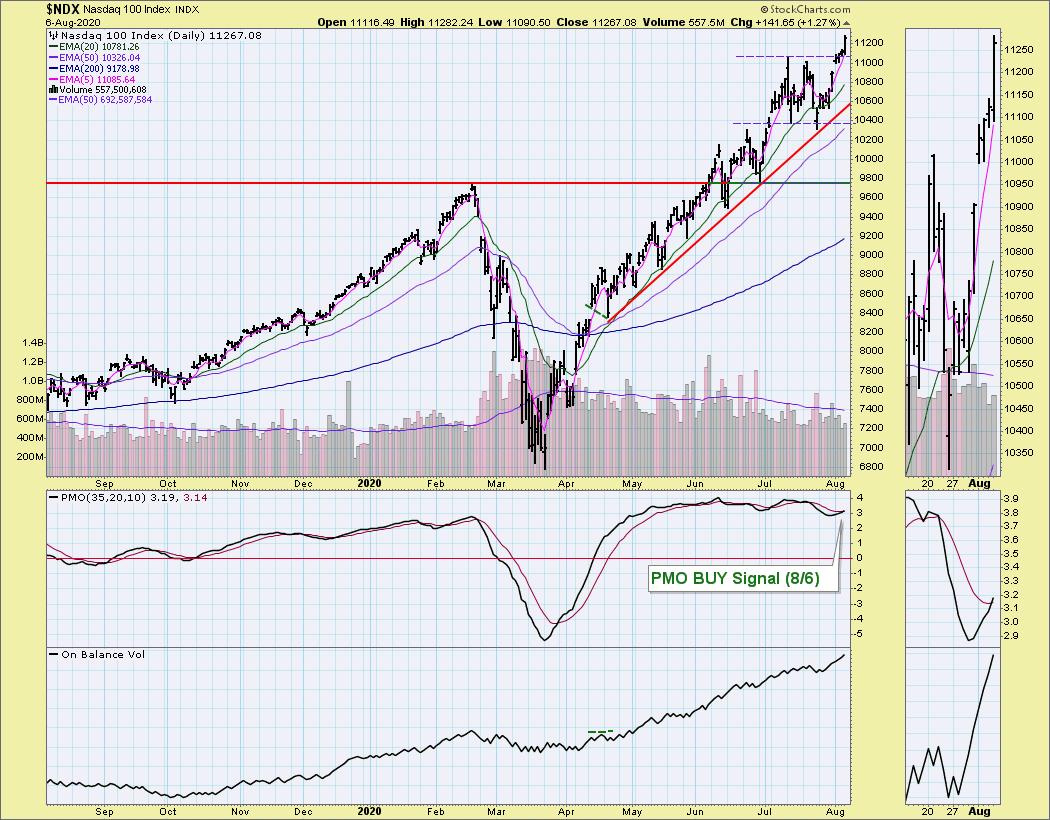
After a huge breakout move today, it is not surprising to see this new PMO BUY signal hit the Scoreboard. There's not much to complain about here except to say it is overbought...but what's new?
** PRICES ARE GOING UP! **
You do NOT need to concern yourself if you're happy with what you have. Your current rate will stay the same as long as your subscription remains in good standing. You can also switch to an annual subscription at anytime where you pay for 10 months and get 12 months.
For our DP Alert-only subscribers: You should consider our Bundle package. DP Diamonds Reports will be doubling to $50/mo so adding DP Diamonds later will be more expensive by far. Bundles currently are $50/mo or $500/yr.
If you add DP Diamonds after August 16th, it will cost you an additional $50/mo or $500/yr for a Bundle total of $80/mo or $800/yr after August 16th!
To summarize, if you don't have the Bundle, subscribe now before it becomes very expensive!
For my Diamonds subscribers, there will be a new 1-hour trading room, "The DecisionPoint Diamond Mine" on Fridays! It will be an opportunity for us to talk live, review current and past Diamonds for possible entries/exits/stops/targets and take your questions and symbol requests in this intimate trading room. But wait, there's more for Diamonds subscribers! I will be adding a Friday Diamonds Recap where I will look at the performance of that week's Diamonds and their prospects moving forward. Over the weekend we clean the slate and start over again.
There will also be a once a week free trading room, the "DecisionPoint Trading Room" for 1 hour on Tuesdays (we will keep our "diamonds" to ourselves though). I hope you enjoy the new changes that will be underway soon! **
DP INDEX SCOREBOARDS:
TODAY'S Broad Market Action:
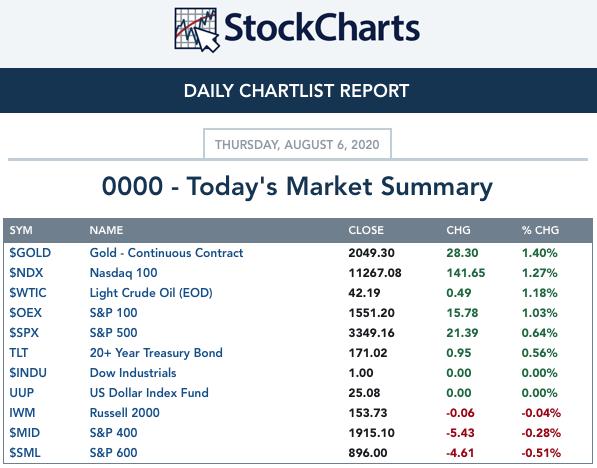
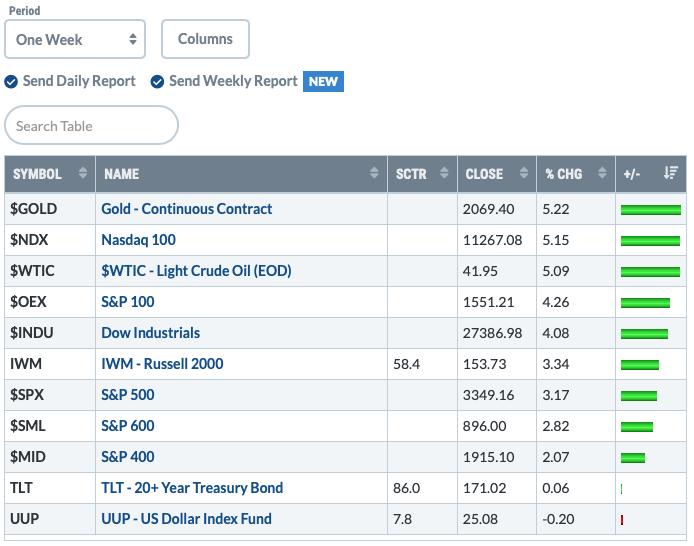
One WEEK Results:
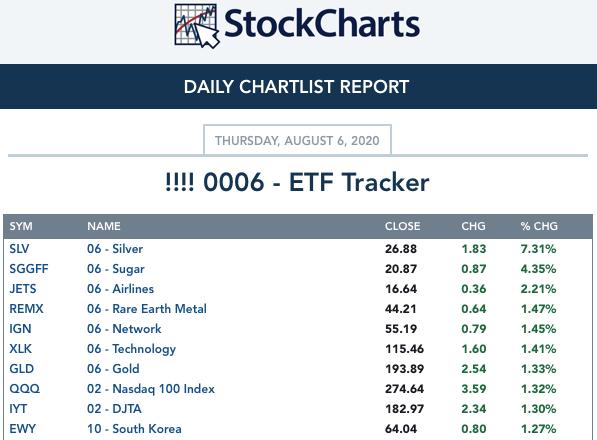
Top 10 from ETF Tracker:
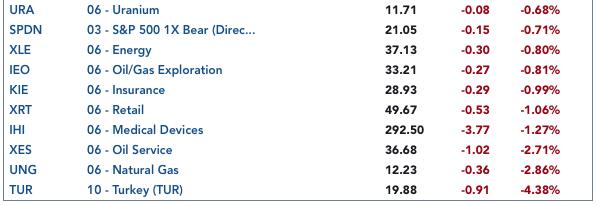
Bottom 10 from ETF Tracker:
On Friday, the DecisionPoint Alert Weekly Wrap presents an assessment of the trend and condition of the stock market (S&P 500), the U.S. Dollar, Gold, Crude Oil, and Bonds. Monday through Thursday the DecisionPoint Alert daily report is abbreviated and covers changes for the day.
Watch the latest episode of DecisionPoint on StockCharts TV's YouTube channel here!
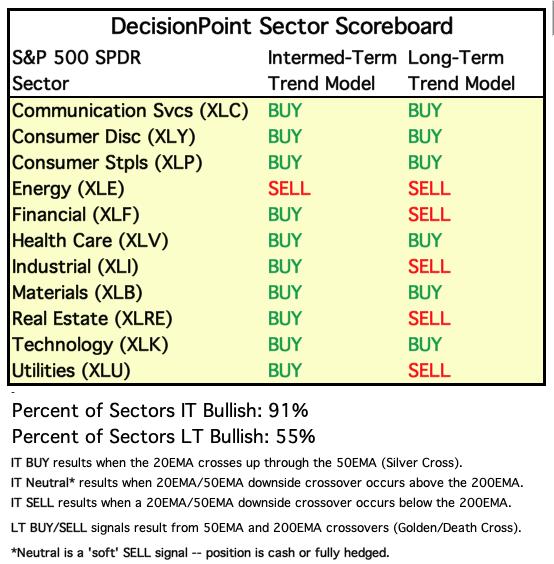
SECTORS
SIGNALS:
Each S&P 500 Index component stock is assigned to one, and only one, of 11 major sectors. This is a snapshot of the Intermediate-Term (Silver Cross) and Long-Term (Golden Cross) Trend Model signal status for those sectors.
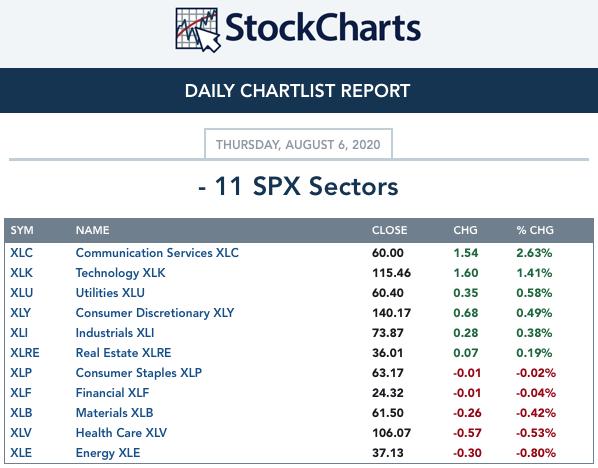
TODAY'S RESULTS:
One WEEK Results: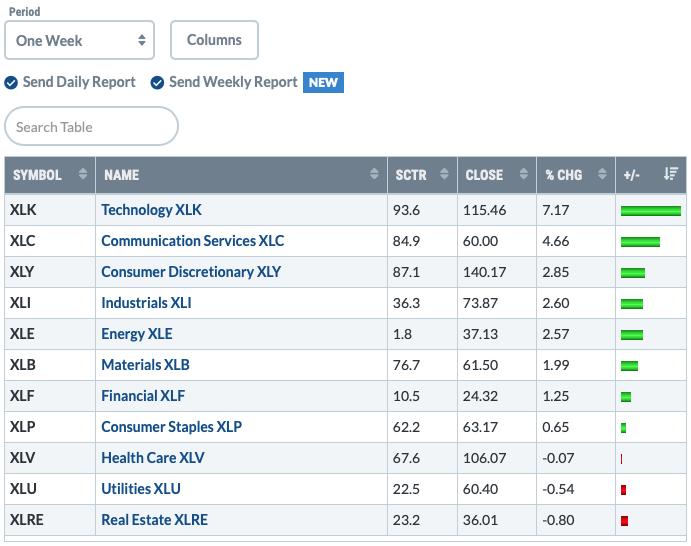
STOCKS
IT Trend Model: BUY as of 5/8/2020
LT Trend Model: BUY as of 6/8/2020
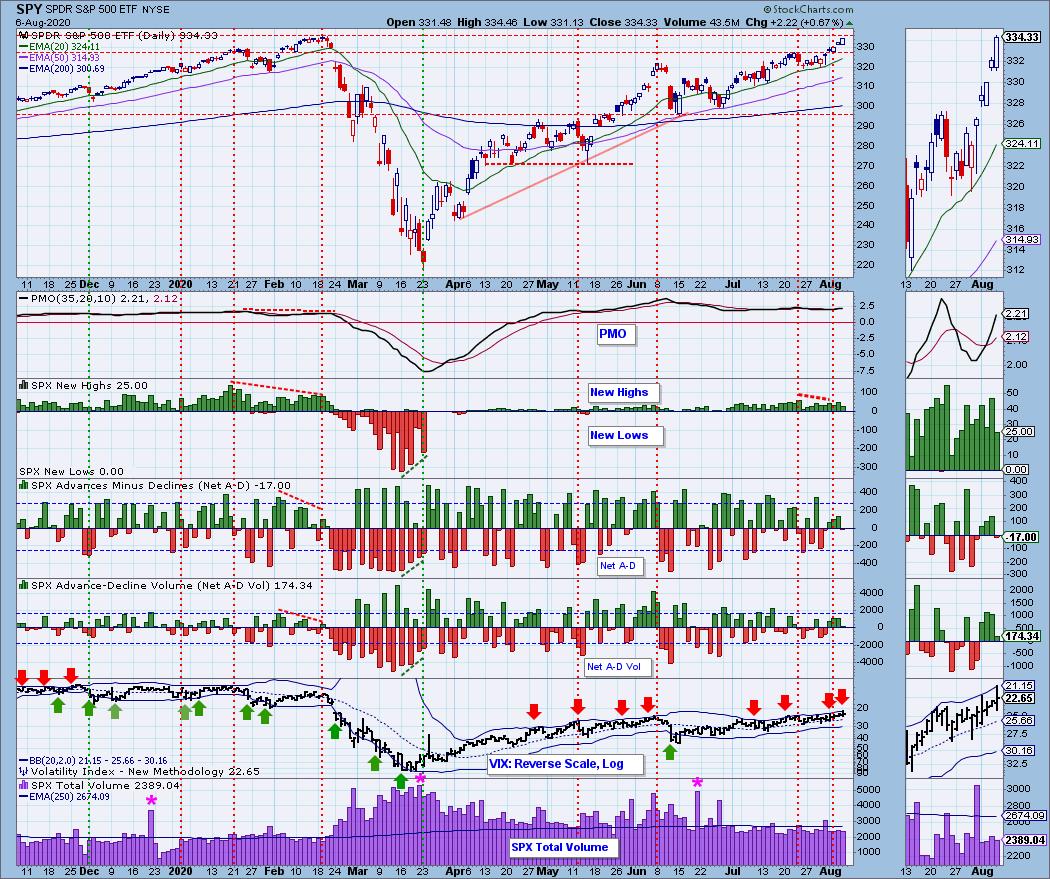
SPY Daily Chart: The market continues to impress with another breakout day. I like that price closed near the top of the range today and traded once again fully above gap resistance. I am starting to view this as a fairly strong support level, especially given how difficult it was as resistance. Volume was on par and the OBV is breaking out along with price which is positive.
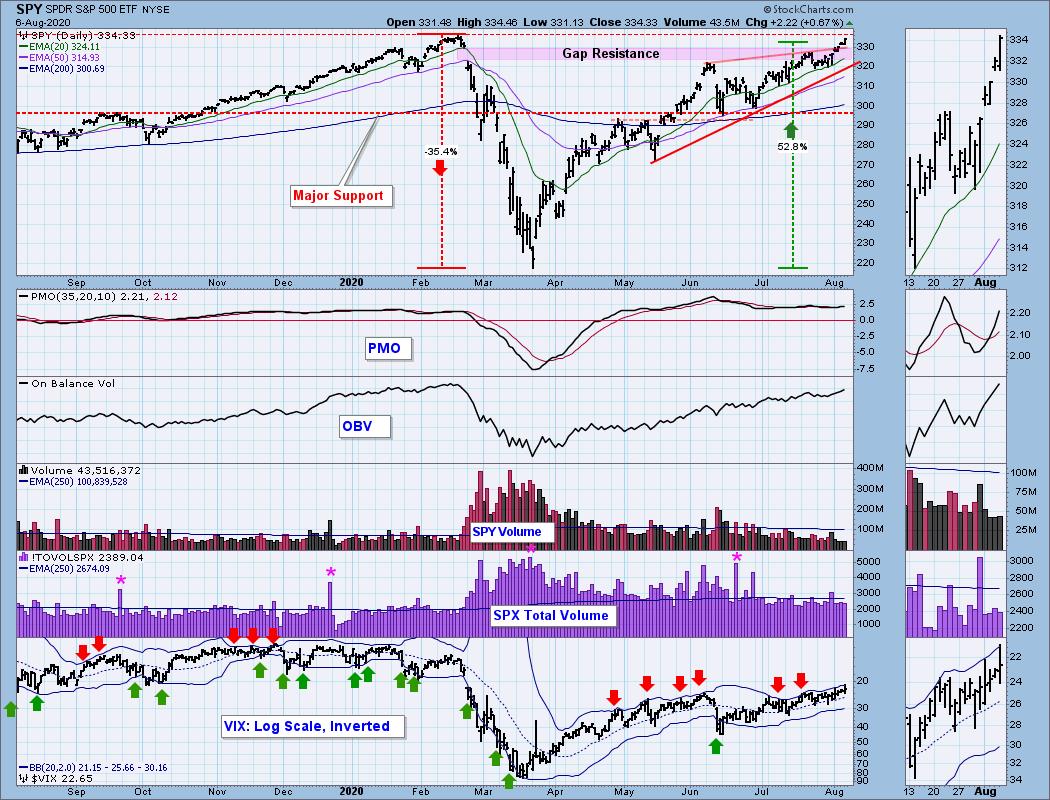
Climactic Market Indicators: No climactic numbers today, but we did see negative Net A-D which on a 0.67% move to the upside should really have at least been positive. Note that a negative divergence remains on New Highs and the VIX did hit its upper Bollinger Band today on the inverted scale which typically signals a decline the following day or two.
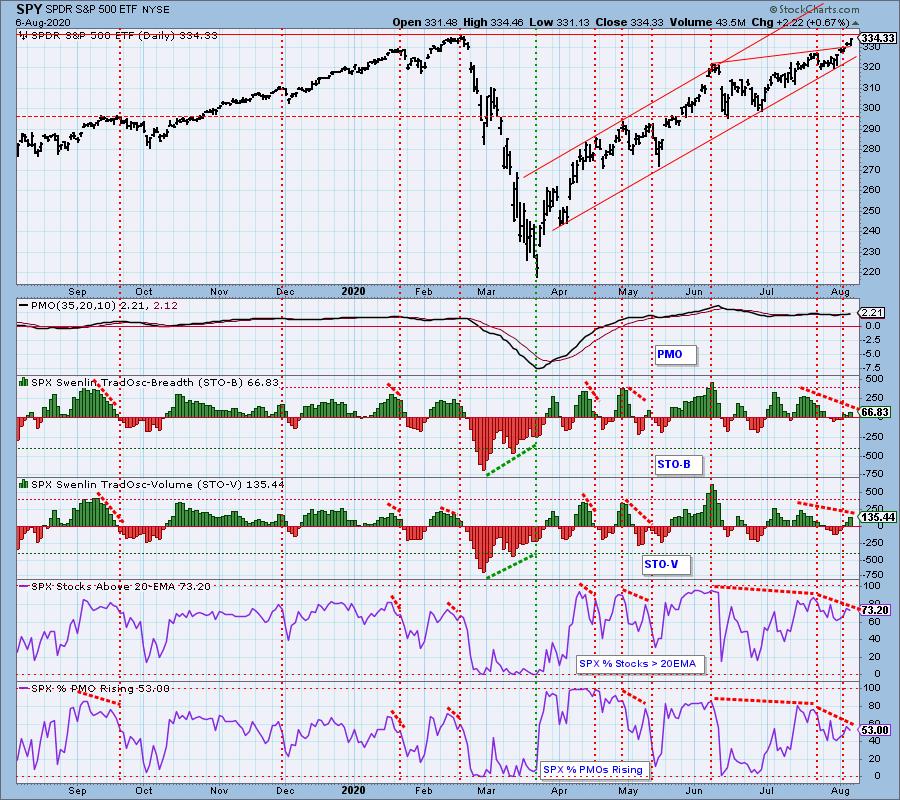
Short-Term Market Indicators: The short-term market trend is UP and the condition is NEUTRAL. Based upon the STO ranges, market bias is BULLISH. Both STOs are rising which is bullish, but I don't like the negative divergences on the %Stocks indicators.
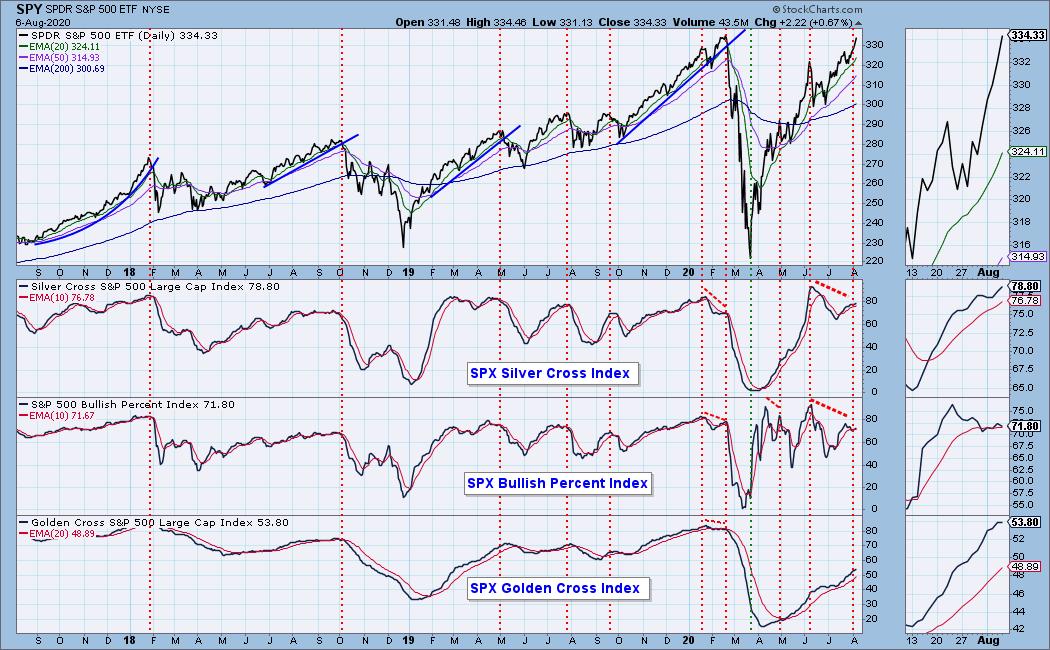
Intermediate-Term Market Indicators: The following chart uses different methodologies for objectively showing the depth and trend of participation for intermediate- and long-term time frames.
- The Silver Cross Index (SCI) shows the percentage of SPX stocks on IT Trend Model BUY signals (20-EMA > 50-EMA).
- The Golden Cross Index (GCI) shows the percentage of SPX stocks on LT Trend Model BUY signals (50-EMA > 200-EMA).
- The Bullish Percent Index (BPI shows the percentage of SPX stocks on Point & Figure BUY signals.
The SCI is rising and positive. The BPI didn't avert the negative divergence since it topped today. The GCI is trying to top. The BPI and GCI are troubling for the intermediate term.
The intermediate-term market trend is UP and the condition is OVERBOUGHT. With most of the ITBM/ITVM readings since the end of April being above the zero lines, the market bias is BULLISH. Indicators were mixed with the ITBM continuing to move lower and the ITVM moving upward. I like that we did get a rise in %PMO BUY signals, but I'd prefer these indicators to be moving in concert.
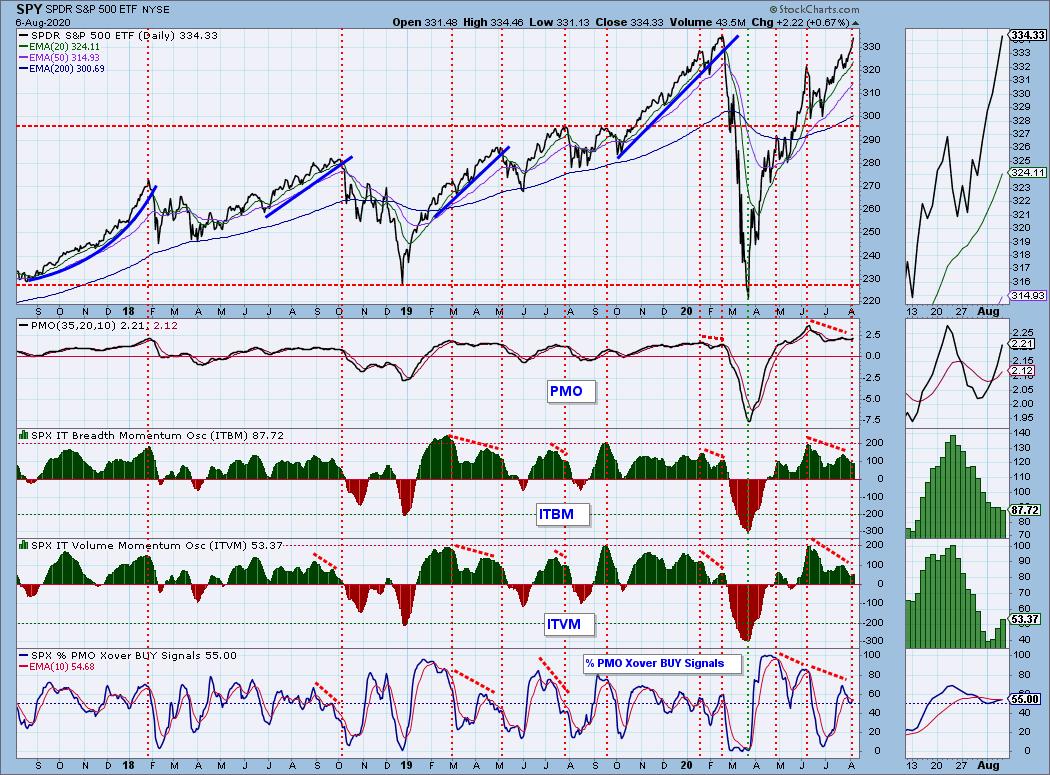
CONCLUSION: I see a few concerns given some of the indicators are mixed, but I trust my STOs and they are both rising right now. The bullish bias is clearly strong. I suspect like the NDX and OEX before it, it won't have too much trouble with all-time highs.
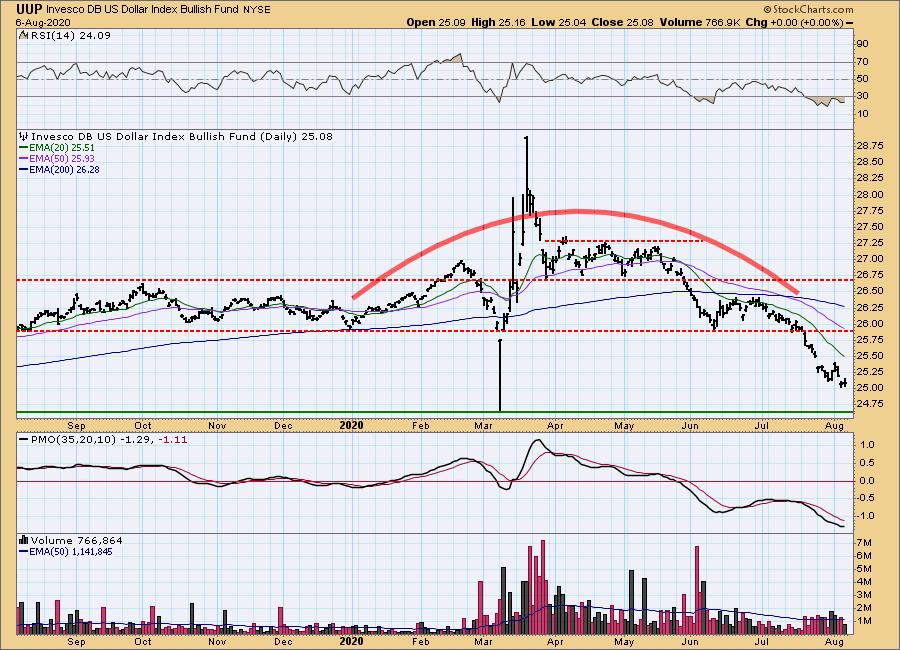
DOLLAR (UUP)
IT Trend Model: NEUTRAL as of 5/28/2020
LT Trend Model: SELL as of 7/10/2020
UUP Daily Chart: The island reversal is still in play for an upside move by the Dollar (UUP). The PMO is trying again to bottom. I just don't see any real support for it to bounce from here. I am looking for it to test the March low.
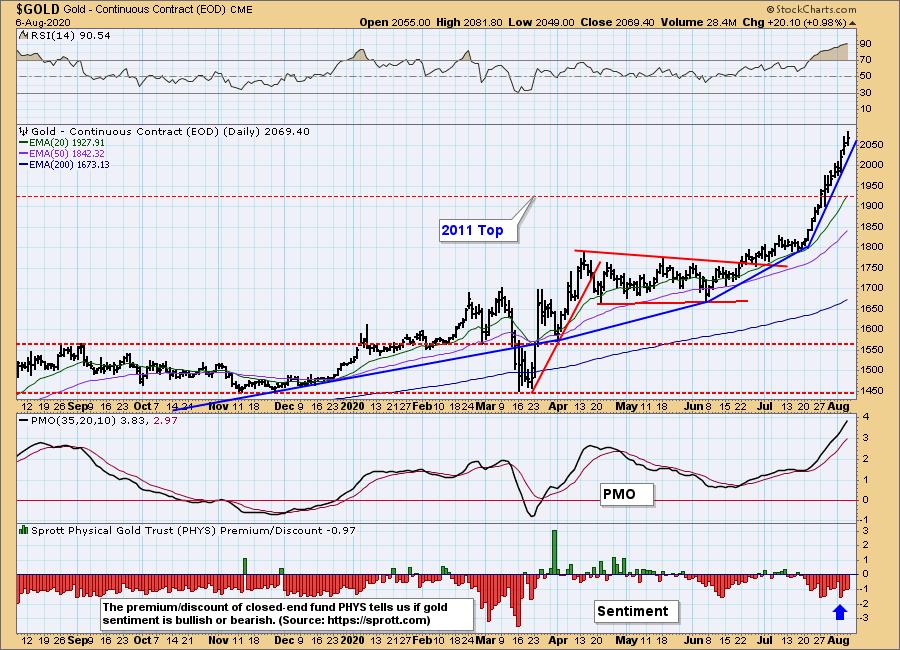
GOLD
IT Trend Model: BUY as of 3/24/2020
LT Trend Model: BUY as of 1/8/2019
GOLD Daily Chart: Yesterday's comments still apply:
"Gold is continues to soar and with the demise of the Dollar, I don't think it is done. Carl has been pointing to the continued discounts on PHYS. The public hasn't caught on yet or are possibly waiting for a pullback. We certainly could see that but with the hurricane force winds of the Dollar behind it, I believe we are going to see higher prices. A pullback is certainly in order, but for now it is happy to maintain this somewhat steep rising bottoms trendline."
Full Disclosure: I own GLD long-term.
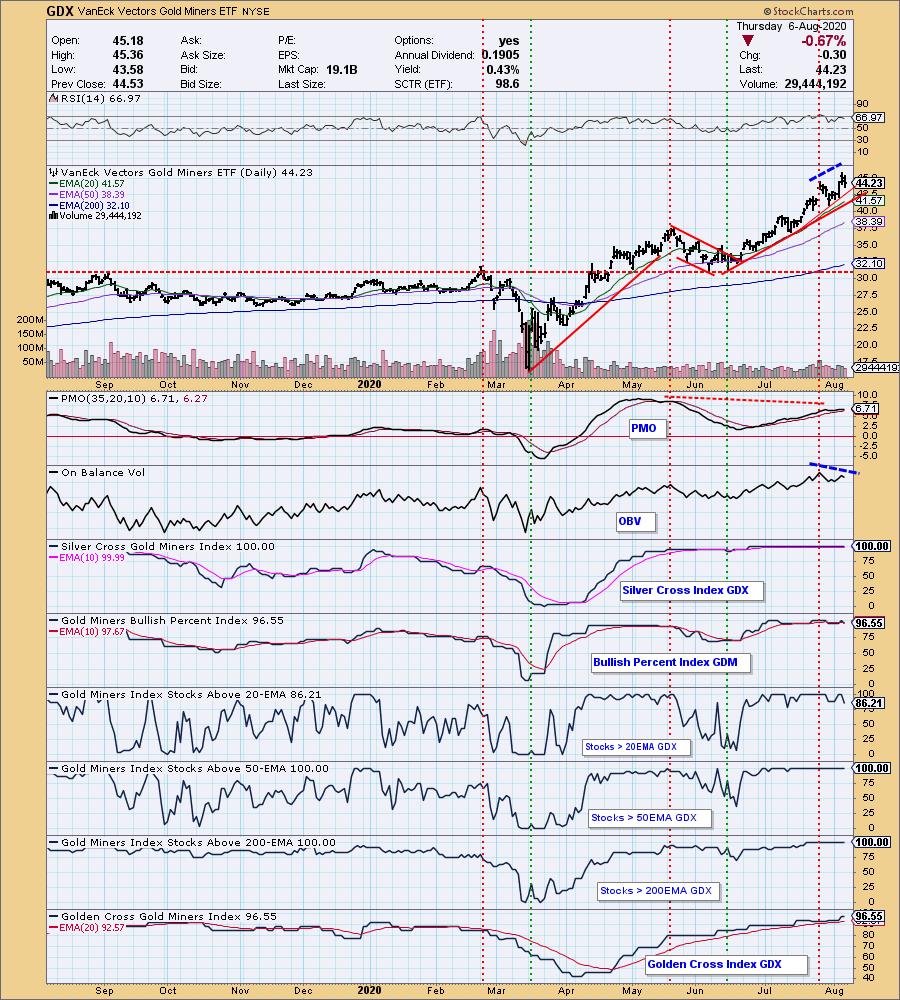
GOLD MINERS Golden and Silver Cross Indexes: I am very happy to see GDX pulling back toward the rising bottoms trendline. It needed some pressure released. The RSI is no longer overbought as well. There are a few minor concerns which would be the negative divergence between price and the OBV and seeing a little bit of deterioration on %Stocks above their 20-EMA. Miners may be losing some of their shine, but that rising trend is strong and there are plenty of participants that can keep it moving higher. It's just time for a breather.
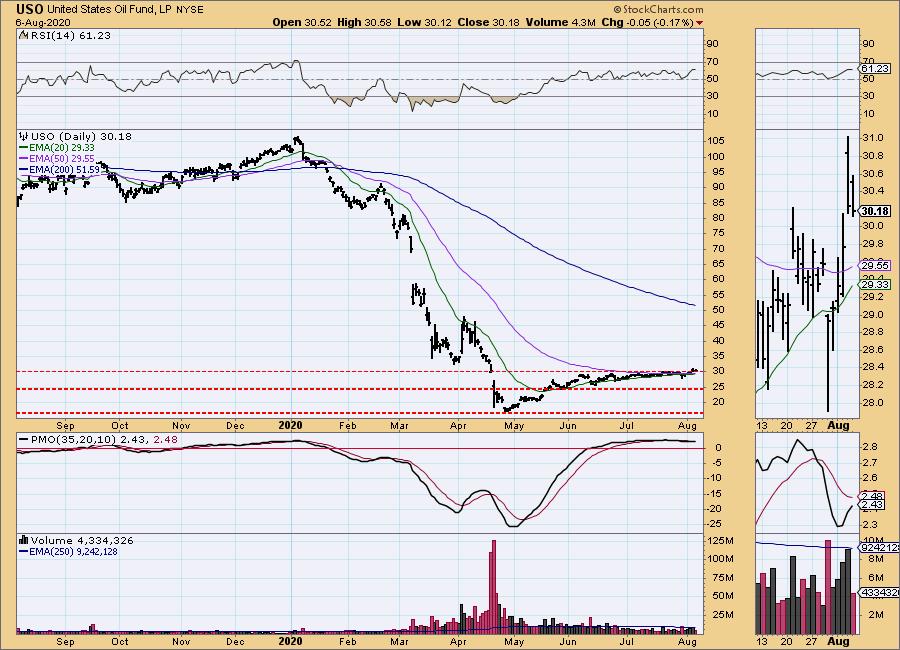
CRUDE OIL (USO)
IT Trend Model: NEUTRAL as of 1/27/2020
LT Trend Model: SELL as of 2/3/2020
USO Daily Chart: Nice breakout followed by a reactionary throw back to the breakout point. That is textbook and given the positive RSI and PMO, I would expect it to rise from here.
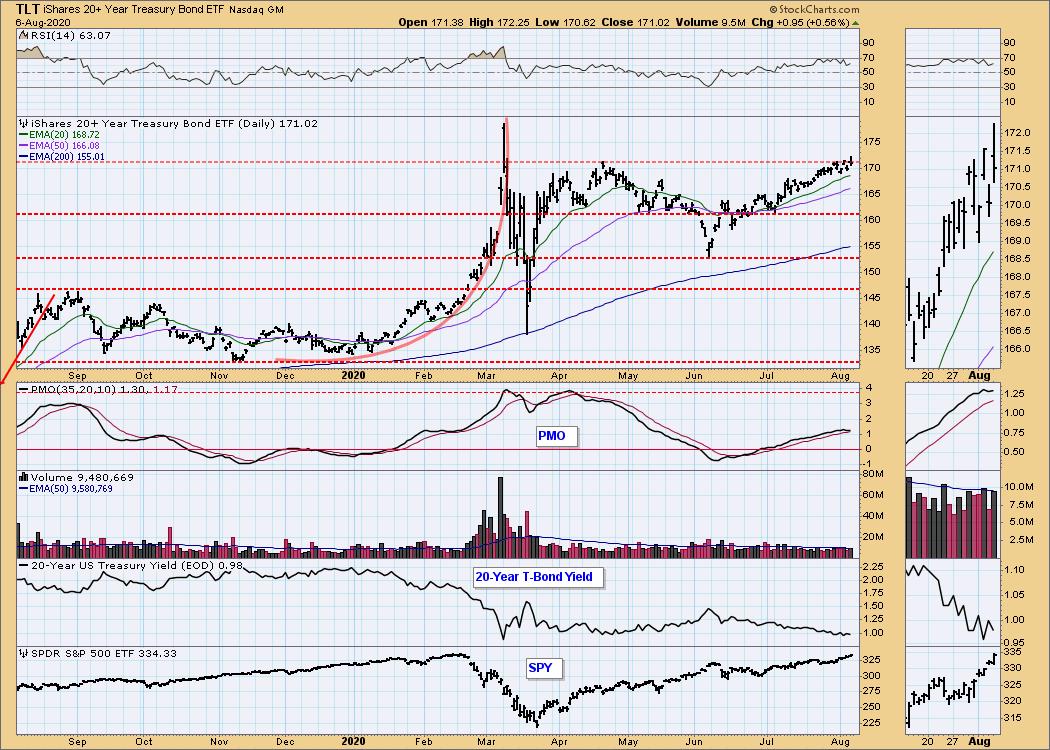
BONDS (TLT)
IT Trend Model: BUY as of 6/26/2020
LT Trend Model: BUY as of 1/2/2019
TLT Daily Chart: The rising trend remains intact, the RSI is positive and the PMO has turned back up. We don't have a decisive breakout yet (3%+) and as I said yesterday it is acting flaky. I like the indicators right now so I'm looking for a nice breakout here soon.
Full disclosure: I own TLT.
Have you subscribed the DecisionPoint Diamonds yet? DP does the work for you by providing handpicked stocks/ETFs from exclusive DP scans! Get in on the new "DecisionPoint Diamond Mine" trading room as part of that subscription! Contact support@decisionpoint.com for more information!
Technical Analysis is a windsock, not a crystal ball.
Happy Charting! - Erin
Email: erin@decisionpoint.com
ANNOUNCEMENT:
I have the information for my VIRTUALpresentation at The Money Show!
I present on August 19th at 1:20p EST!
Click here for information on how to register to see me!

NOTE: The signal status reported herein is based upon mechanical trading model signals, specifically, the DecisionPoint Trend Model. They define the implied bias of the price index based upon moving average relationships, but they do not necessarily call for a specific action. They are information flags that should prompt chart review. Further, they do not call for continuous buying or selling during the life of the signal. For example, a BUY signal will probably (but not necessarily) return the best results if action is taken soon after the signal is generated. Additional opportunities for buying may be found as price zigzags higher, but the trader must look for optimum entry points. Conversely, exit points to preserve gains (or minimize losses) may be evident before the model mechanically closes the signal.
Helpful DecisionPoint Links (Can Be Found on DecisionPoint.com Links Page):
DecisionPoint Shared ChartList and DecisionPoint Chart Gallery
Price Momentum Oscillator (PMO)