I promised during the DecisionPoint Show today that I would look at the Dollar v. Gold. Well in my haste reviewing all of the big names reporting earnings this week, it fell by the wayside. Consequently, I will give you the Dollar and Gold sections from today's subscriber-only DecisionPoint Alert.
DOLLAR (UUP)
IT Trend Model: NEUTRAL as of 5/28/2020
LT Trend Model: SELL as of 7/10/2020
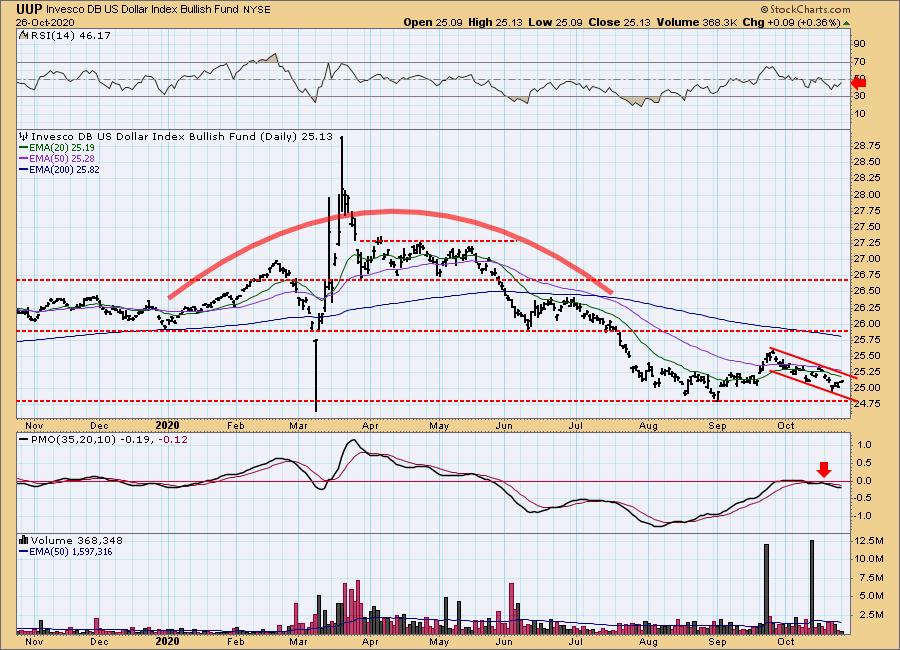
UUP Daily Chart: There is a defined declining trend channel. Currently price is making its way back toward the top of the channel where it will find resistance in the form of the 20/50-EMAs. The PMO is below zero and on a SELL signal, and the RSI remains in negative territory. I am looking for a test of $24.75 after it is likely will turn back down at EMA resistance.

Gold review is below:
It's FREE!

Click here to register in advance for the recurring free DecisionPoint Trading Room! Recordings are available!
Go to DecisionPoint.com and SUBSCRIBE TODAY!
GOLD
IT Trend Model: NEUTRAL as of 10/14/2020
LT Trend Model: BUY as of 1/8/2019
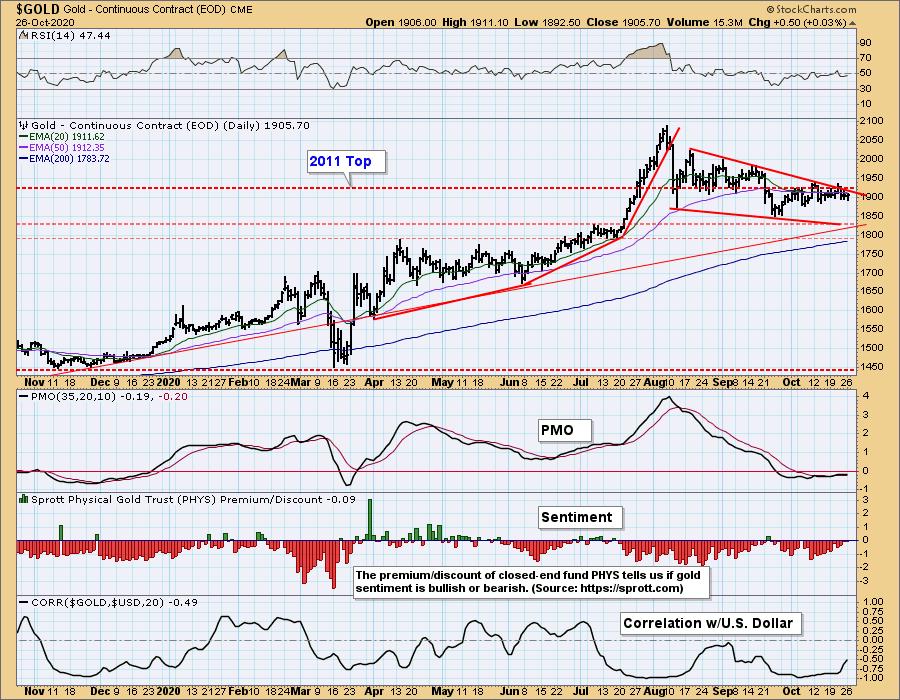
GOLD Daily Chart: Before I get into the price action on Gold, I want to point out the correlation between Gold and the Dollar. It is typical to see a -1.00 or reverse correlation between Gold and the Dollar. That correlation is moving toward zero. If it gets close to zero, that tells us there is no correlation, meaning they can travel together despite Gold being denominated in the Dollar. I expect the Dollar to decline and therefore, I should expect Gold to rise. When the correlation nears zero, that thinking doesn't work. Consequently, I am reviewing this chart not necessarily in the context of a declining Dollar, but based on its price action and sentiment.
The bullish falling wedge continues to be the dominant feature on the Gold chart. It looked like it might trigger last week as price briefly popped above the declining trendline that forms the top of the wedge. The PMO is clinging to a BUY signal and the RSI is negative to neutral. Dropping discounts suggests more interest in Gold so I'm expecting a breakout. This won't be easy given the convergence of the wedge's declining tops trendline, the 2011 top and 20/50-EMAs as all are acting as resistance. Certainly a declining Dollar could help here as the correlation is still quite negative at -0.49.
Full disclosure: I own GLD.

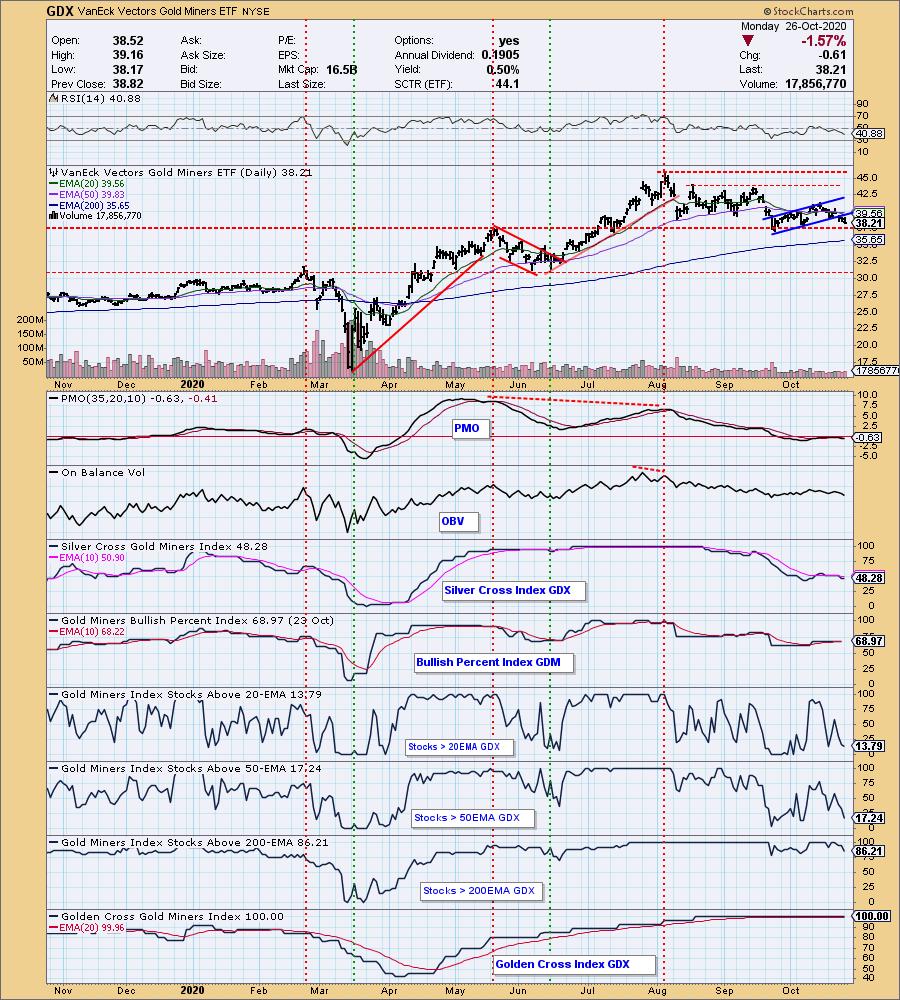
GOLD MINERS Golden and Silver Cross Indexes: After breaking down from the rising trend channel, I would expect to see GDX test the support level at the May top of $37.50. The indicators are dropping, but they are in oversold territory now. The GCI is still at 100% so despite the decline, all of the Miners in GDX have 50-EMAs above their 200-EMAs. This is the type of strength that will be needed to support a reversal.

I invite you to try out the DP Alert and DP Diamonds on DecisionPoint.com! If you subscribe to the Bundle and use the coupon code: dptrial, you will get a free week. And don't worry, you will be notified three days before the trial runs out so you can avoid being charged if you aren't satisfied. Remember that DP Diamonds members get a subscriber-only DecisionPoint "Diamond Mine" Trading Room too!
Happy Charting! - Erin
Technical Analysis is a windsock, not a crystal ball.
Helpful DecisionPoint Links:
DecisionPoint Alert Chart List
DecisionPoint Golden Cross/Silver Cross Index Chart List
DecisionPoint Sector Chart List
Price Momentum Oscillator (PMO)
Swenlin Trading Oscillators (STO-B and STO-V)
