
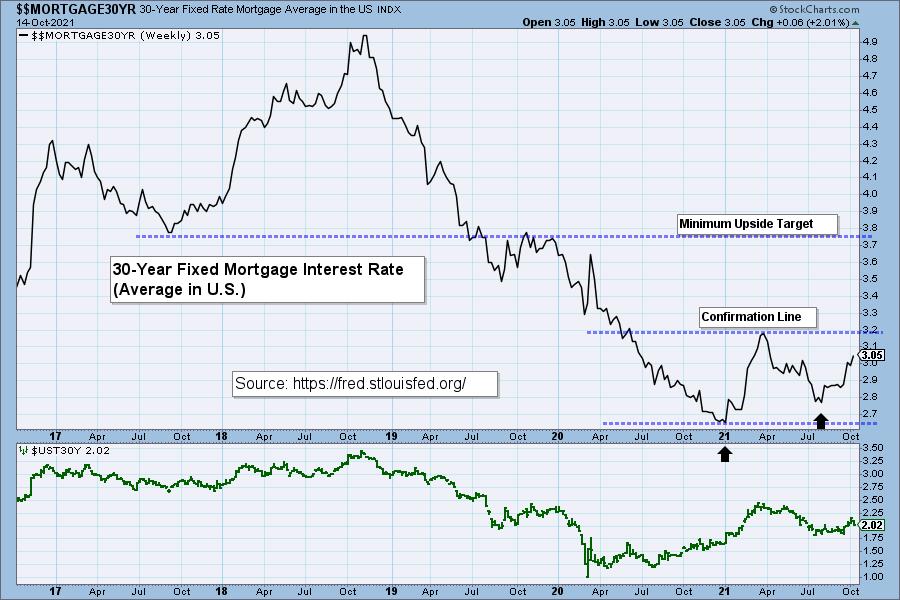
We want to watch the 30-Year Fixed Mortgage Interest Rate, because, for the most part, people buy homes based upon the maximum monthly payment they can afford. As rates rise, a fixed monthly payment will carry a smaller mortgage amount. (See table.) As mortgages are forced to shrink, real estate prices will have to fall, and many sellers will increasingly find that they are upside down with their mortgage.
Right now rates are rising quickly. Looking at the chart, we see a double-bottom forming. This tells us that rates could continue rising. If it moves above the confirmation line of the double-bottom (that confirms the pattern), the minimum upside target would take rates all the way to 3.75%. The pinch on home buyers will likely deflate and overinflated real estate market. Add this to inflation and other data points and life is about to get harder for home buyers and renters alike.

The DecisionPoint Alert Weekly Wrap presents an end-of-week assessment of the trend and condition of the Stock Market, the U.S. Dollar, Gold, Crude Oil, and Bonds. The DecisionPoint Alert daily report (Monday through Thursday) is abbreviated and gives updates on the Weekly Wrap assessments.
Watch the latest episode of DecisionPoint on StockCharts TV's YouTube channel here!
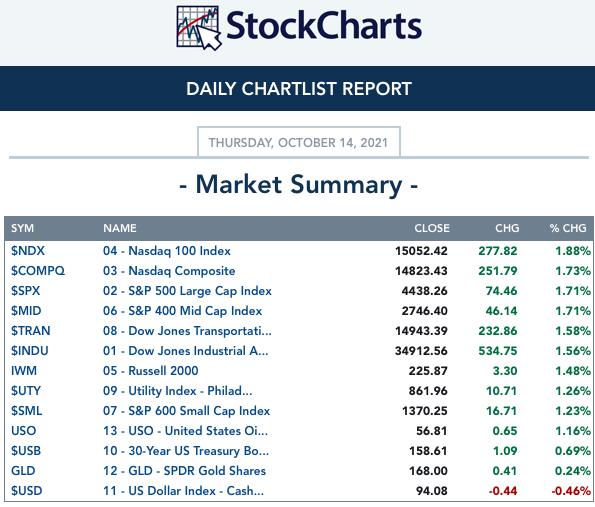
MAJOR MARKET INDEXES
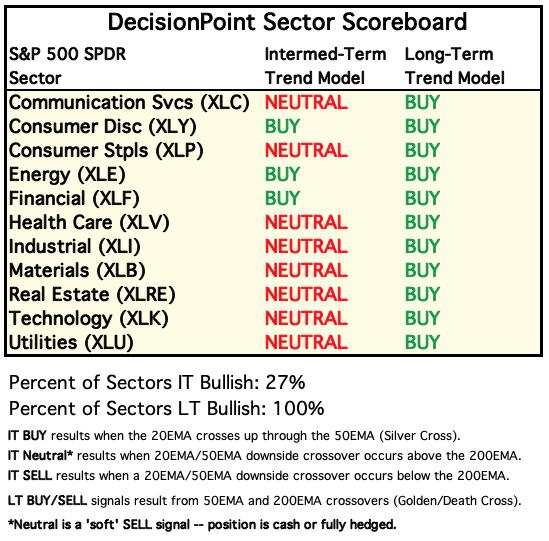
SECTORS
Each S&P 500 Index component stock is assigned to one, and only one, of 11 major sectors. This is a snapshot of the Intermediate-Term (Silver Cross) and Long-Term (Golden Cross) Trend Model signal status for those sectors.
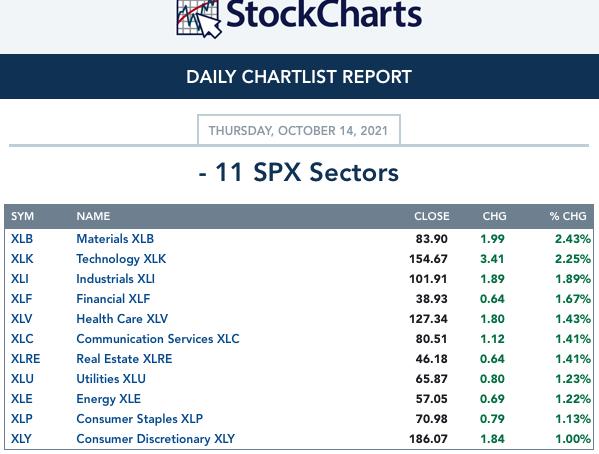
RRG® Chart: Rotation is getting messy as many of the sectors are directionless right now. Key takeaways: XLE, XLI and XLP are in Leading but are beginning to fade. XLB is now in Leading and has a very bullish northeast heading. XLRE is now in Improving while XLC, XLK, XLV and XLY can't decide where they want to be or where they want to go.
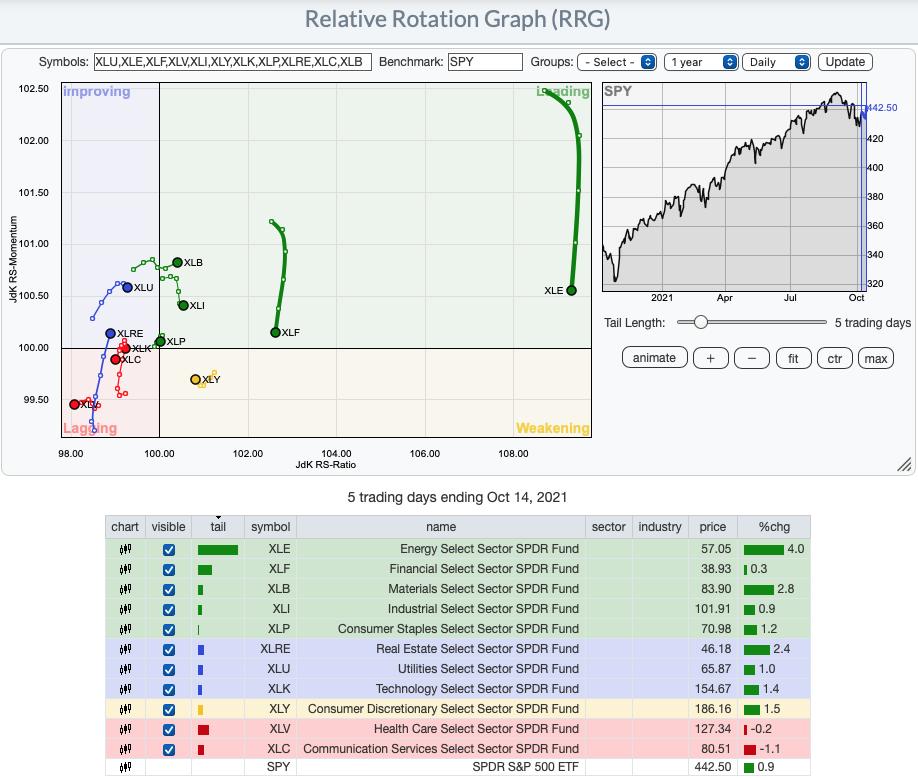
CLICK HERE for an animated version of the RRG chart.
CLICK HERE for Carl's annotated Sector charts.
THE MARKET (S&P 500)
IT Trend Model: BUY as of 5/8/2020
LT Trend Model: BUY as of 6/8/2020
SPY Daily Chart: We finally got the breakout from the bullish falling wedge. This is positive, as is price vaulting above the 20/50-EMAs. The PMO is about to give us a crossover BUY signal and the RSI is positive now.
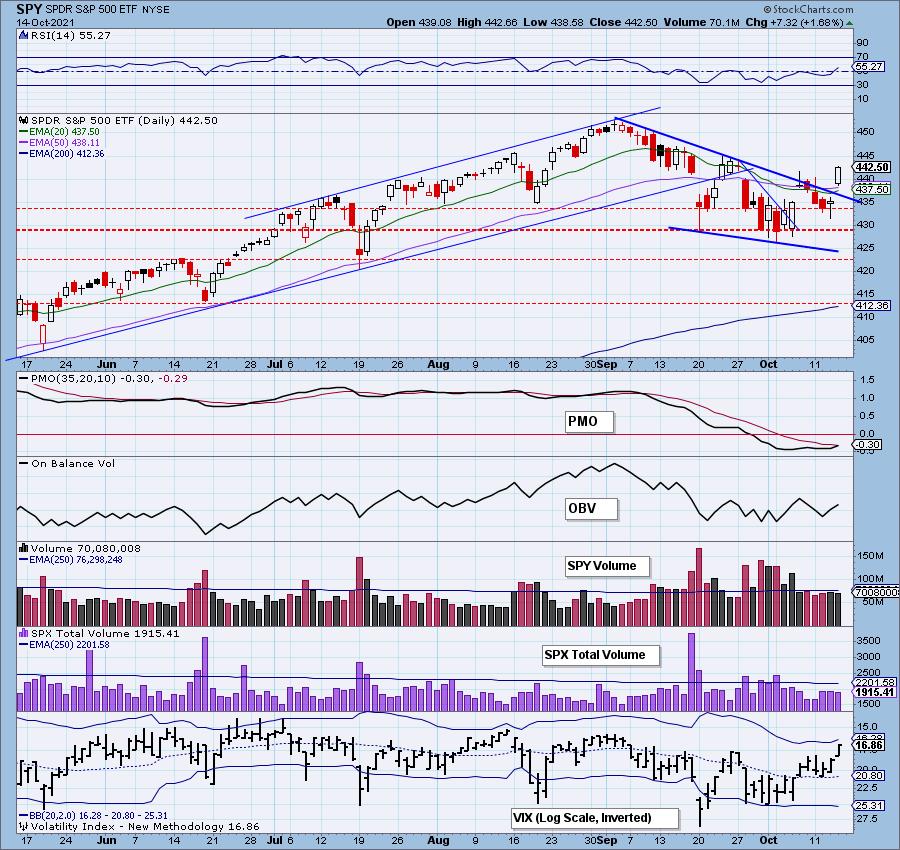
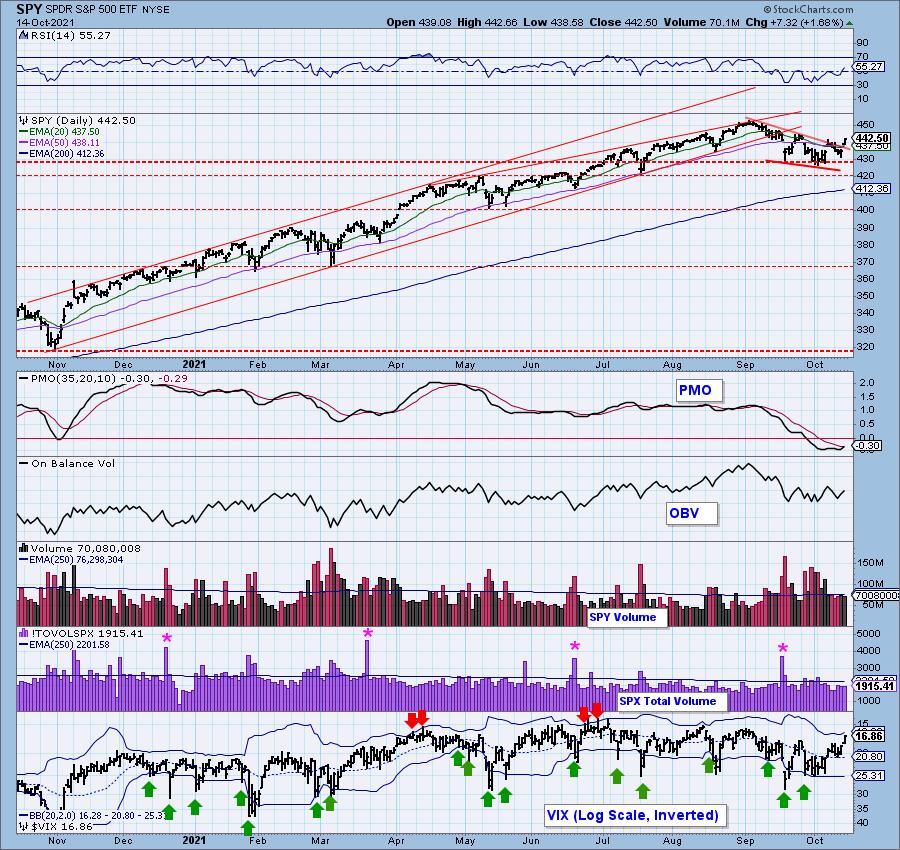
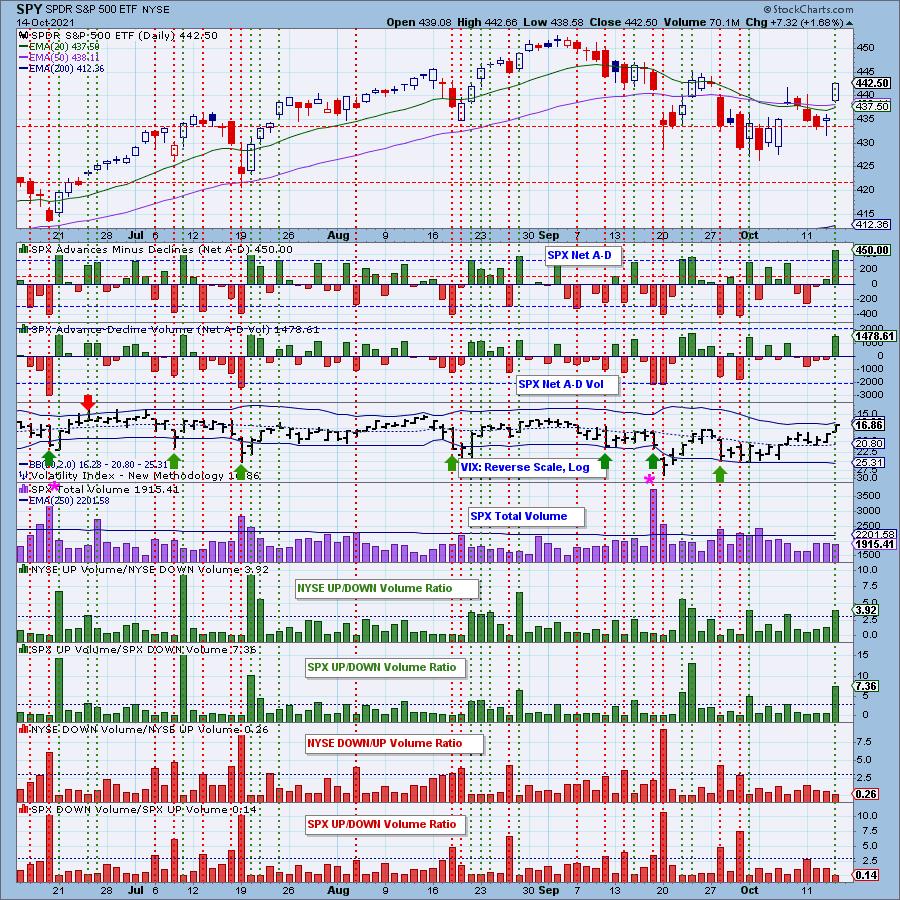
Total Volume was mostly unchanged and is not climactic. However, we did have an upside climax today that I will talk about when we get to that section.
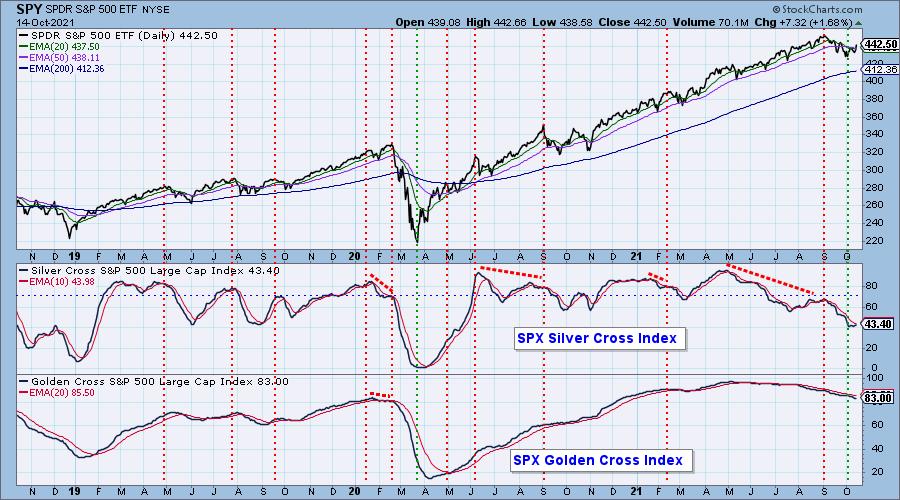
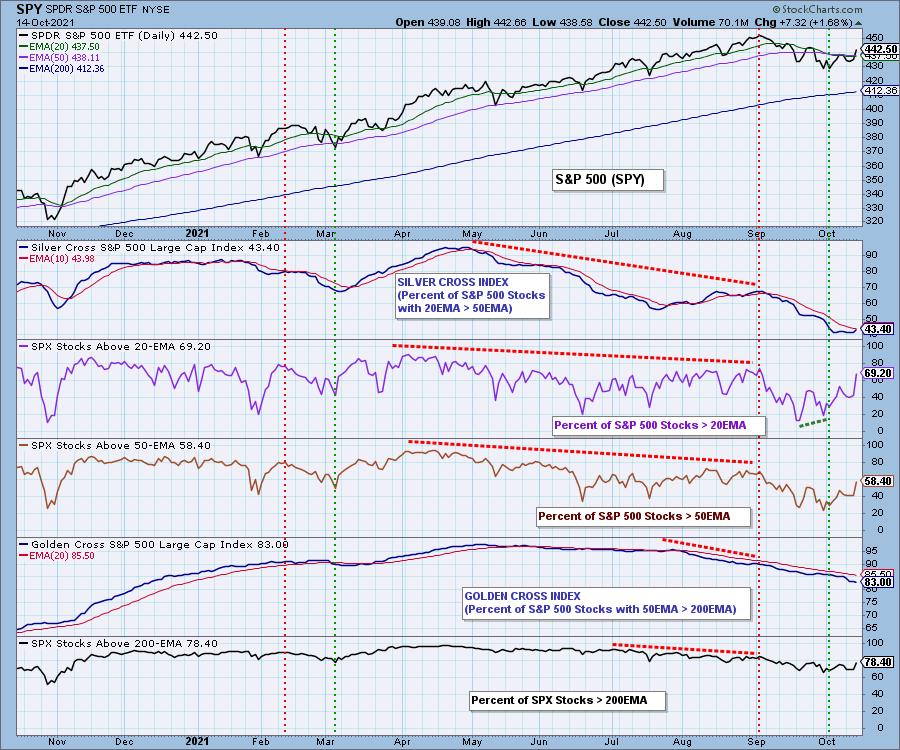
Participation: The following chart uses different methodologies for objectively showing the depth and trend of participation for intermediate- and long-term time frames.
- The Silver Cross Index (SCI) shows the percentage of SPX stocks on IT Trend Model BUY signals (20-EMA > 50-EMA).
- The Golden Cross Index (GCI) shows the percentage of SPX stocks on LT Trend Model BUY signals (50-EMA > 200-EMA).
- The Bullish Percent Index (BPI) shows the percentage of SPX stocks on Point & Figure BUY signals.
The SCI is rising again which is bullish. Meanwhile, the GCI continues to decline which leaves us concerned about the long term.
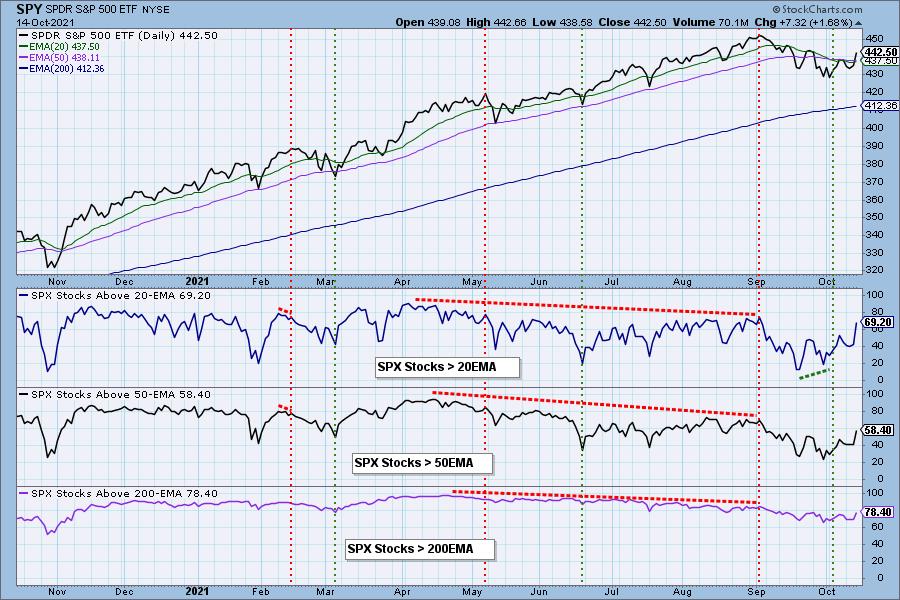
Participation spiked today on %Stocks > 20/50-EMAs. We also saw improvement on the %Stocks > 200-EMA. More stocks are participating, at least on the day.
Climax Analysis: Today we had a upside climax with Up/Down Volume Ratios moving above 3.00. Total volume didn't really confirm, but Net A-D did. Carl and I discussed whether it was an upside initiation or an upside exhaustion. Given the VIX is nearing the upper Bollinger Band on the inverted scale and we are eight days out of the market low, we are reading it as an exhaustion climax.
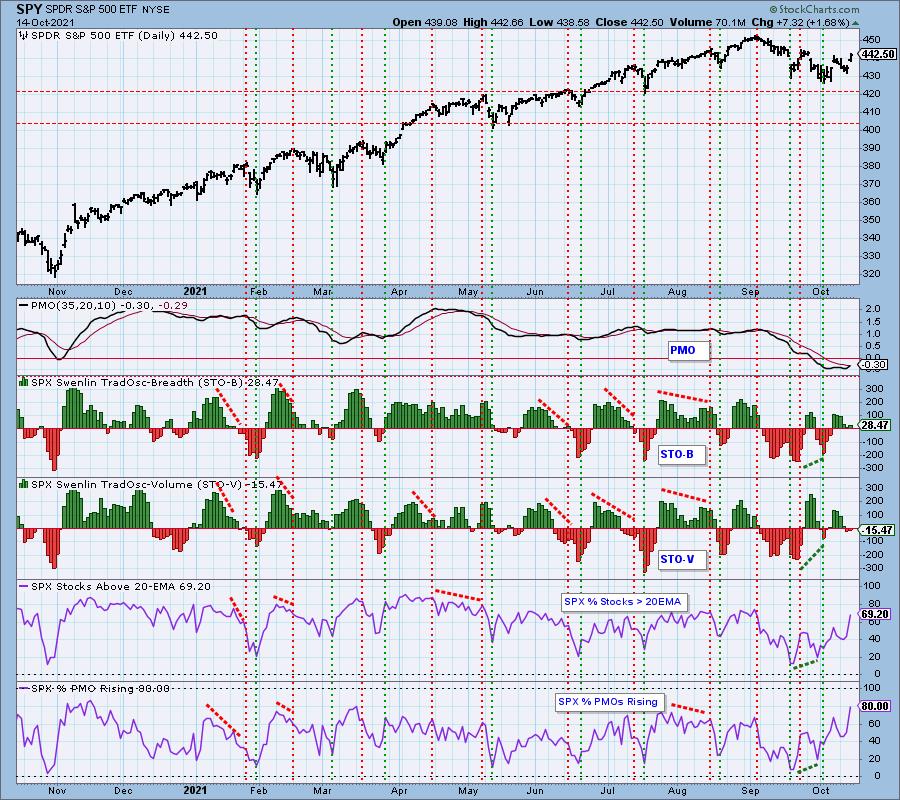
Short-Term Market Indicators: The short-term market trend is UP and the condition is NEUTRAL.
The STOs are rising again but they are in neutral territory, meaning they could swing in either direction moving forward. Not so helpful. However, 80% now have positive momentum in the SPX.
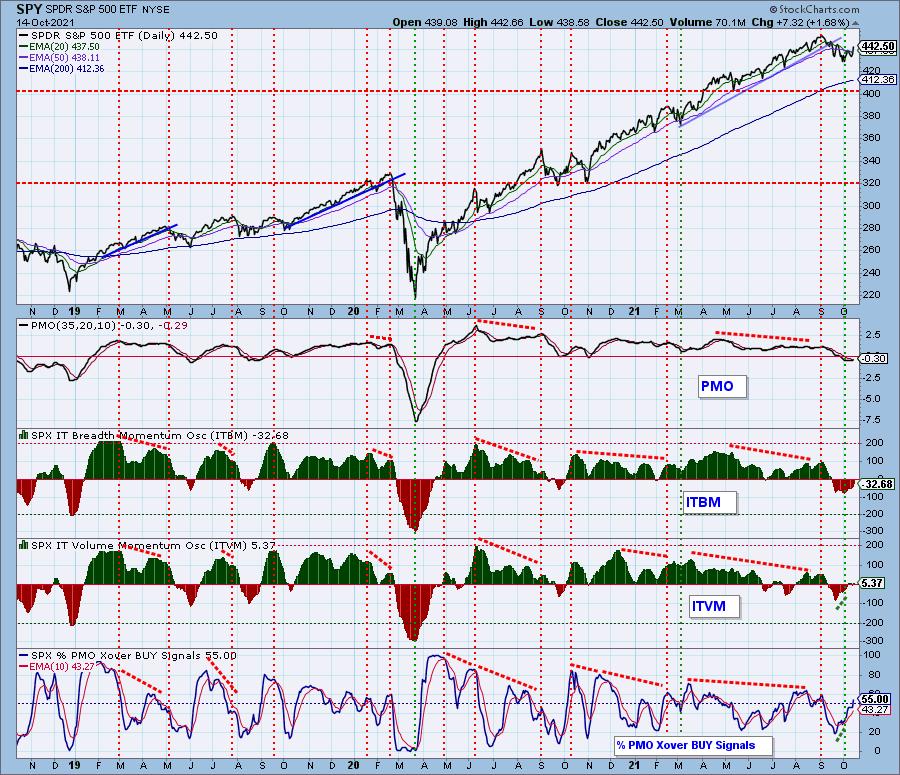
Intermediate-Term Market Indicators: The intermediate-term rising market trend is UP and the condition is NEUTRAL.
The IT indicators are mostly neutral now. The ITBM is rising, but the ITVM is undecided. It is positive that we now have more than half of the SPX with PMO BUY signals.
Bias Assessment: It occurred to us that one of the ways we can measure market bias is to compare the SCI to the percent of stocks above their 20/50-EMAs. When the percentages are lower than the SCI, the market bias is bearish and if they are higher, it is bullish. Any "mechanical" signal requires additional analysis to confirm the numbers.
The SCI reading is oversold, but given it is in the 40's, there is still an intermediate-term bearish bias. However, with participation in the short-term and intermediate-term spiking higher, the bias is bullish. Long-term we still see a slight bearish bias as the GCI moves lower and %Stocks > 200-EMA is lower than the GCI.
CONCLUSION: An upside exhaustion climax would suggest that the current move up will be curtailed in the next day or two. Given the impending PMO crossover BUY signal and improvement in participation of stocks with PMOs rising and on BUY signals, I'm not looking for a price collapse. More than likely the market needs a cooling off period after today's big gap up move.
I'm 70% exposed to the market as I added two positions today.
Have you subscribed the DecisionPoint Diamonds yet? DP does the work for you by providing handpicked stocks/ETFs from exclusive DP scans! Add it with a discount! Contact support@decisionpoint.com for more information!
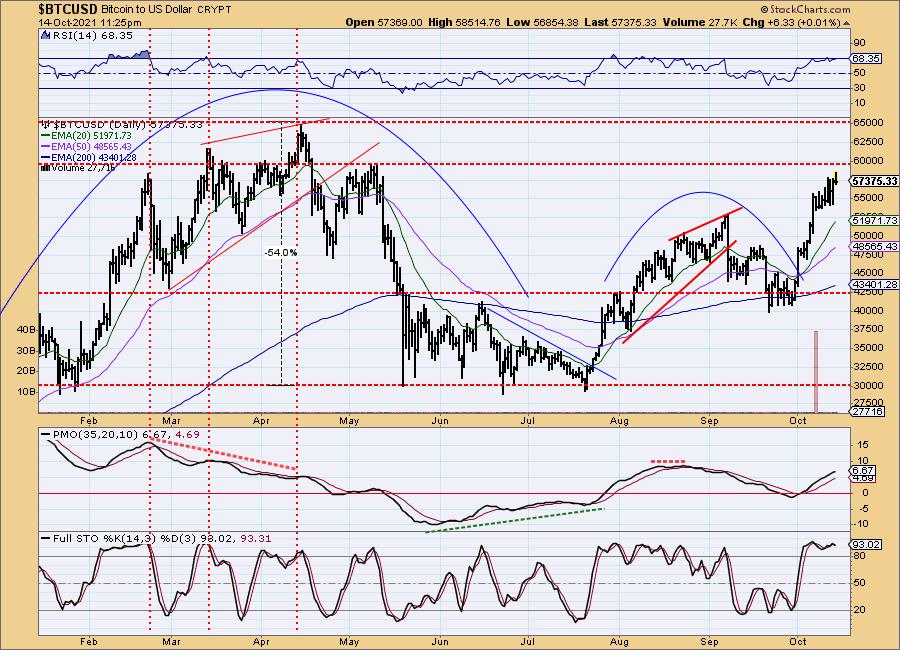
BITCOIN
Yesterday's comments still apply:
"Bitcoin is in a rising trend. The straight up rally is now being digested. The indicators are still looking strong as the PMO, RSI and Stochastics continue to rise. Overbought conditions are ahead and so is overhead resistance. Look for price to stall somewhat at overhead resistance, but given the positive indicators, I would expect a breakout above 60,000."
INTEREST RATES
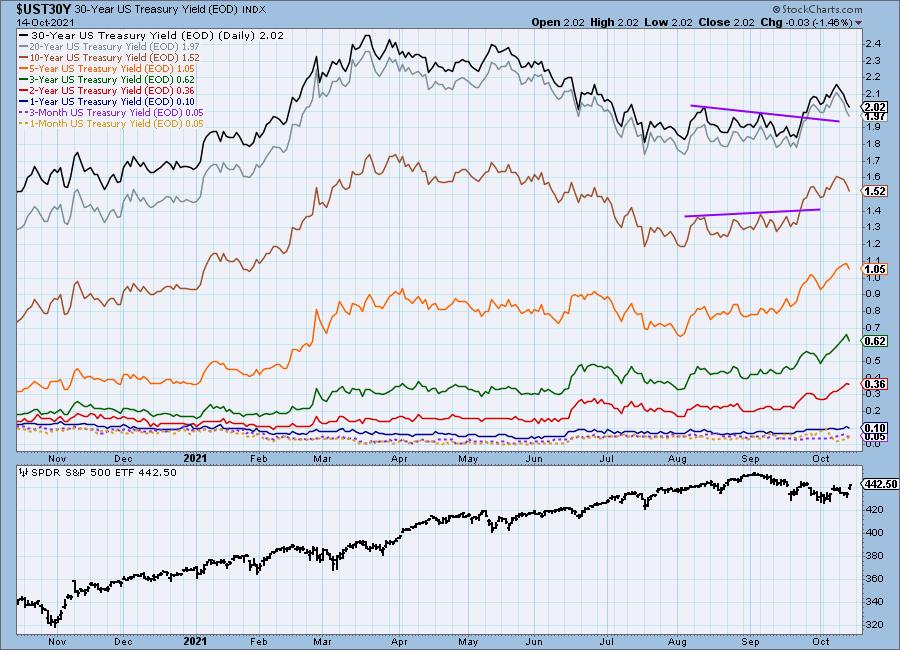
Rates continue to fall and now short-term rates are beginning to pull back as well.
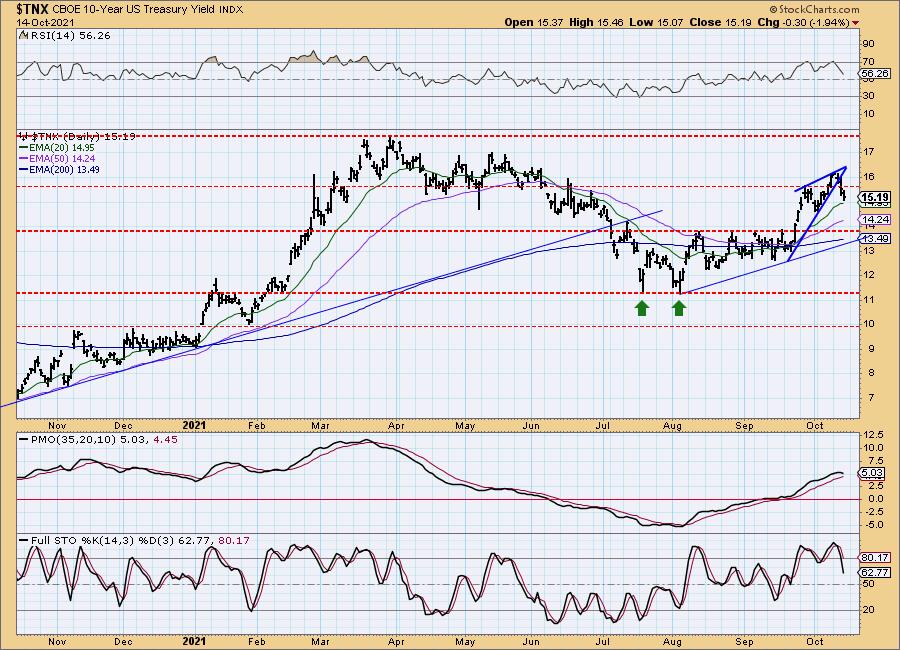
10-YEAR T-BOND YIELD
Yesterday's comments still apply:
"$TNX fell again today, dropping below support at the September top. This has brought the RSI out of overbought territory, but it has also caused the PMO to top. Additionally, the steep rising trendline was broken. We had a bearish rising wedge form so this seems a natural reaction. We would look for them to drop to support at 1.45."
DOLLAR (UUP)
IT Trend Model: BUY as of 6/22/2021
LT Trend Model: BUY as of 8/19/2021
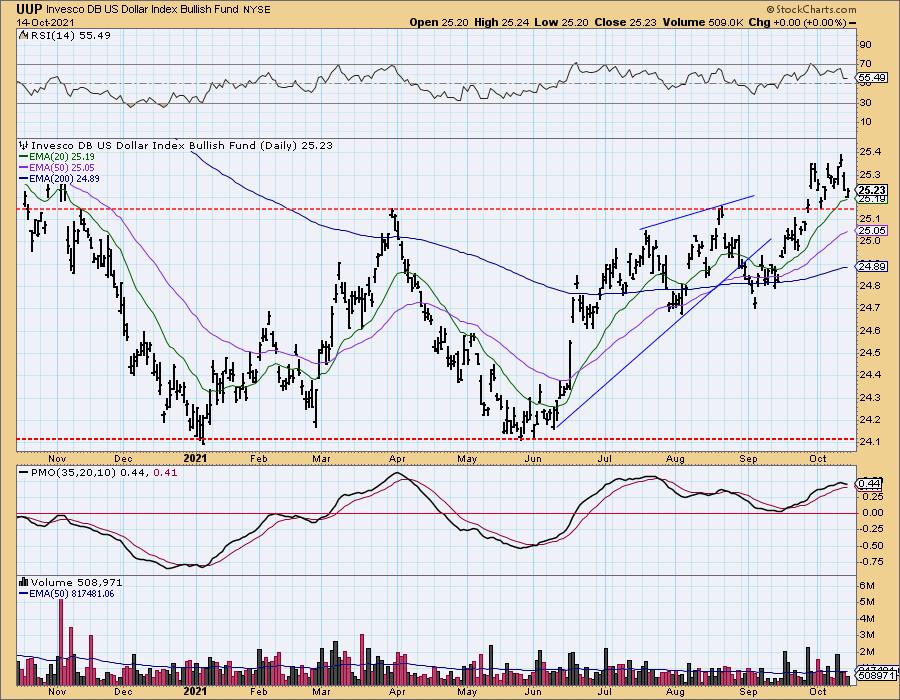
UUP Daily Chart: UUP rose but set a lower low and a lower high. Support held at the 20-EMA and the August top.
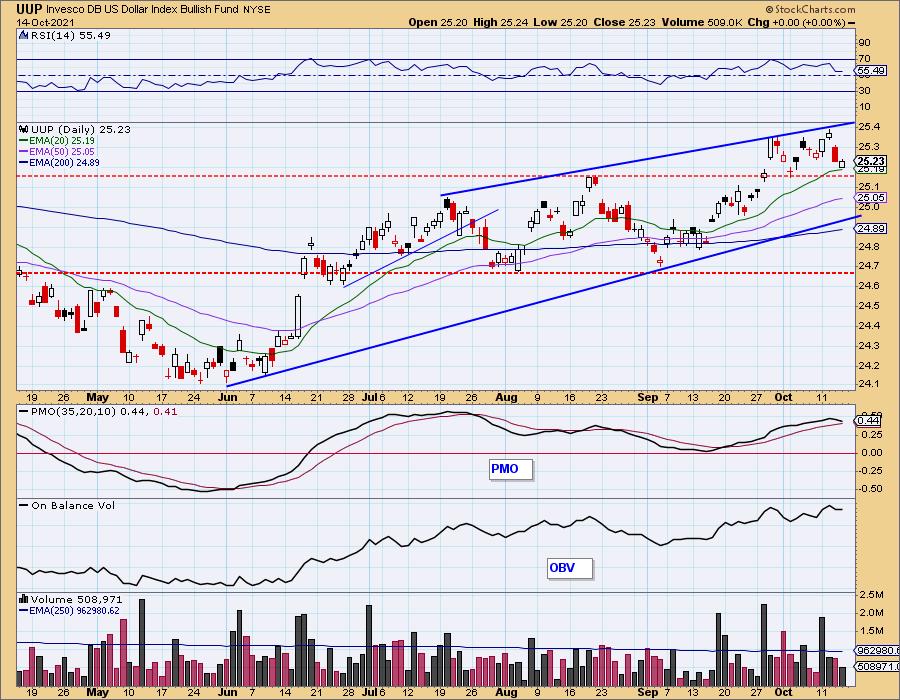
We are now looking at a possible double-top formation. The PMO has topped, but the RSI remains positive. Support is in jeopardy.
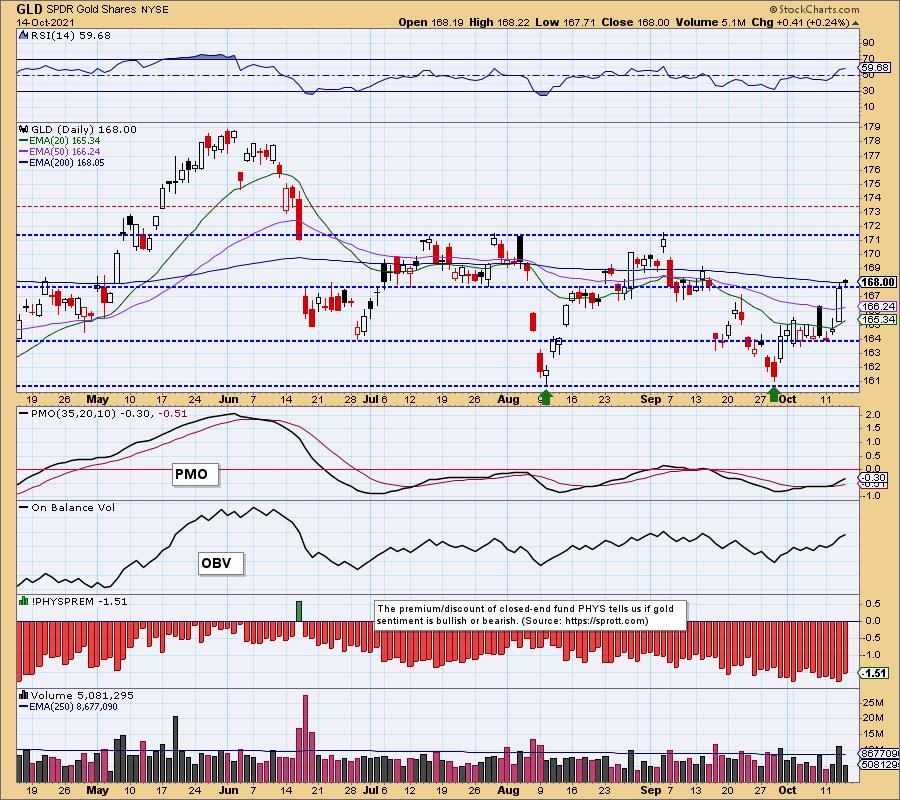
GOLD
IT Trend Model: NEUTRAL as of 6/24/2021
LT Trend Model: SELL as of 8/9/2021
GLD Daily Chart: GLD continued higher and nearly closed above the 200-EMA. We've spotted a bullish double-bottom on GLD. Given the positive RSI and rising PMO on a BUY signal, I remain bullish on Gold.
(Full disclosure: I own GLD as a long-term buy and hold position.)
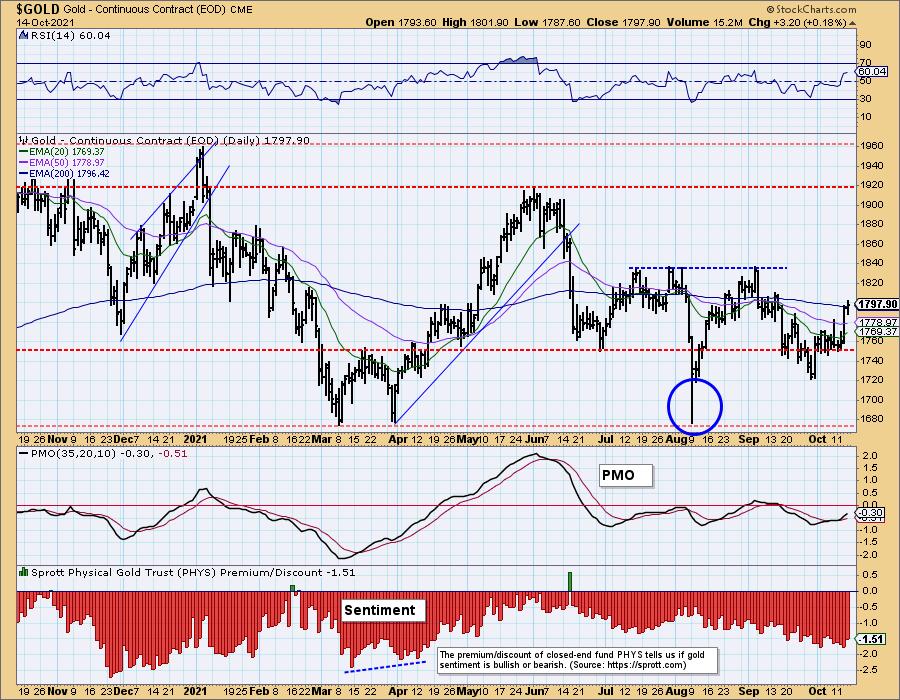
GOLD Daily Chart: Whereas the GLD daily chart above shows a double bottom, the daily chart of $GOLD shows a down spike where the first bottom should be. The reason is that $GOLD is based upon futures trading, which also trade outside the trading hours of the ETF. Unfortunately, this throws some shade on the double bottom interpretation, but strictly speaking, GLD is a different security, so the double bottom is still valid.
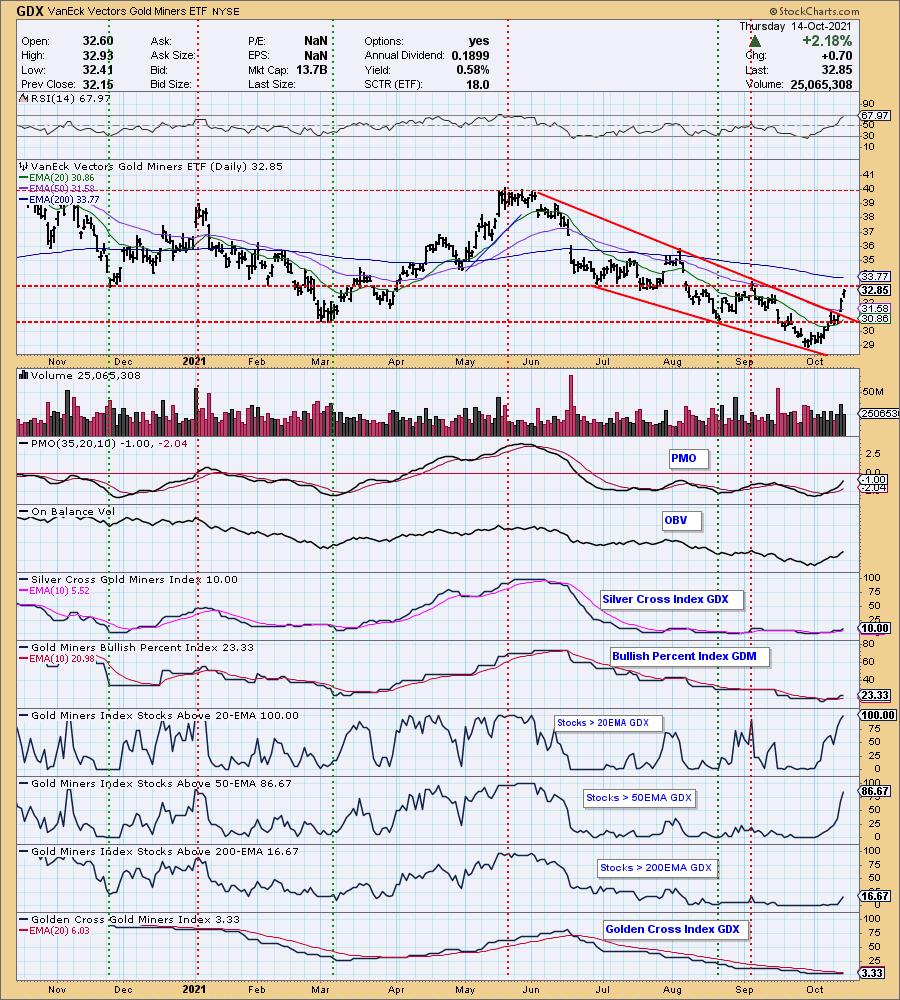
GOLD MINERS Golden and Silver Cross Indexes: Gold Miners will be tested soon as price is nearing the November low and 200-EMA. Indicators are still very positive so we expect a breakout.
CRUDE OIL (USO)
IT Trend Model: BUY as of 9/7/2021
LT Trend Model: BUY as of 3/9/2021
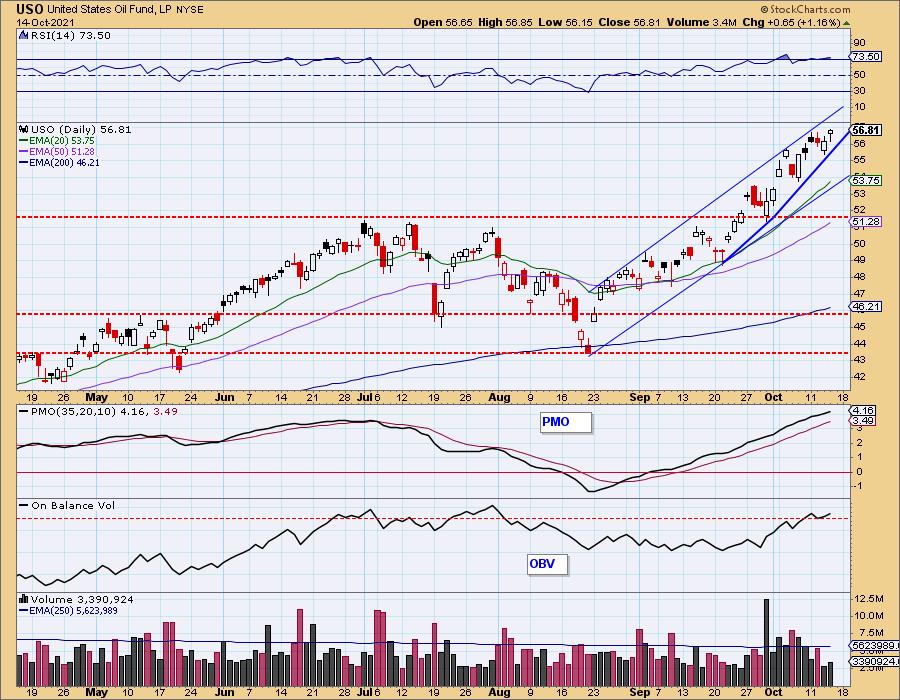
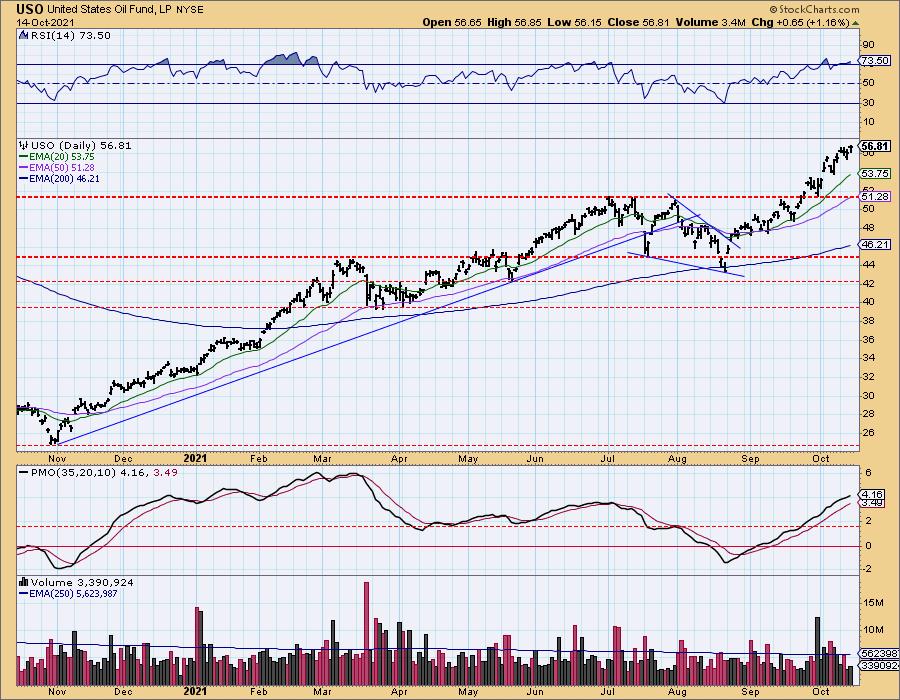
USO Daily Chart: USO rallied strongly today, but it is now in a bearish rising wedge. The RSI is overbought. The PMO is still rising and is in near-term overbought territory. However, until we see this rising trend broken, we remain bullish on Crude Oil.
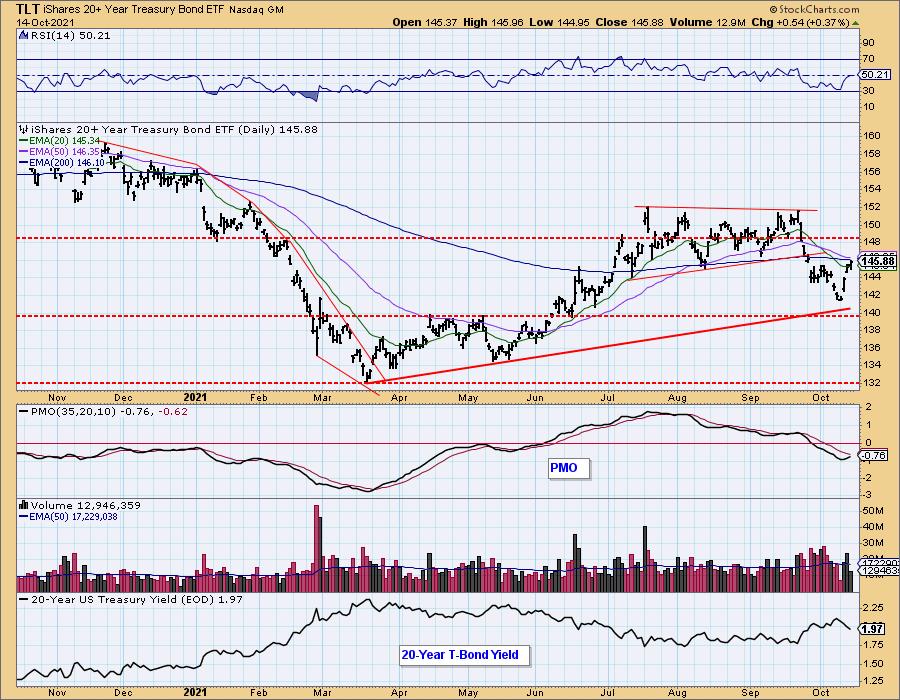
BONDS (TLT)
IT Trend Model: BUY as of 6/10/2021
LT Trend Model: BUY as of 8/10/2021
TLT Daily Chart: Yesterday's comments still apply:
"TLT continued to rally as the 20-year yield moved lower again today. Now it is up against resistance at the 20-EMA and August low. The RSI and PMO are rising, but both are in negative territory. The 20-year yield could continue lower, but I note that there is support around 1.9%."
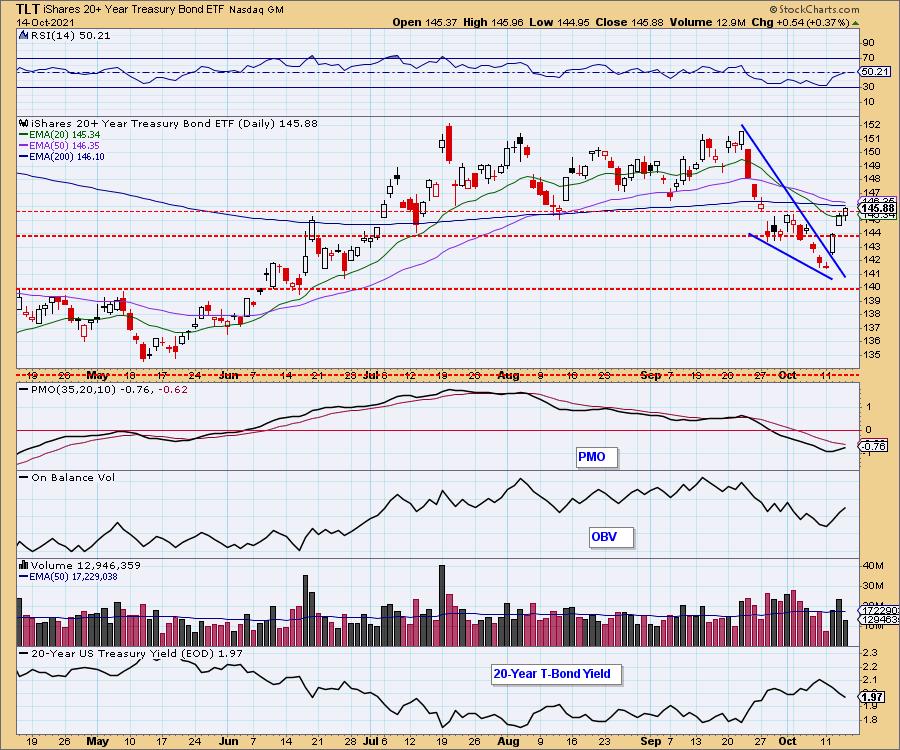
"This rebound is arriving along the rising bottoms trendline drawn from the March low. We should see price rise a bit more, but I suspect it will get caught up on resistance at the 50-EMA. If price does not get above the 200-EMA, a LT Trend Model "Death Cross" SELL signal will materialize."
Technical Analysis is a windsock, not a crystal ball.
--Erin Swenlin
(c) Copyright 2021 DecisionPoint.com
Disclaimer: This blog is for educational purposes only and should not be construed as financial advice. The ideas and strategies should never be used without first assessing your own personal and financial situation, or without consulting a financial professional. Any opinions expressed herein are solely those of the author, and do not in any way represent the views or opinions of any other person or entity.
NOTE: The signal status reported herein is based upon mechanical trading model signals, specifically, the DecisionPoint Trend Model. They define the implied bias of the price index based upon moving average relationships, but they do not necessarily call for a specific action. They are information flags that should prompt chart review. Further, they do not call for continuous buying or selling during the life of the signal. For example, a BUY signal will probably (but not necessarily) return the best results if action is taken soon after the signal is generated. Additional opportunities for buying may be found as price zigzags higher, but the trader must look for optimum entry points. Conversely, exit points to preserve gains (or minimize losses) may be evident before the model mechanically closes the signal.
Helpful DecisionPoint Links:
DecisionPoint Alert Chart List
DecisionPoint Golden Cross/Silver Cross Index Chart List
DecisionPoint Sector Chart List
Price Momentum Oscillator (PMO)
Swenlin Trading Oscillators (STO-B and STO-V)
DecisionPoint is not a registered investment advisor. Investment and trading decisions are solely your responsibility. DecisionPoint newsletters, blogs or website materials should NOT be interpreted as a recommendation or solicitation to buy or sell any security or to take any specific action.