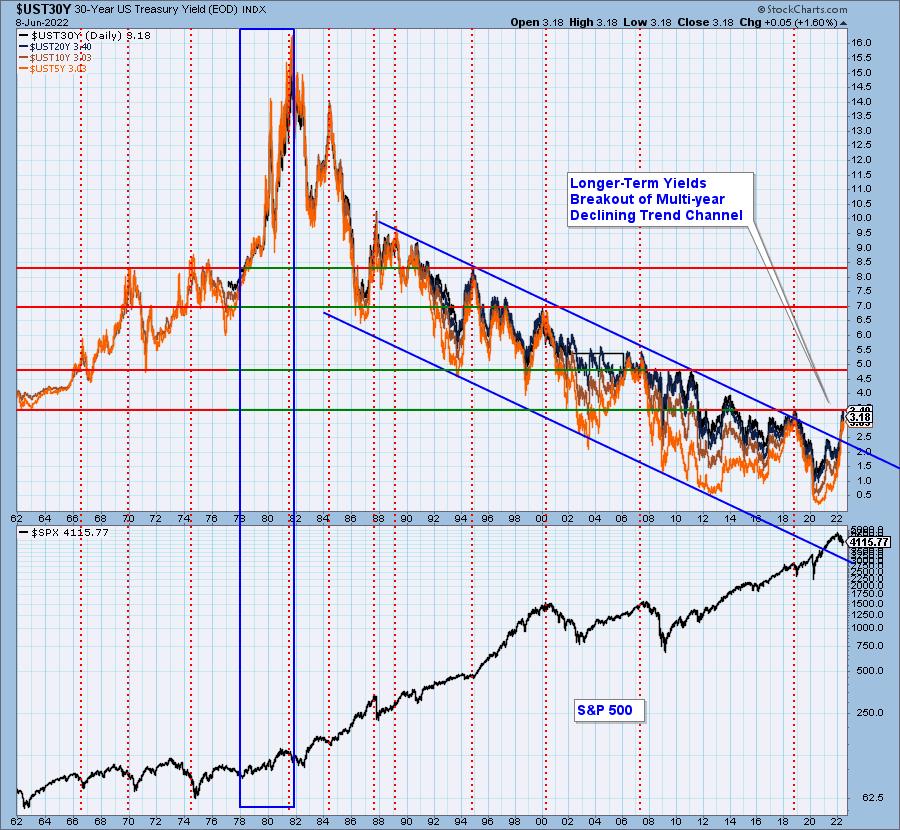
It's been trending on social media that it is time for yields to top. One of the charts in the DPA ChartList (available to subscribers of DecisionPoint.com Blogs) is a long-term yield chart. The chart in the ChartList includes 1-yr yield on up to the 30-year yield, but we've trimmed it down to the 5/10/20/30-year yields.
Looking at the chart below, it is hard to imagine we are going to see a major top in yields. Yes, they are up against overhead resistance from 2019, but this strong breakout from a declining trend channel that has been in place since the 1990's is troublesome. Most importantly, we would point you to the period between 1978 and 1981, where the economy was experiencing many of the same problems we have now -- high inflation, high oil prices, housing prices soaring higher, etc. We're not saying that we will see yields move up to 16%, but what is occurring today is not an historic precedent.

Conclusion: We don't want to be "Debbie Downers", but we have to consider that rates could move much higher, given the technical breakout and an economy that shares characteristics with the economy of 1979-1981. That period saw an unprecedented rise in yields.
Good Luck & Good Trading,
Erin Swenlin

Click here to register in advance for the recurring free DecisionPoint Trading Room! Recordings are available!
Technical Analysis is a windsock, not a crystal ball. --Carl Swenlin
(c) Copyright 2022 DecisionPoint.com
Helpful DecisionPoint Links:
DecisionPoint Alert Chart List
DecisionPoint Golden Cross/Silver Cross Index Chart List
DecisionPoint Sector Chart List
Price Momentum Oscillator (PMO)
Swenlin Trading Oscillators (STO-B and STO-V)
DecisionPoint is not a registered investment advisor. Investment and trading decisions are solely your responsibility. DecisionPoint newsletters, blogs or website materials should NOT be interpreted as a recommendation or solicitation to buy or sell any security or to take any specific action.