
Trading has been volatile which is an understatement right now. The markets were showing some signs of a rally early in trading, but then President Trump shook things up. He posted on Truth Social that there would be a 90-day pause in reciprocal tariffs and a whopping 125% tariff on China after they retaliated. The pause was welcomed by Wall Street and the buying frenzy began. It was the biggest amount of buying in one day that we've seen since 2008.
The DecisionPoint Alert Weekly Wrap presents an end-of-week assessment of the trend and condition of the Stock Market, the U.S. Dollar, Gold, Crude Oil, and Bonds. The DecisionPoint Alert daily report (Monday through Thursday) is abbreviated and gives updates on the Weekly Wrap assessments.
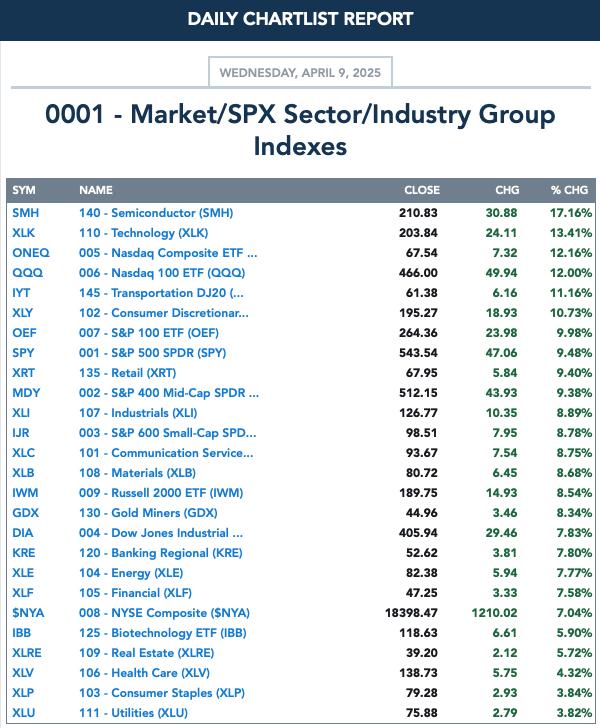
MARKET/INDUSTRY GROUP/SECTOR INDEXES
CLICK HERE for Carl's annotated Market Index, Sector, and Industry Group charts.
THE MARKET (S&P 500)
IT Trend Model: NEUTRAL as of 3/4/2025
LT Trend Model: BUY as of 3/29/2023
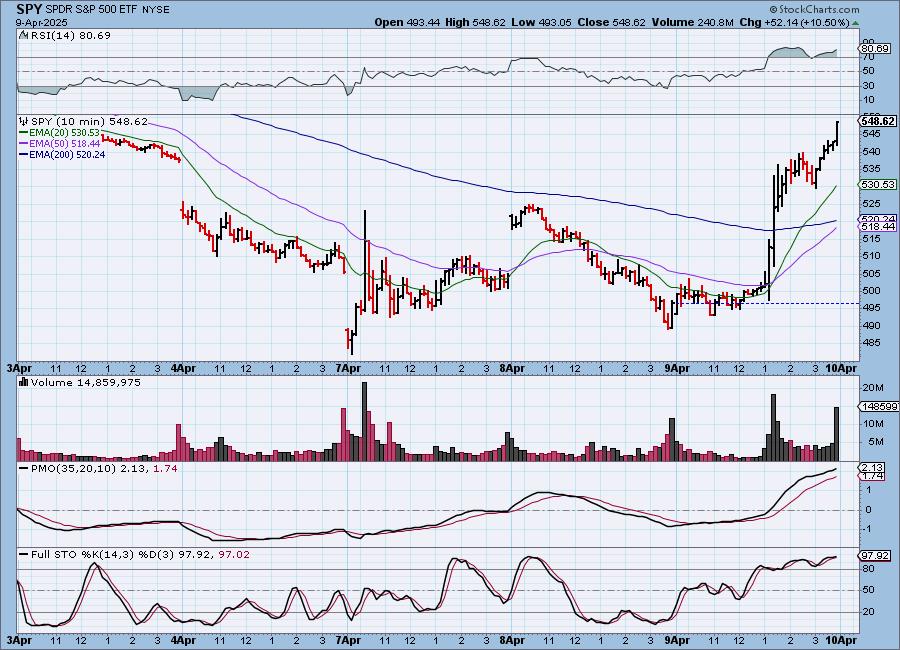
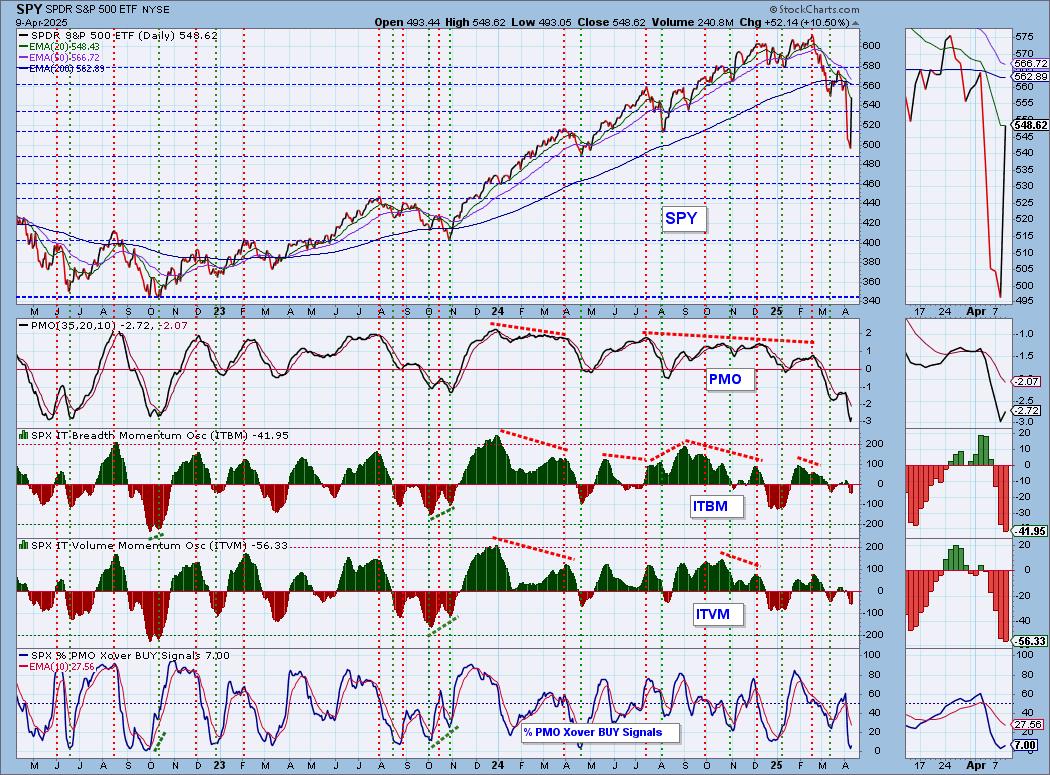
SPY Daily Chart: Today we saw a giant bullish engulfing candlestick on the SPY. Price is ready to test the top of the declining trend channel. The RSI is no longer oversold, nor is it overbought. The PMO turned back up.
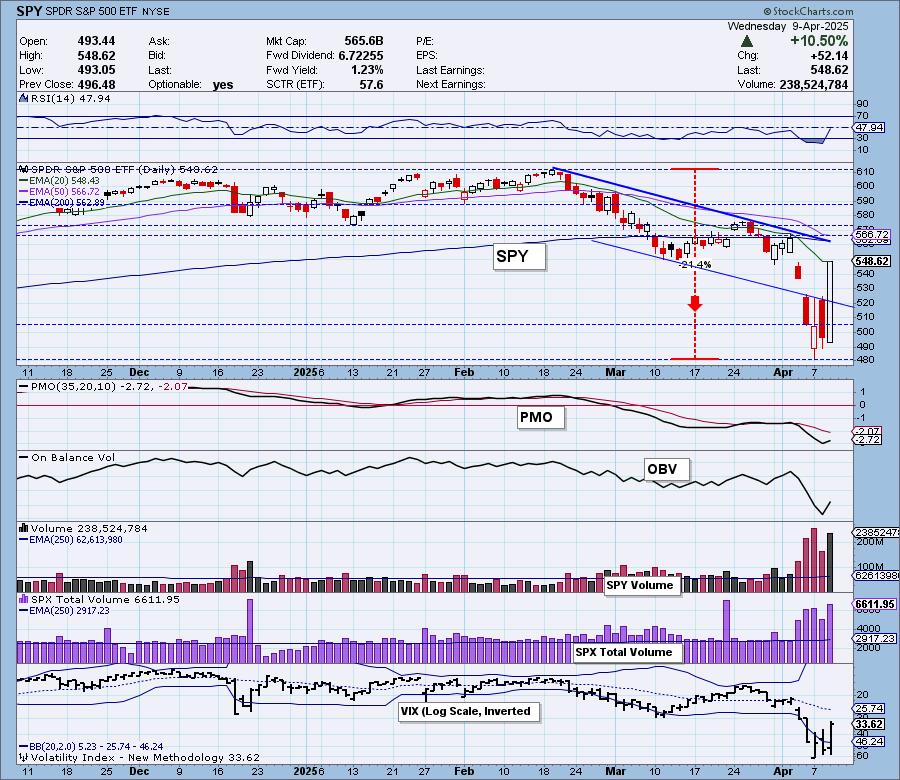
The VIX is still below its moving average on the inverted scale but it saw relief today as readings sailed lower. Stochastics are rising again. Notice that the mega-caps really turned it on today as the SPY clearly outperformed equal-weight RSP. When these guys are rallying, the market rallies with them.
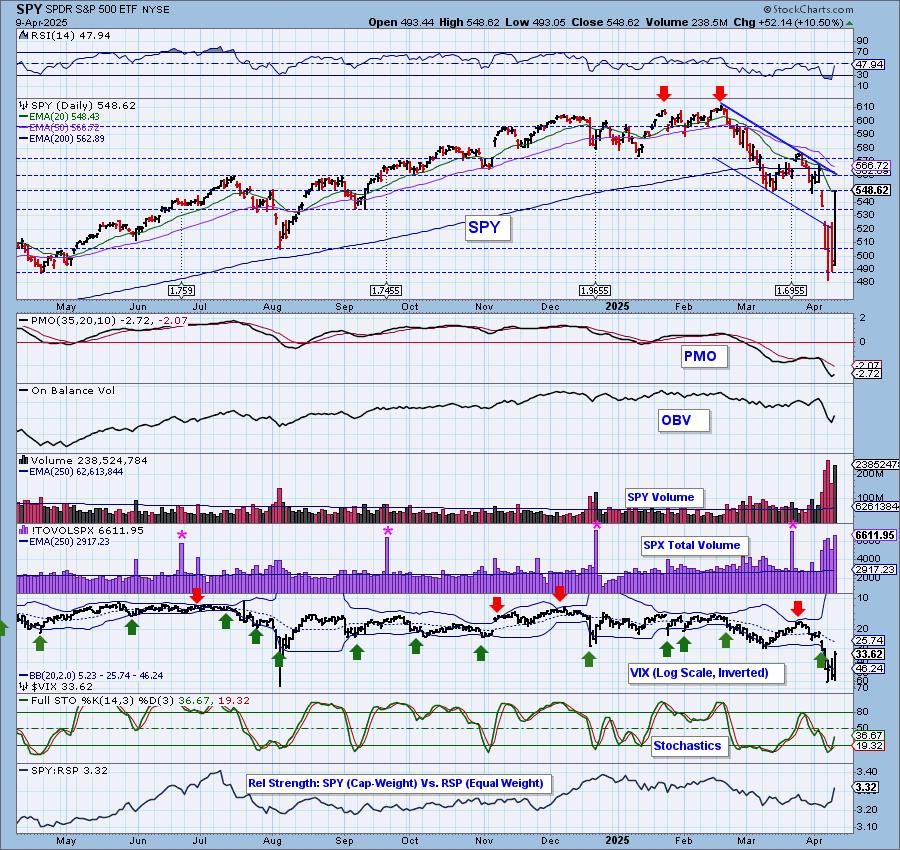
S&P 500 New 52-Week Highs/Lows: We did see one New High, but New Lows were still prevalent. The High-Low Differential is at its lowest reading since 2022. It is oversold.
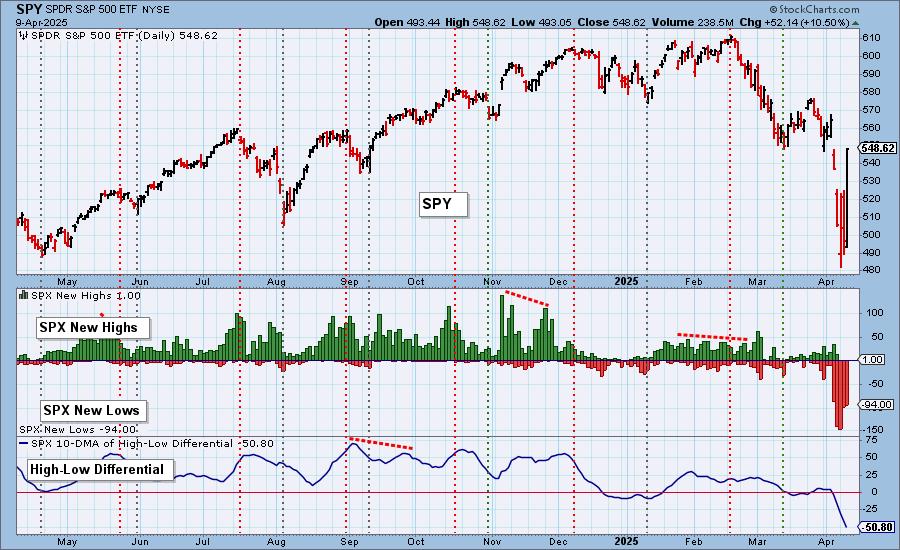
Climax* Analysis: There were unanimous and strong climax readings today on the four relevant indicators, giving us an upside initiation climax. SPX Total Volume was 227% of the one-year daily average volume, which confirms the climax day but also implies a blowoff. We think it is unlikely that there was a blowoff today, just enthusiasm. Of note is the NYSE UP/DOWN Volume Ratio -- it is about three times higher than the previous highest reading. This is really a strong indication that the rally will persist.
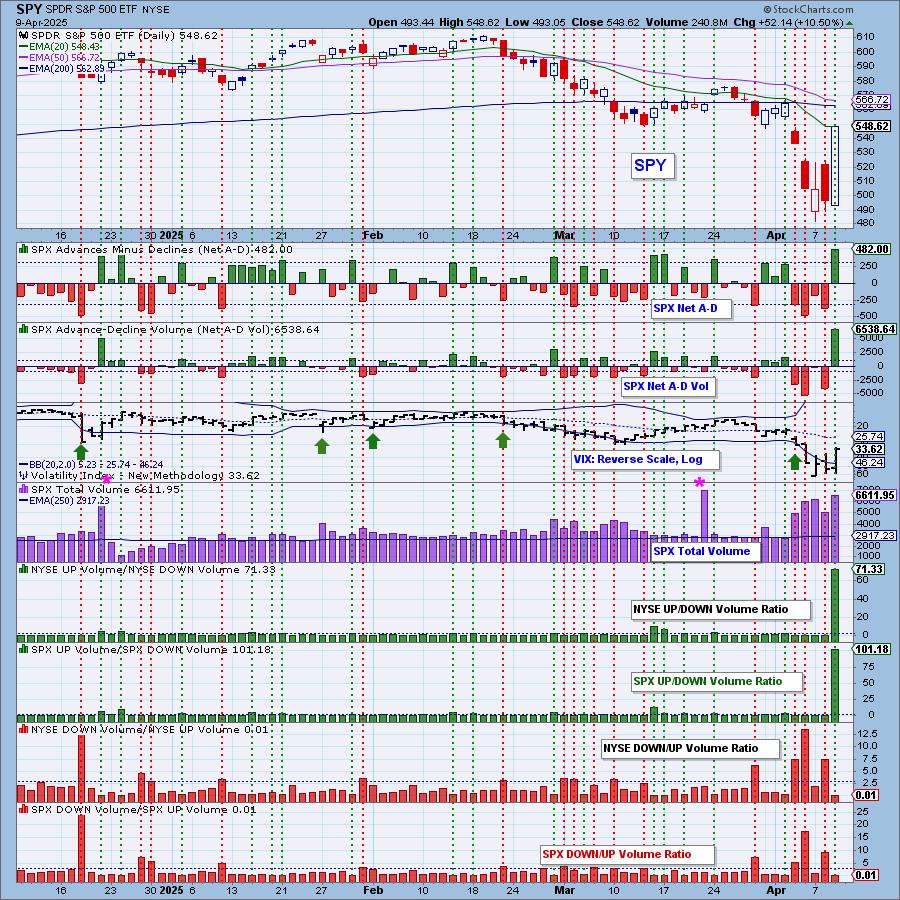
*A climax is a one-day event when market action generates very high readings in, primarily, breadth and volume indicators. We also include the VIX, watching for it to penetrate outside the Bollinger Band envelope. The vertical dotted lines mark climax days -- red for downside climaxes, and green for upside. Climaxes are at their core exhaustion events; however, at price pivots they may be initiating a change of trend.
Short-Term Market Indicators: The short-term market trend is DOWN and the condition is OVERSOLD.
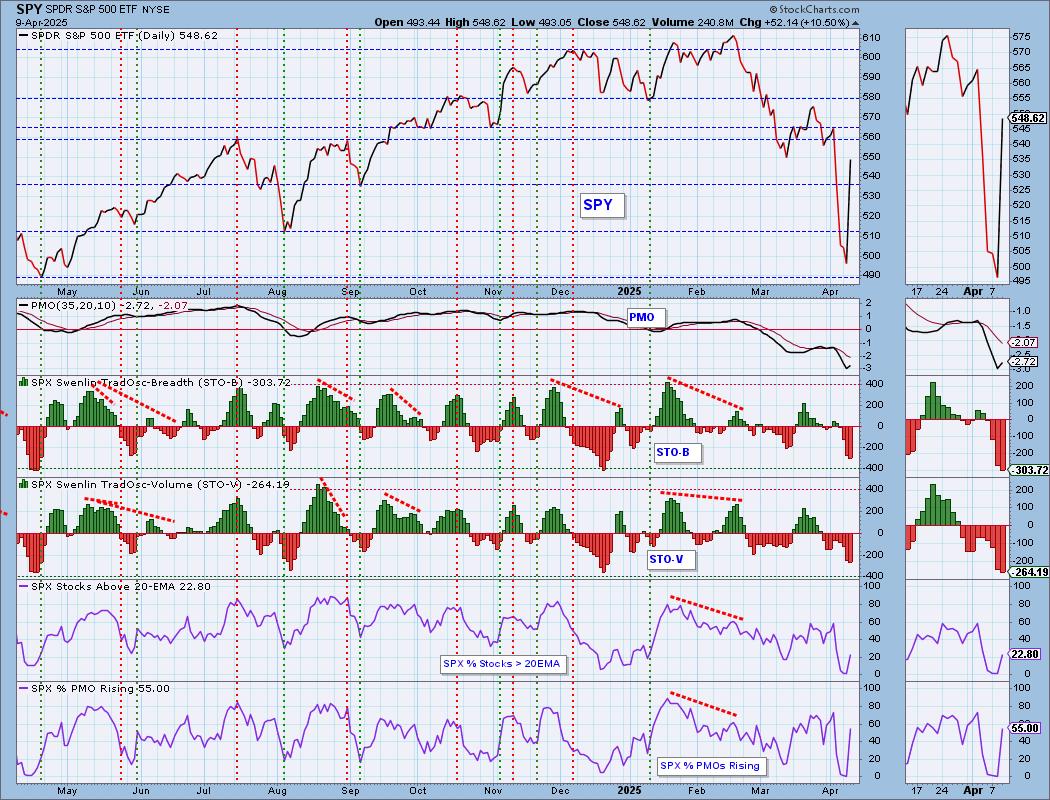
The Swenlin Trading Oscillators (STOs) were not impressed by the rally as they continued to make their way lower. They are oversold and with today's upside initiation climax we would look for them to reverse soon. Participation gained with %Stocks > 20EMA leaving oversold territory. We saw a giant leap in the number of PMOs Rising as this indicator also left oversold territory.
Intermediate-Term Market Indicators: The intermediate-term market trend is DOWN and the condition is NEUTRAL.
Like the STOs, both the ITBM and ITVM fell today. They could be considered near-term oversold, but ultimately they could accommodate far more downside. This does suggest that we may not be completely out of the woods yet. We saw a few new PMO BUY Signals. Now that over 50% are showing rising PMOs, this number should begin to increase more.
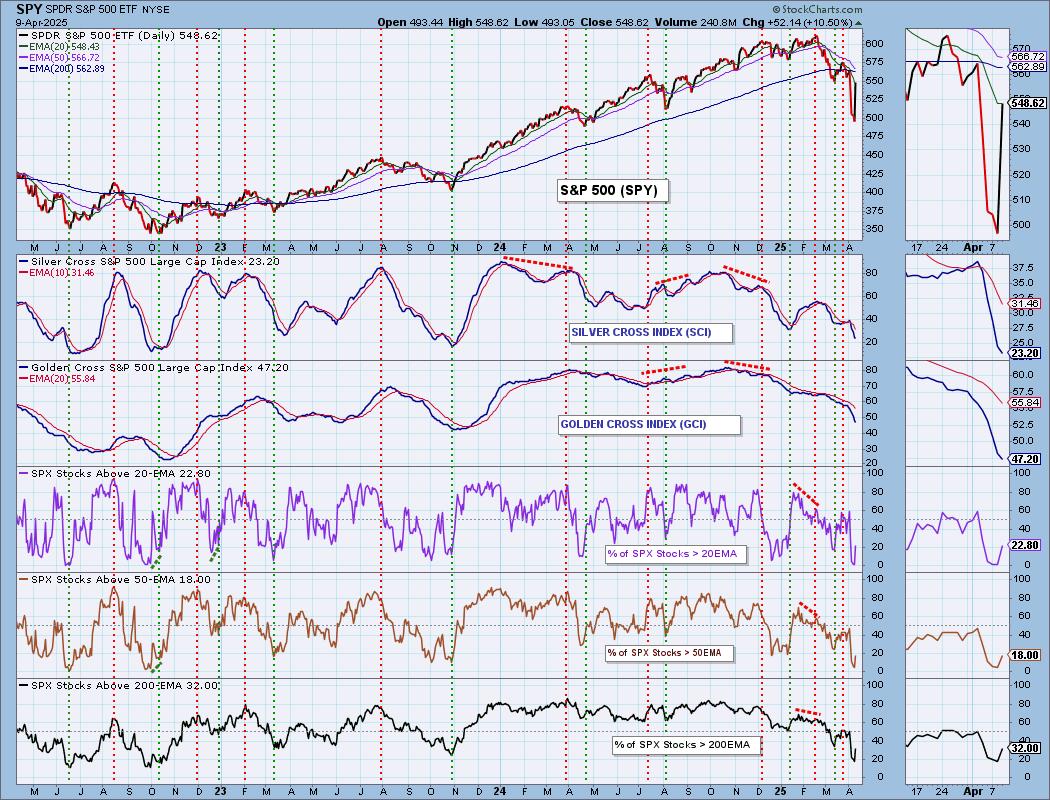
PARTICIPATION CHART (S&P 500): The following chart objectively shows the depth and trend of participation for the SPX in two time frames.
- Intermediate-Term - the Silver Cross Index (SCI) shows the percentage of SPX stocks on IT Trend Model BUY signals (20-EMA > 50-EMA). The opposite of the Silver Cross is a "Dark Cross" -- those stocks are, at the very least, in a correction.
- Long-Term - the Golden Cross Index (GCI) shows the percentage of SPX stocks on LT Trend Model BUY signals (50-EMA > 200-EMA). The opposite of a Golden Cross is the "Death Cross" -- those stocks are in a bear market.
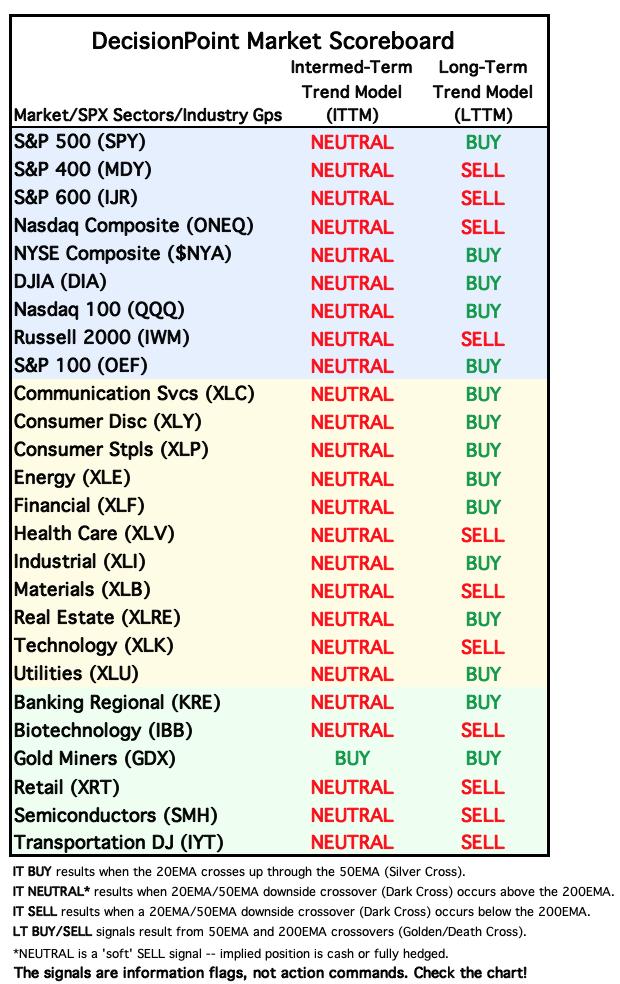
The market bias is BEARISH in the intermediate and long terms.
Participation readings are now coming out of oversold territory and this is welcome. Readings are still well below our bullish 50% threshold, but this is a good start. The Silver Cross Index is still moving lower and it will continue to unless we see more stocks get over their 50-day EMAs. Similarly the Golden Cross Index is falling and will continue to unless we see more stocks get above their 200-day EMAs. Both the Silver Cross Index and Golden Cross Index are below their signal lines so the IT and LT Biases are still BEARISH.
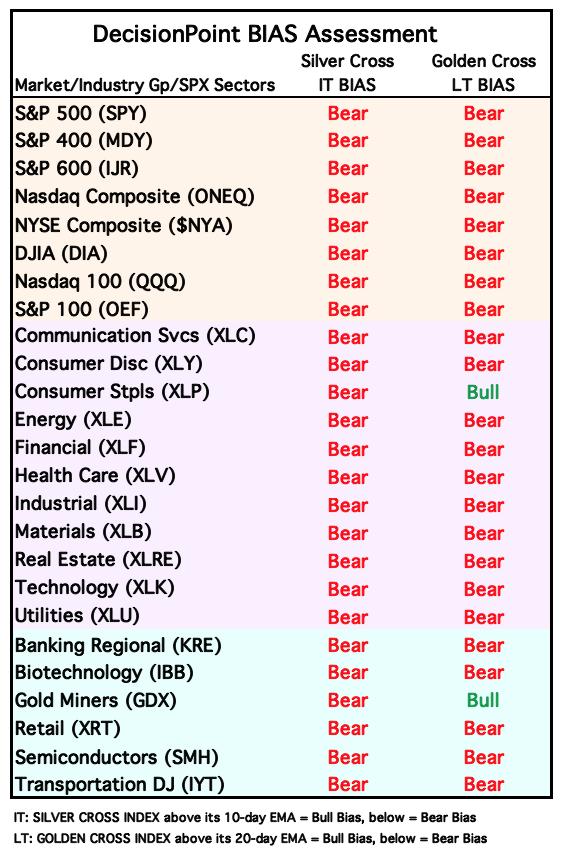
BIAS Assessment: The following table expresses the current BIAS of various price indexes based upon the relationship of the Silver Cross Index to its 10-day EMA (intermediate-term), and of the Golden Cross Index to its 20-day EMA (long-term). When the Index is above the EMA it is bullish, and it is bearish when the Index is below the EMA. The BIAS does not imply that any particular action should be taken. It is information to be used in the decision process.
The items with highlighted borders indicate that the BIAS changed today.
*****************************************************************************************************
CONCLUSION: We saw an incredible turnaround in the markets today. We talked about oversold conditions persisting, but instead we saw participation leap higher out of oversold territory. The PMO turned back up with Stochastics. We didn't get confirmation from the STOs and ITBM/ITVM but we think they will come around fairly quickly if we get followthrough. Will we get followthrough? We believe so given today's high volume conviction behind the rally. The upside initiation climax also calls for more upside ahead. We wouldn't rule out the bear market just yet as we are still talking about across the board tariffs even during the pause. However, if we continue to get more clarity and deals are made, we think we will see a strong showing by the SPY.
Erin is 10% long, 0% short. (This is intended as information, not a recommendation.)
*****************************************************************************************************
CALENDAR

BITCOIN
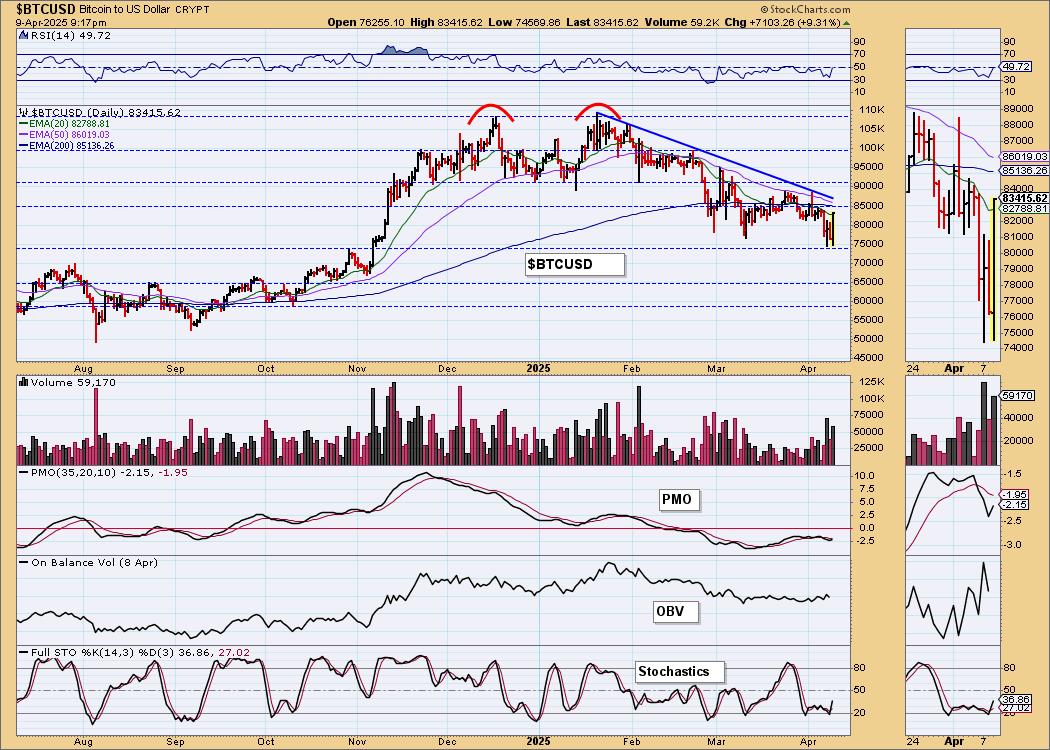
Bitcoin rallied strongly with the market today. It didn't help with the declining trend, but it is a start. The PMO has turned up with Stochastics. This rebound is also coming off some strong support. We've seen many failed attempts at a breakout, but this could get legs if the market continues to rocket higher.
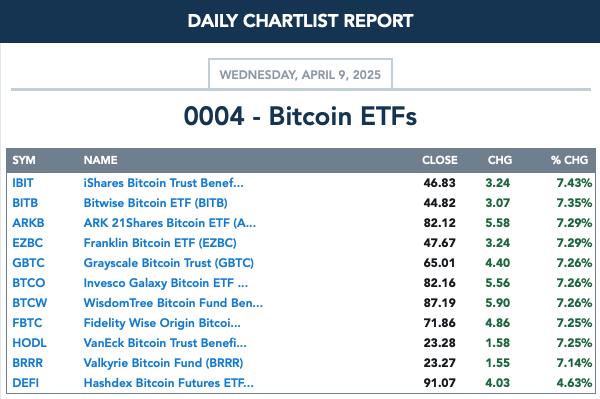
BITCOIN ETFs
INTEREST RATES
Yields are rocketing higher as we don't seem to be seeing much Bond buying. Higher rates could fix that. Bond funds are likely to continue to move lower as we do think yields are on their next leg up. Declining trends are being broken.
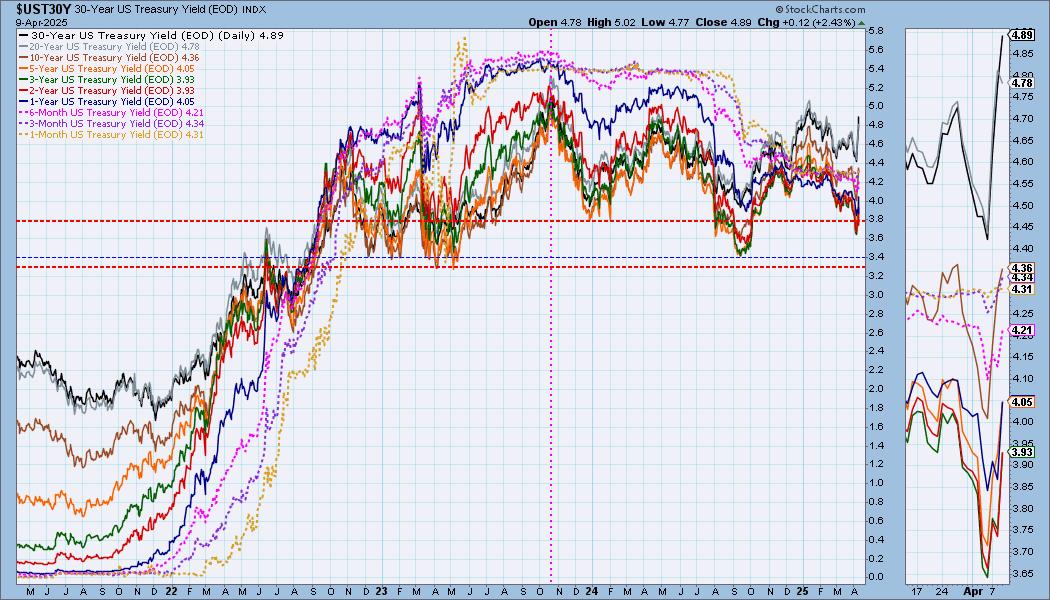
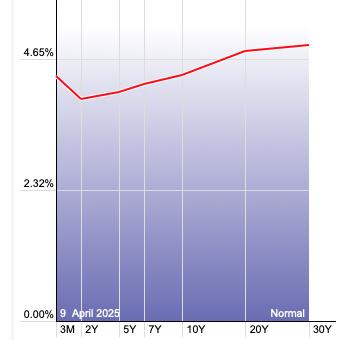
The Yield Curve Chart from StockCharts.com shows us the inversions taking place. The red line should move higher from left to right. Inversions are occurring where it moves downward.
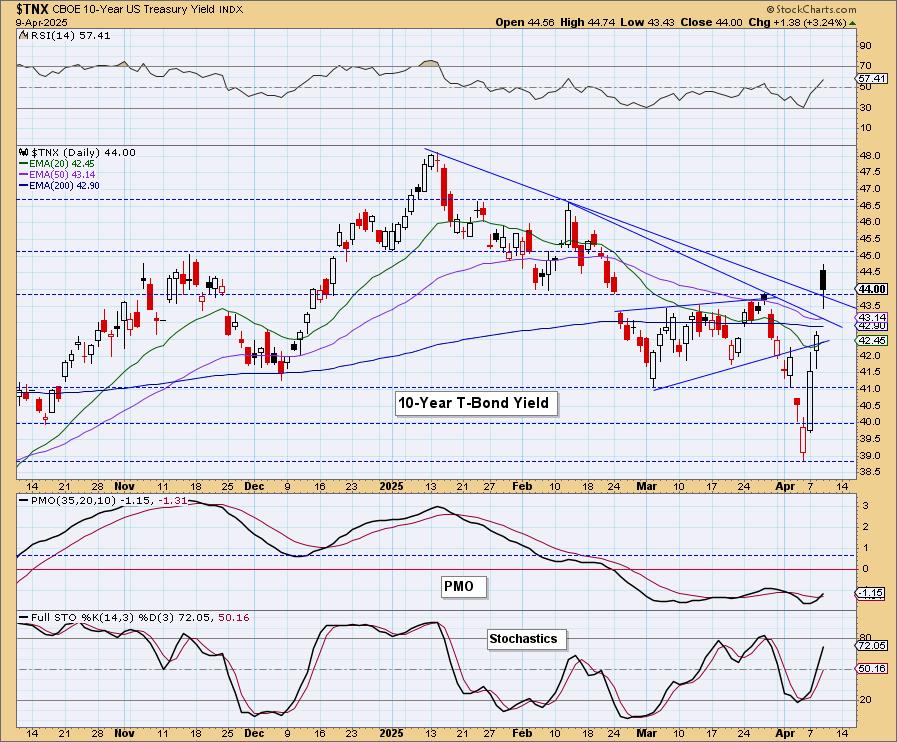
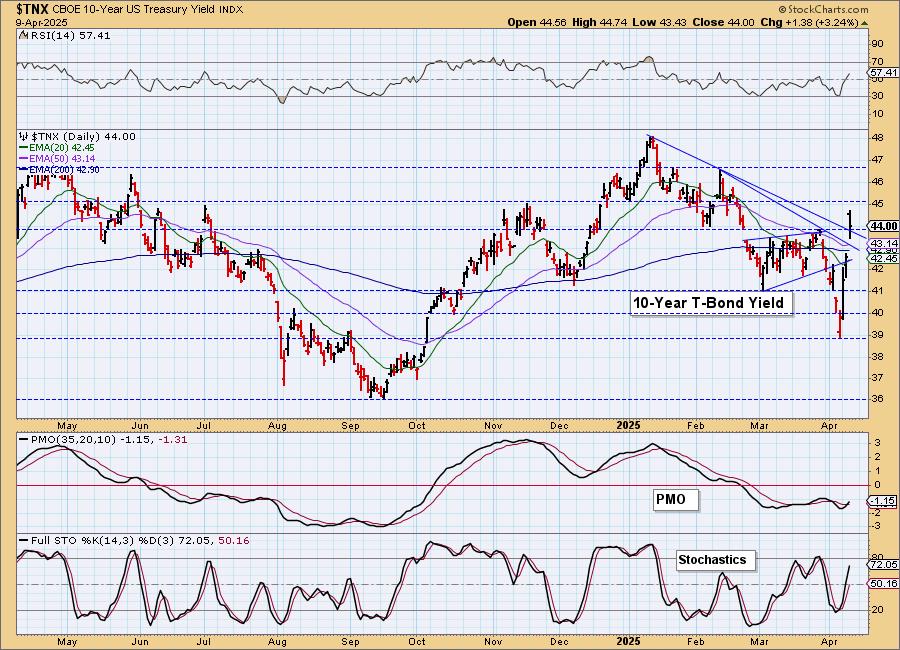
10-YEAR T-BOND YIELD
$TNX rallied strongly today but did form a bearish filled black candlestick. The declining trend has now been broken so we should look for some more upside here. The PMO just gave us a Crossover BUY Signal and Stochastics are rising strongly. We should see some followthrough as the RSI is not yet overbought.
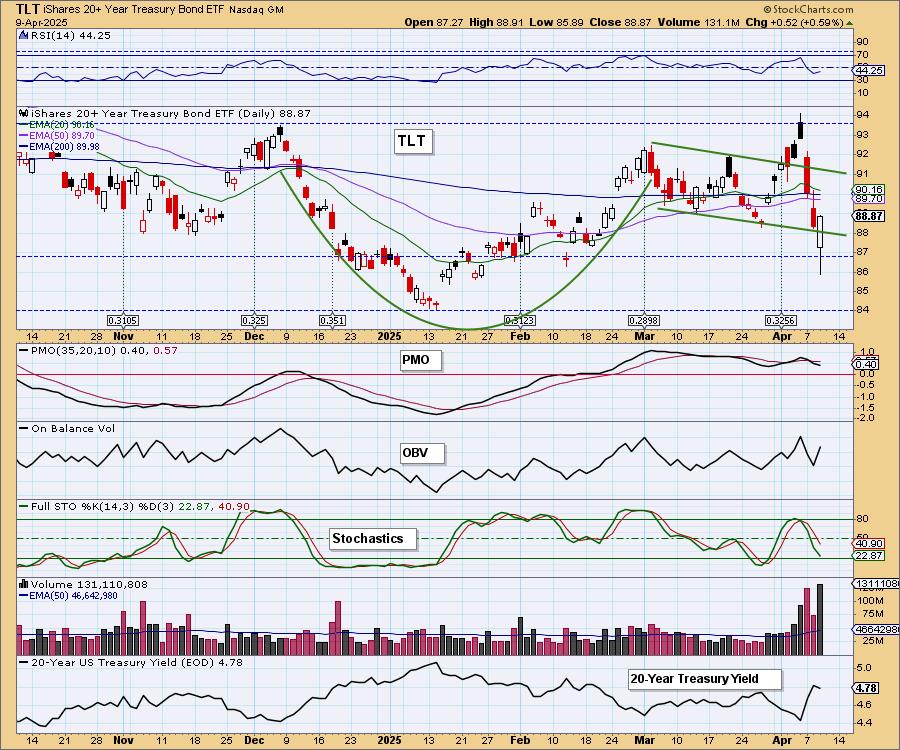
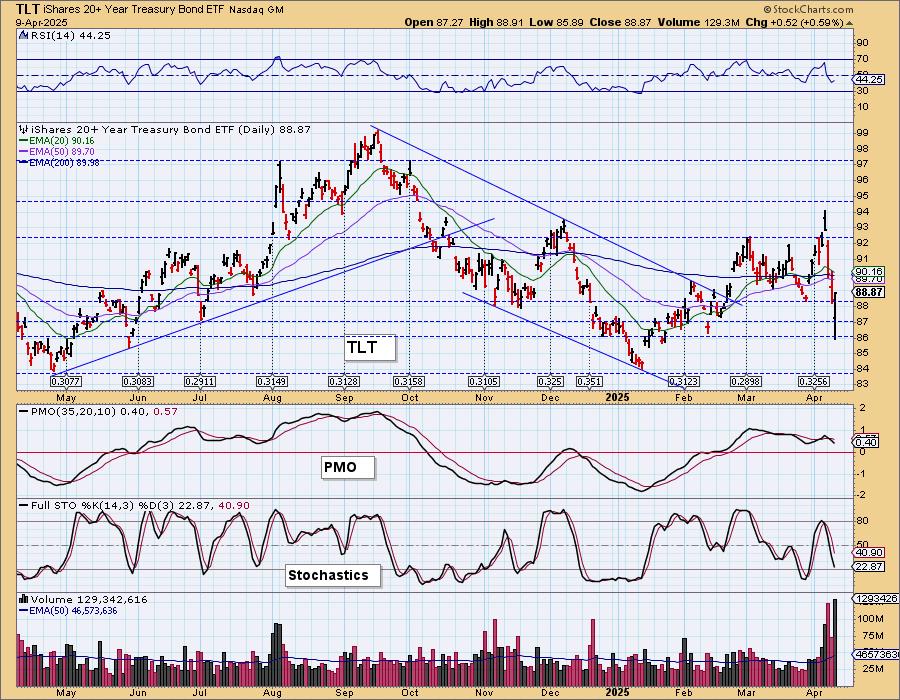
BONDS (TLT)
IT Trend Model: BUY as of 2/25/2025
LT Trend Model: SELL as of 12/13/2024
TLT Daily Chart: TLT managed a decent rally as the 20-year yield did pull back slightly. Yields look awfully bullish right now so we aren't expecting much more upside here. The bullish cup with handle is beginning to bust. We would look for price to come back down to the 84 level. The PMO is declining and Stochastics are nearly below 20.
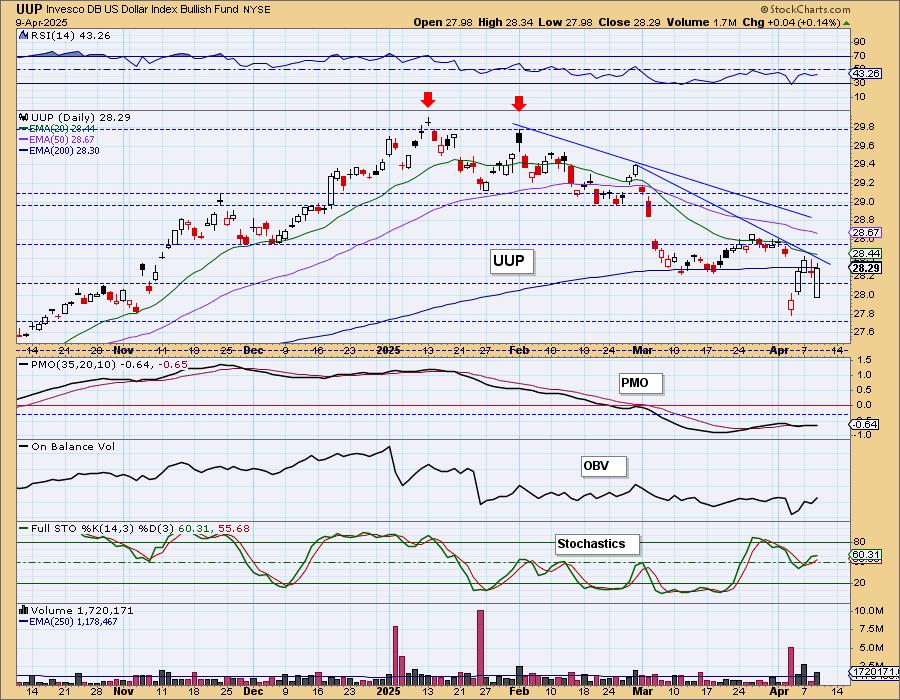
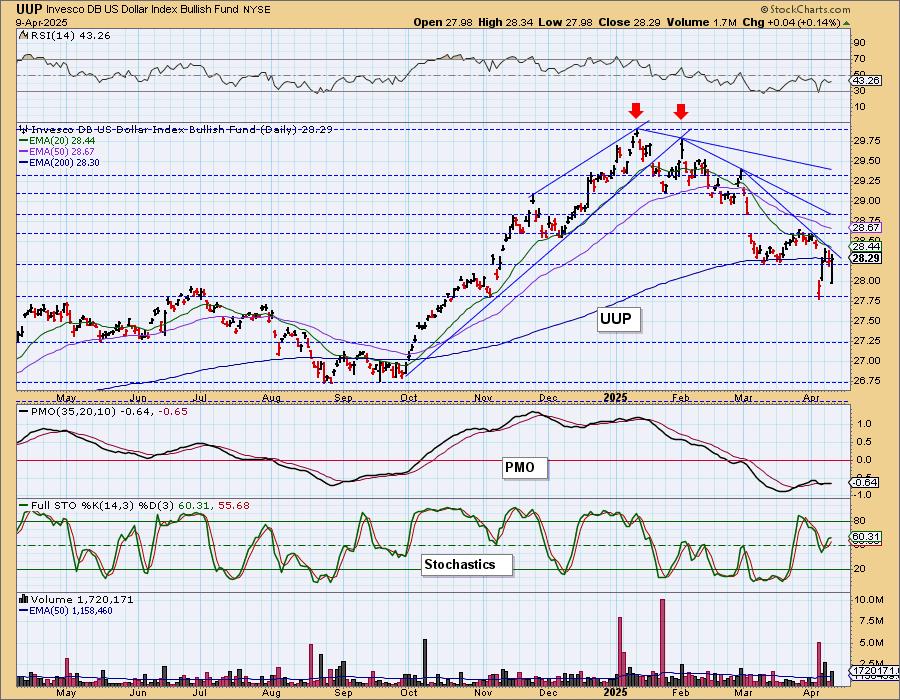
DOLLAR (UUP)
IT Trend Model: NEUTRAL as of 3/5/2025
LT Trend Model: BUY as of 5/25/2023
UUP Daily Chart: The Dollar rallied slightly today. It remains in a declining trend. The PMO is flat and not telling us much except that there is still weakness as it is below the zero line. We did get a bullish engulfing candlestick so we could see another rally tomorrow. We can't get that bullish as it remains in a declining trend. Stochastics are flattening as well.
GOLD
IT Trend Model: BUY as of 1/10/2025
LT Trend Model: BUY as of 10/20/2023
GLD Daily Chart: Gold saw lots of buyers today as it was up strongly even on the Dollar's small rally. We thought there was more downside to absorb here, but this was a good rally. It did form a gap so there is an outside chance we'll see an island reversal which would imply an upcoming gap down. The PMO tipped upward though and the RSI looks very positive and not overbought. Stochastics are also rising now. The Gold Volatility Index ($GVZ) continues to puncture its lower Bollinger Band on the inverted scale and that can facilitate rallies.
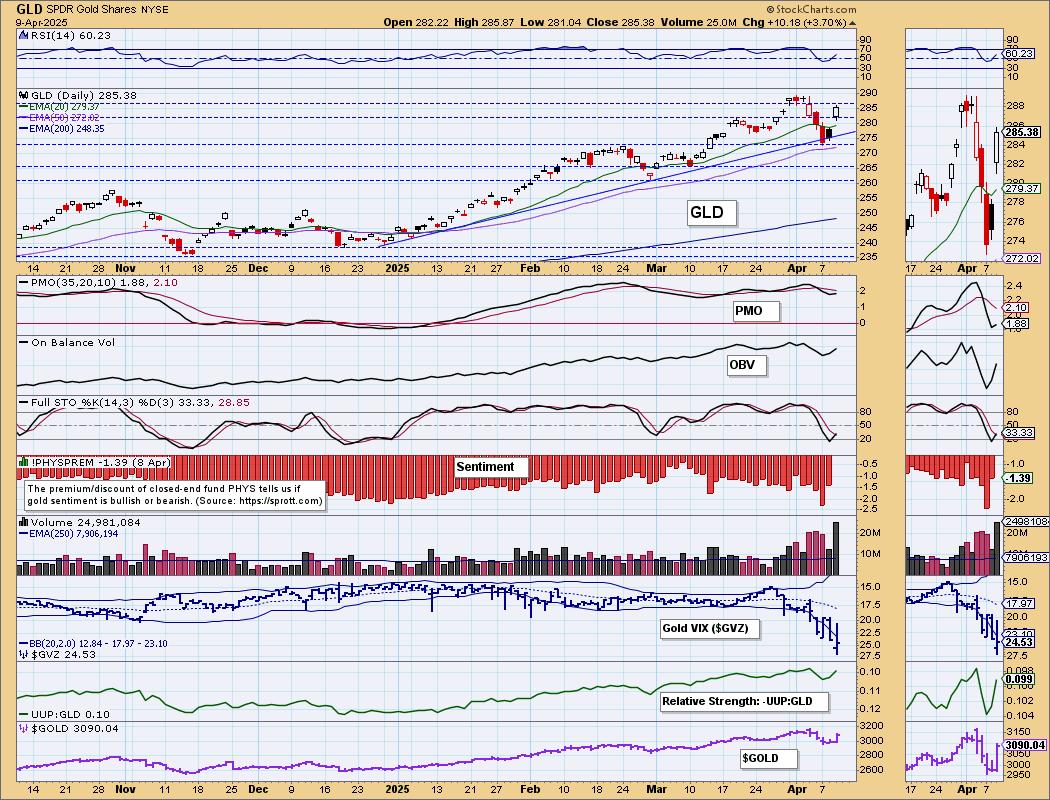
The Dollar and Gold are no longer correlated in the short term so we could see more days where both are up or both are down at the same time.

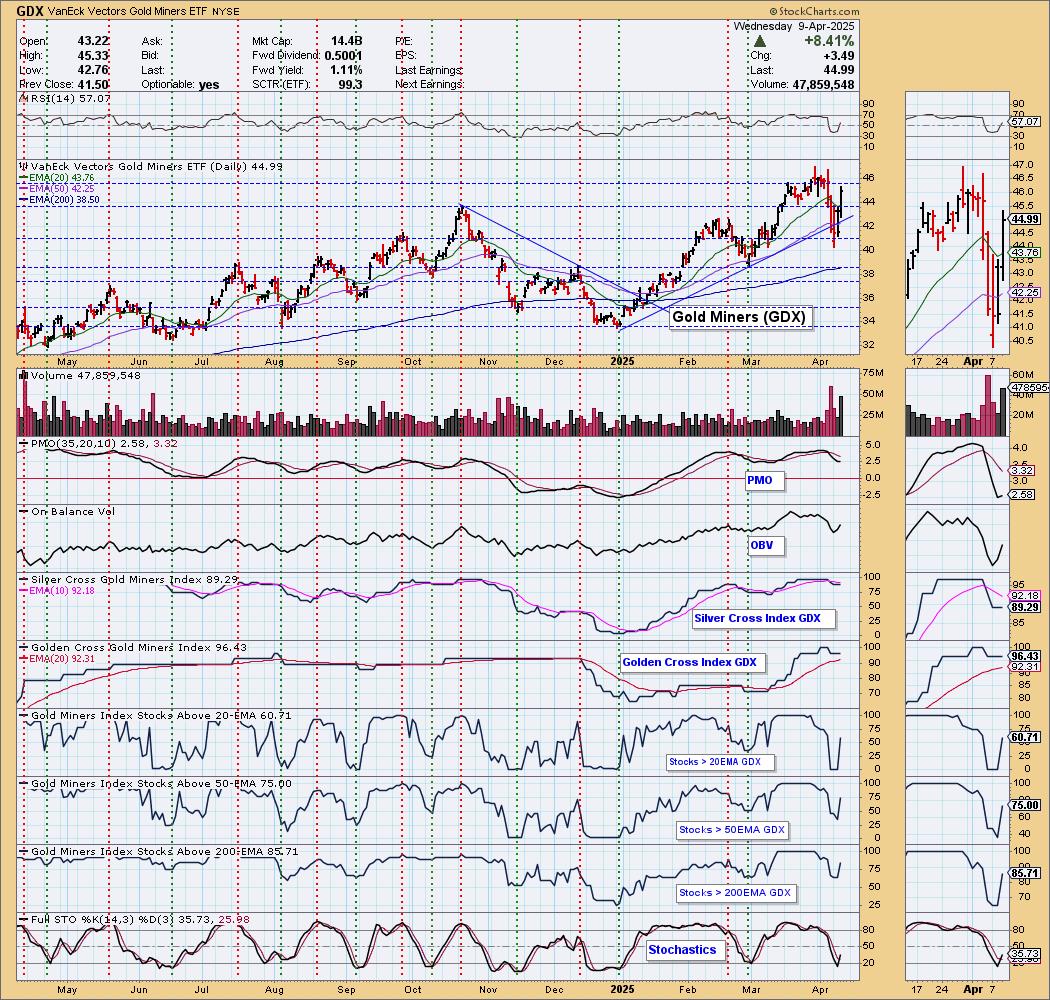
GOLD MINERS (GDX) Daily Chart: Gold Miners burst higher today on the rally in Gold and likely on the rally in the market as well. They had broken the rising trend, but have recaptured it. Participation is healing and the PMO turned back up. Stochastics also tipped up. We would look for more followthrough pending Gold rallying further.
CRUDE OIL (USO)
IT Trend Model: NEUTRAL as of 2/27/2025
LT Trend Model: SELL as of 3/18/2025
USO Daily Chart: Crude was very oversold and it was time for a bounce. We got it and we think we could see some followthrough here given the big bullish engulfing candlestick. Stochastics are rising again. The PMO hasn't gotten on board but it is one day of rally. We don't think this will last very long as OPEC+ is keeping production levels high and demand is apparently lower. For now we'll look for some more upside.
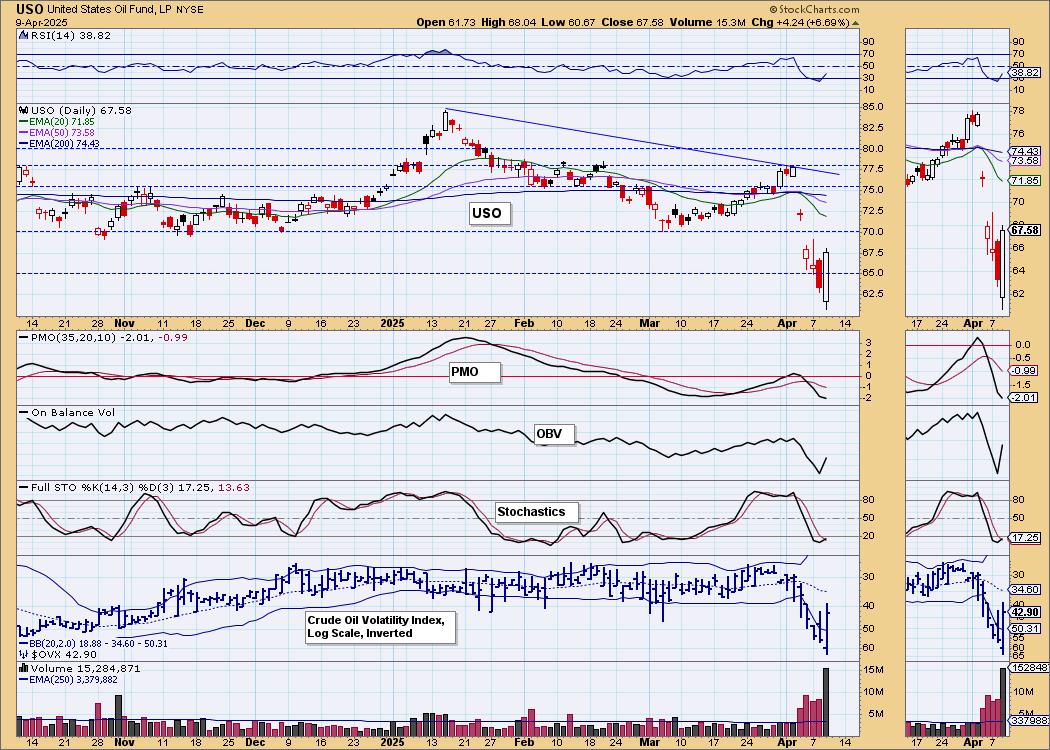
Strong support at the September low was recaptured. We think we could get back up to at least 70.
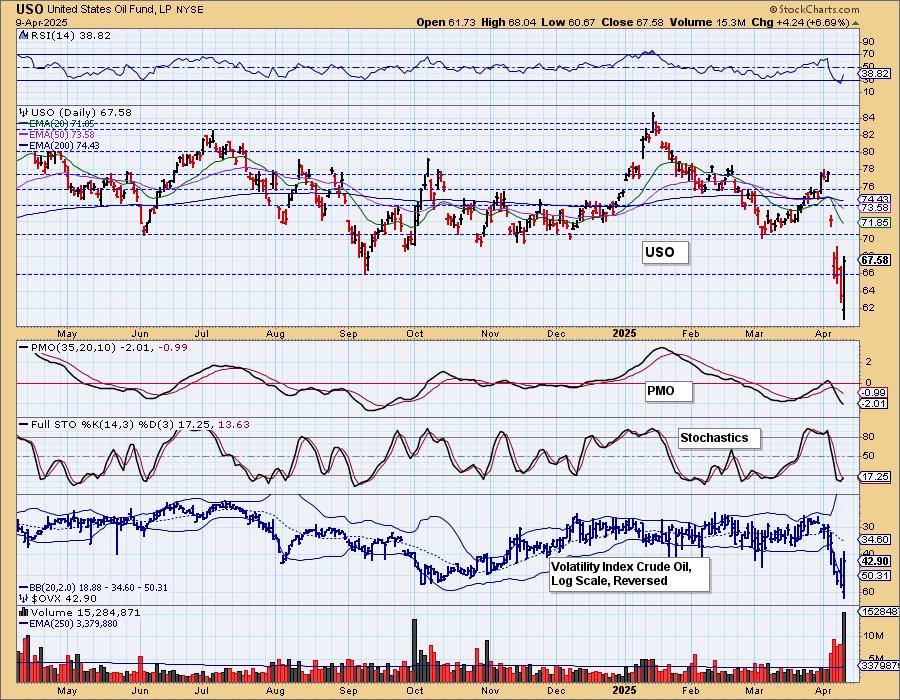
We are also seeing support available in the long-term trading range where a bounce could be had.
Good Luck & Good Trading!
Erin Swenlin and Carl Swenlin
Technical Analysis is a windsock, not a crystal ball. --Carl Swenlin
(c) Copyright 2025 DecisionPoint.com
Disclaimer: This blog is for educational purposes only and should not be construed as financial advice. The ideas and strategies should never be used without first assessing your own personal and financial situation, or without consulting a financial professional. Any opinions expressed herein are solely those of the author, and do not in any way represent the views or opinions of any other person or entity.
DecisionPoint is not a registered investment advisor. Investment and trading decisions are solely your responsibility. DecisionPoint newsletters, blogs or website materials should NOT be interpreted as a recommendation or solicitation to buy or sell any security or to take any specific action.
NOTE: The signal status reported herein is based upon mechanical trading model signals, specifically, the DecisionPoint Trend Model. They define the implied bias of the price index based upon moving average relationships, but they do not necessarily call for a specific action. They are information flags that should prompt chart review. Further, they do not call for continuous buying or selling during the life of the signal. For example, a BUY signal will probably (but not necessarily) return the best results if action is taken soon after the signal is generated. Additional opportunities for buying may be found as price zigzags higher, but the trader must look for optimum entry points. Conversely, exit points to preserve gains (or minimize losses) may be evident before the model mechanically closes the signal.
Helpful DecisionPoint Links:
DecisionPoint Alert Chart List
DecisionPoint Golden Cross/Silver Cross Index Chart List
DecisionPoint Sector Chart List
Price Momentum Oscillator (PMO)