
Today the Silver Cross Index crossed above its 10-day EMA (Signal Line) generating a "Bullish Shift". A Bullish Shift changes our bias to BULLISH. In this case it was the intermediate-term Silver Cross Index that had the shift so the IT Bias is now BULLISH.
The DecisionPoint Alert Weekly Wrap presents an end-of-week assessment of the trend and condition of the Stock Market, the U.S. Dollar, Gold, Crude Oil, and Bonds. The DecisionPoint Alert daily report (Monday through Thursday) is abbreviated and gives updates on the Weekly Wrap assessments.
MARKET/INDUSTRY GROUP/SECTOR INDEXES
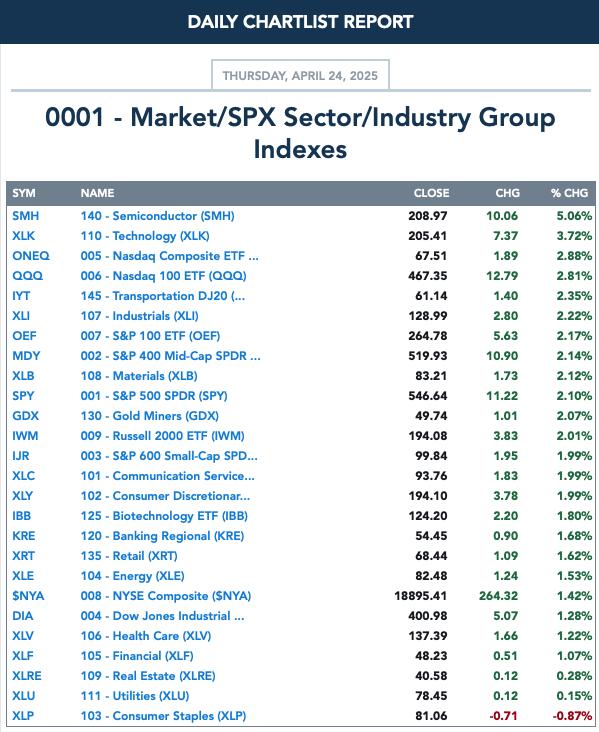
CLICK HERE for Carl's annotated Market Index, Sector, and Industry Group charts.
THE MARKET (S&P 500)
IT Trend Model: NEUTRAL as of 3/4/2025
LT Trend Model: BUY as of 3/29/2023
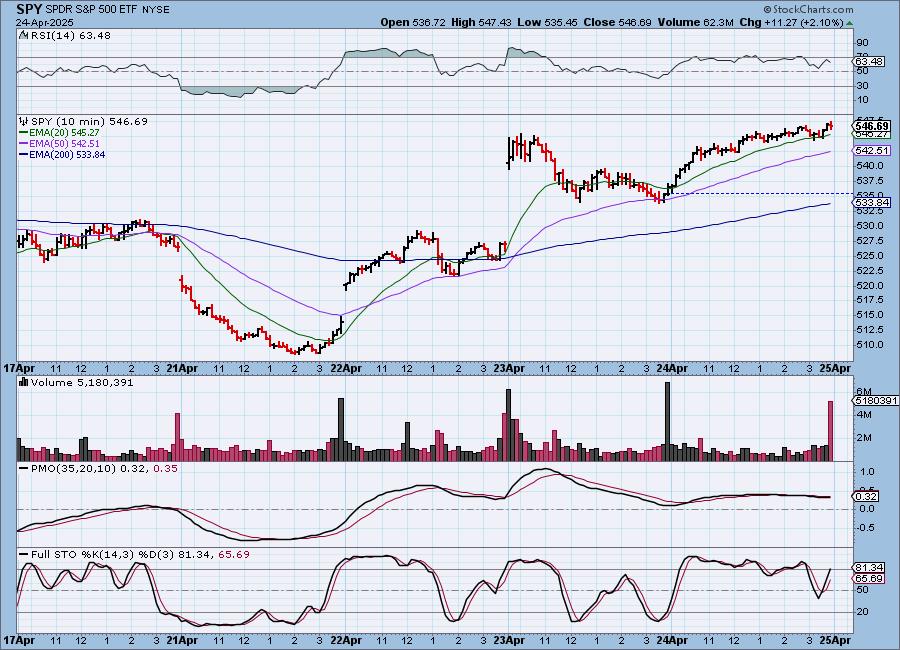
SPY 10-Minute Chart: It was a steady rally today with no hiccups suggesting investors are more comfortable with current conditions despite tariffs etc.
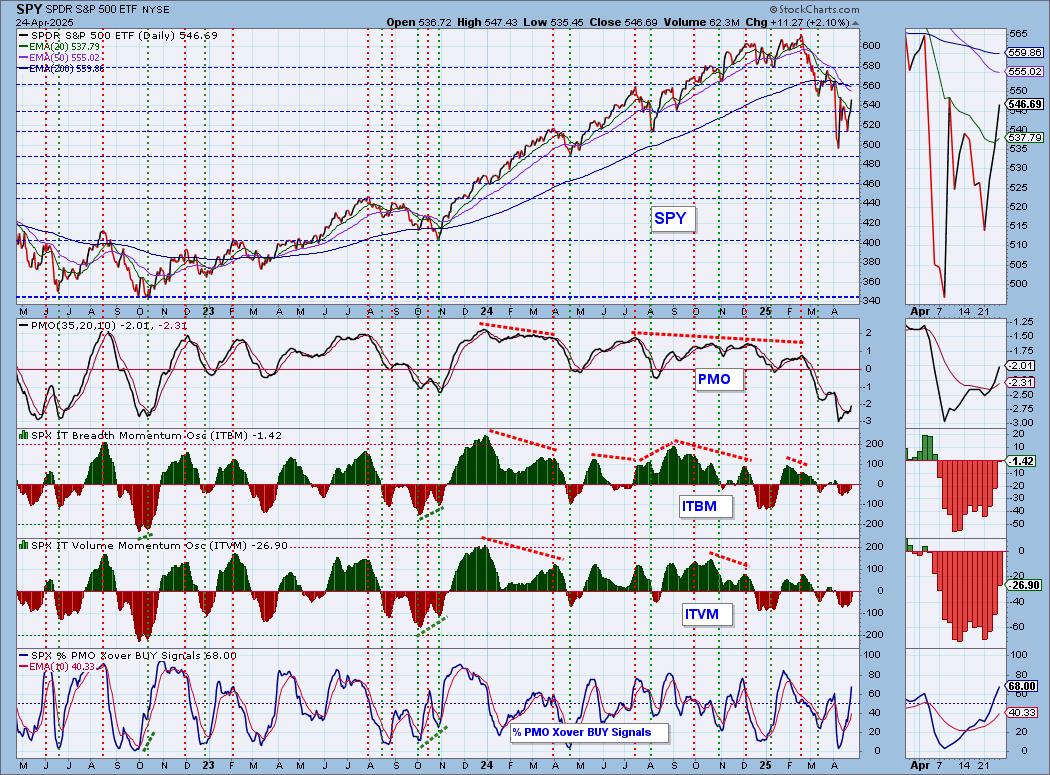
SPY Daily Chart: Price is now testing the intermediate-term declining trendline. We have had three days of rally in a row and that has been where price fails in this bear market so we should be on the lookout for a possible reversal. The PMO looks bullish as it rises, but it is still well below the zero line so this could be a case of diminishing weakness and not new strength. We'll know more tomorrow when we find out what price will do with declining tops resistance. We also note that price is under a new resistance line as well.
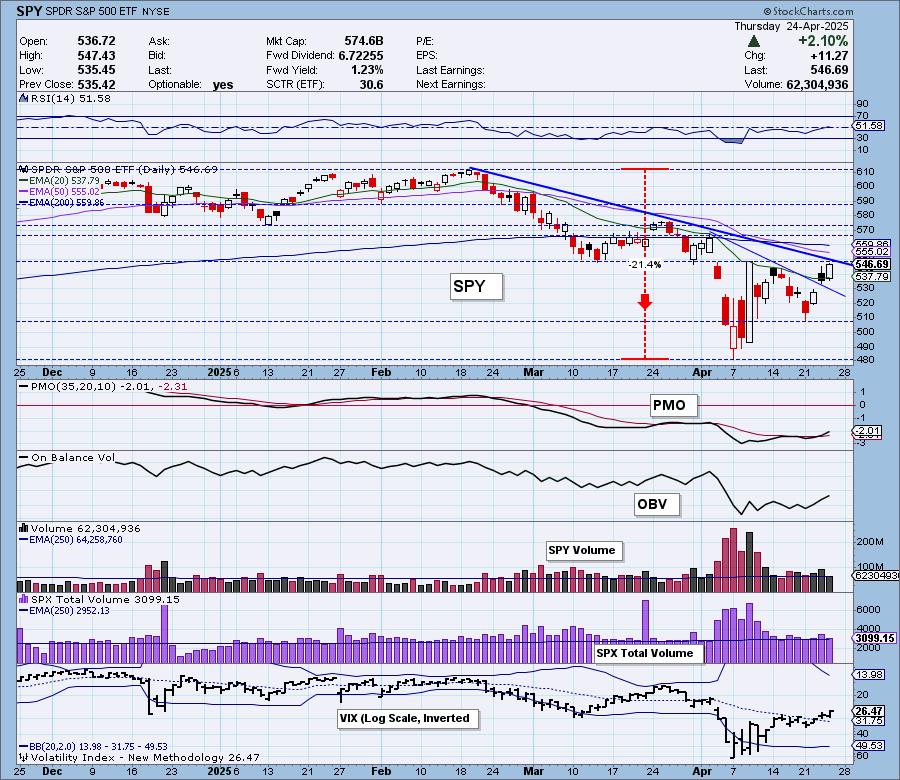
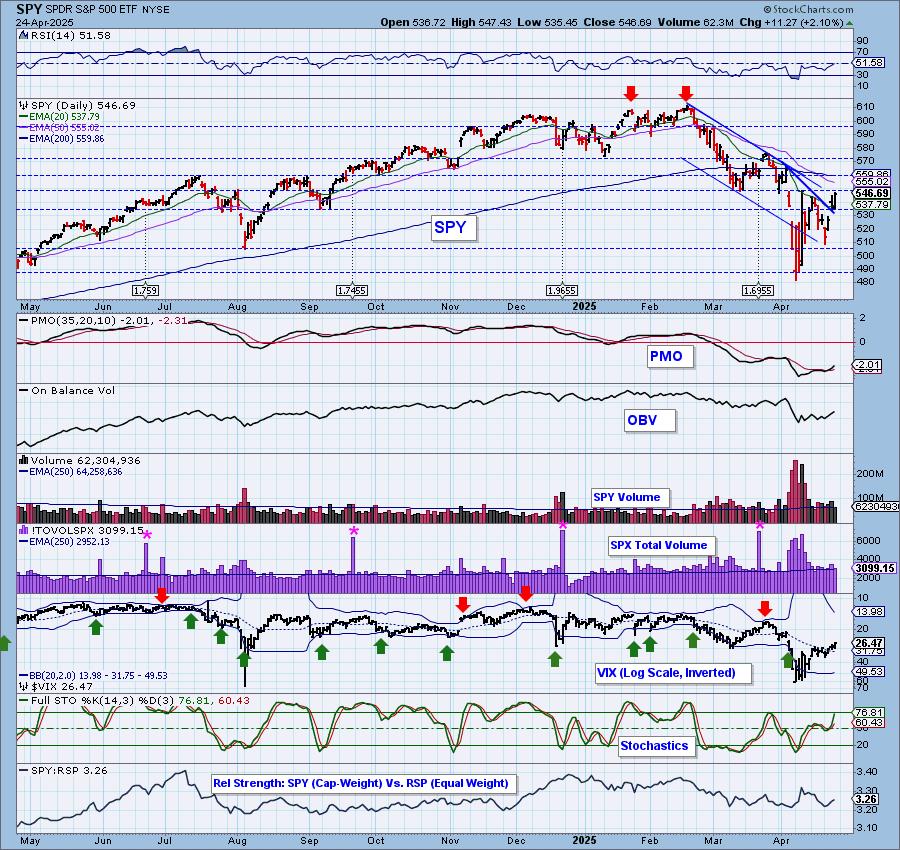
The VIX remained above its moving average on the inverted scale and that does imply strength. It is still quite elevated so fear is still visible. Stochastics are rising vertically now and look very bullish.
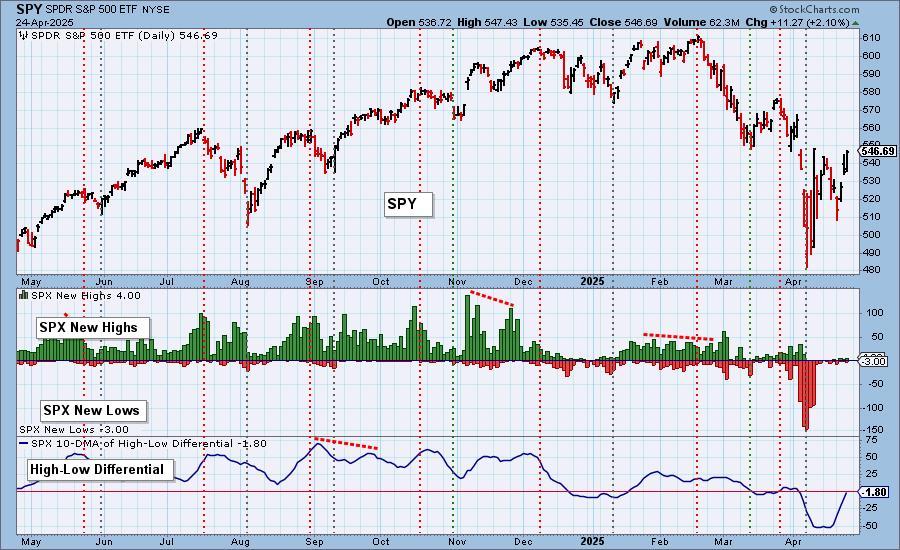
S&P 500 New 52-Week Highs/Lows: Yesterday's comments still apply:
"Not much in the way of New Highs or New Lows which may suggest we are at a period of equilibrium. The High-Low Differential looks very bullish."
Climax* Analysis: Today there were unanimous climax readings on the four relative indicators, giving us another upside exhaustion climax.
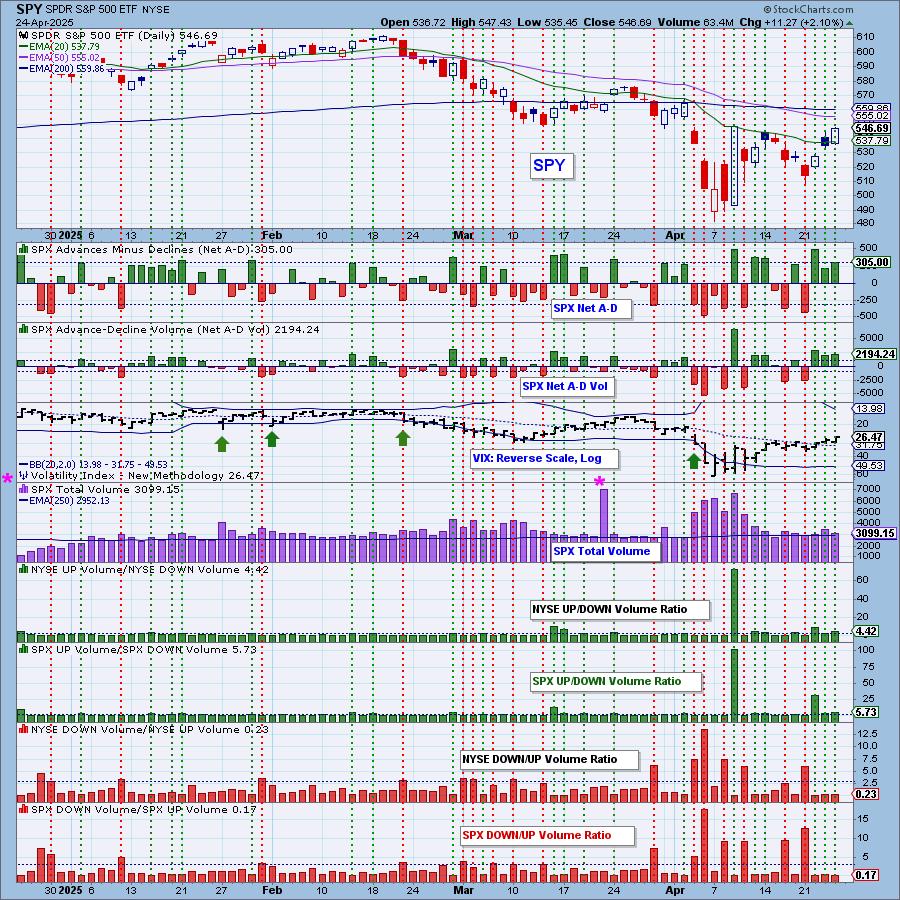
*A climax is a one-day event when market action generates very high readings in, primarily, breadth and volume indicators. We also include the VIX, watching for it to penetrate outside the Bollinger Band envelope. The vertical dotted lines mark climax days -- red for downside climaxes, and green for upside. Climaxes are at their core exhaustion events; however, at price pivots they may be initiating a change of trend.
Short-Term Market Indicators: The short-term market trend is DOWN and the condition is SOMEWHAT OVERBOUGHT.
Swenlin Trading Oscillators (STOs) shot up today and are already in somewhat overbought territory. Overbought conditions in a bear market are particularly dangerous, but they aren't that overbought yet. Also overbought is %PMOs Rising which is at a very high 84%. Participation really shot up and is at its highest level since this bear market decline began which is encouraging.
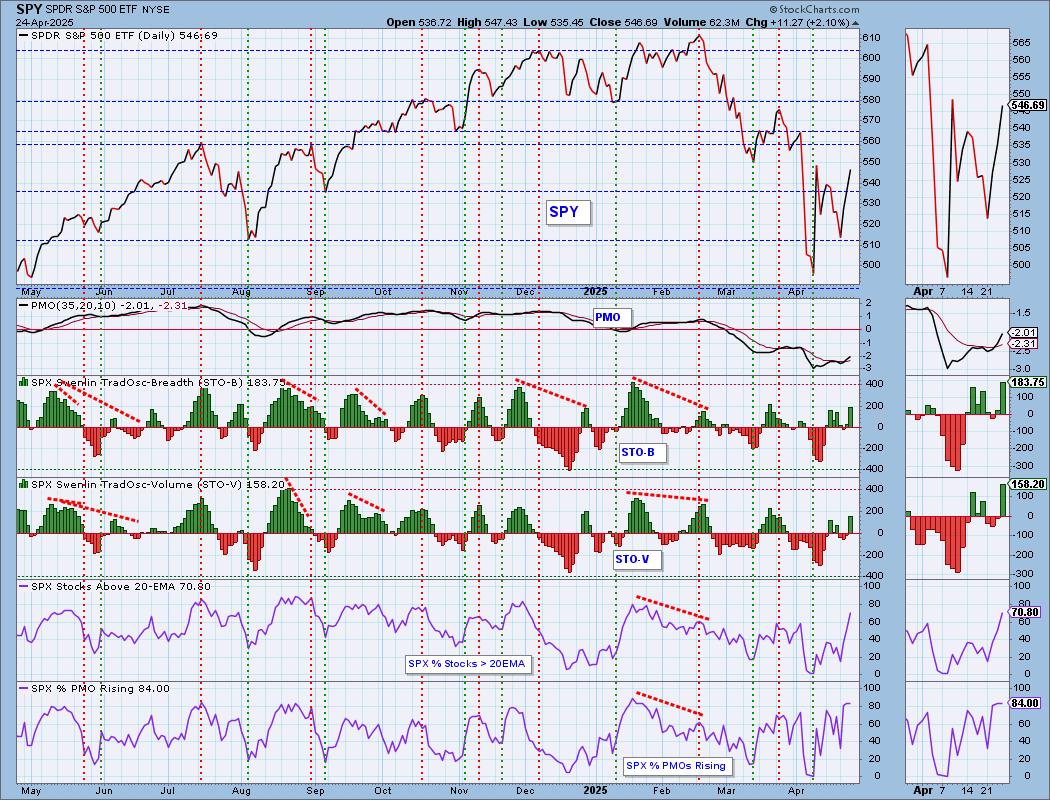
Intermediate-Term Market Indicators: The intermediate-term market trend is DOWN and the condition is NEUTRAL.
The ITBM and ITVM are rising but remain in negative territory. %PMO Xover BUY Signals are racing higher and have also reached heights not seen since the beginning of the decline.
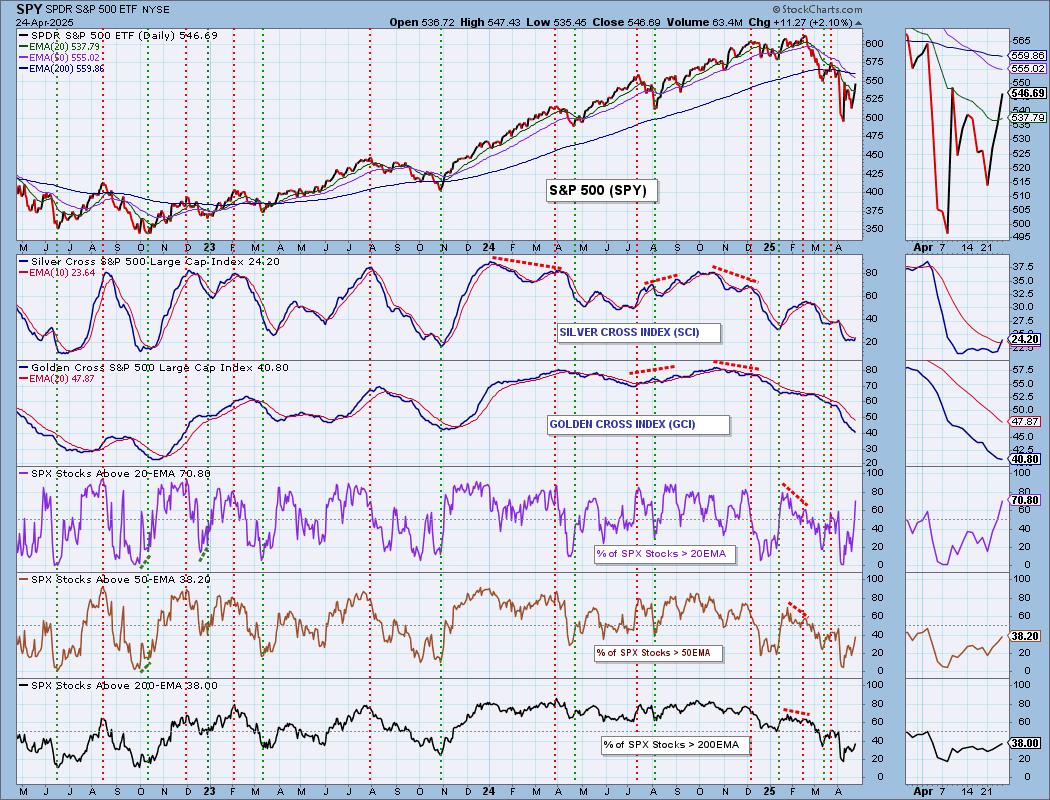
PARTICIPATION CHART (S&P 500): The following chart objectively shows the depth and trend of participation for the SPX in two time frames.
- Intermediate-Term - the Silver Cross Index (SCI) shows the percentage of SPX stocks on IT Trend Model BUY signals (20-EMA > 50-EMA). The opposite of the Silver Cross is a "Dark Cross" -- those stocks are, at the very least, in a correction.
- Long-Term - the Golden Cross Index (GCI) shows the percentage of SPX stocks on LT Trend Model BUY signals (50-EMA > 200-EMA). The opposite of a Golden Cross is the "Death Cross" -- those stocks are in a bear market.
The market bias is BULLISH in the intermediate term.
The market bias is BEARISH in the long term.
Participation is really improving right now but we do need more movement on %Stocks > 50/200EMAs. As noted in the opening the Silver Cross Index had a Bullish Shift today moving the IT Bias to BULLISH. It should continue to rise given we have more stocks above the 20/50-day EMAs versus Silver Crosses. We'd like to see the declining trend on the Silver Cross Index dissipate, but this is a good start. The Golden Cross Index is still vulnerable to more decline as we have fewer stocks above their 50/200-day EMAs versus Golden Crosses. It remains below its signal line so the LT Bias is still BEARISH.

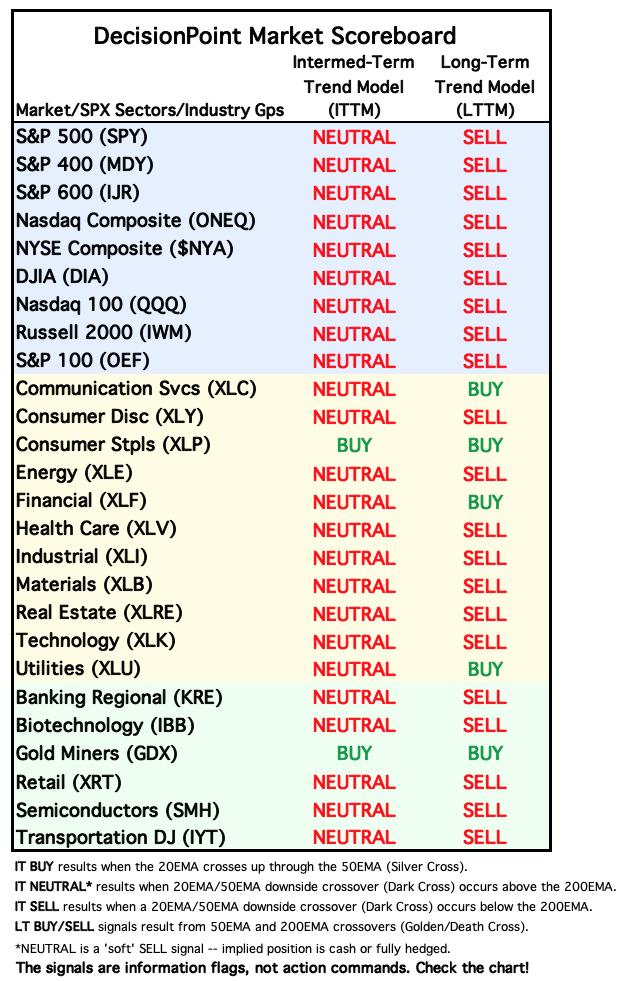
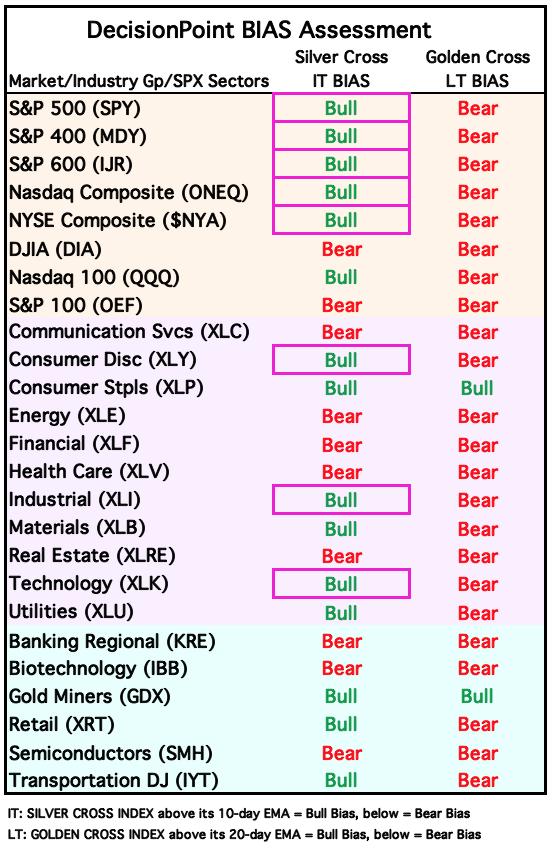
BIAS Assessment: The following table expresses the current BIAS of various price indexes based upon the relationship of the Silver Cross Index to its 10-day EMA (intermediate-term), and of the Golden Cross Index to its 20-day EMA (long-term). When the Index is above the EMA it is bullish, and it is bearish when the Index is below the EMA. The BIAS does not imply that any particular action should be taken. It is information to be used in the decision process.
The items with highlighted borders indicate that the BIAS changed today.
*****************************************************************************************************
CONCLUSION: There's a good chance that we are in the midst of a bear market rally that could see staying power. We saw a Bullish Shift on the Silver Cross Index. The Bias Table above saw a large amount of Bullish biases appear. The PMO and Stochastics as well as the STOs and ITBM/ITVM are all rising with the High-Low Differential. This is where we will find out what this rally is all about given it has reached overhead resistance and has had its three days in a row of rally. A decline could occur given today's follow-on upside exhaustion climax. It was stronger than yesterday's and therefore we could see the decline it portends.
Erin is 10% long, 0% short. (This is intended as information, not a recommendation.)
*****************************************************************************************************
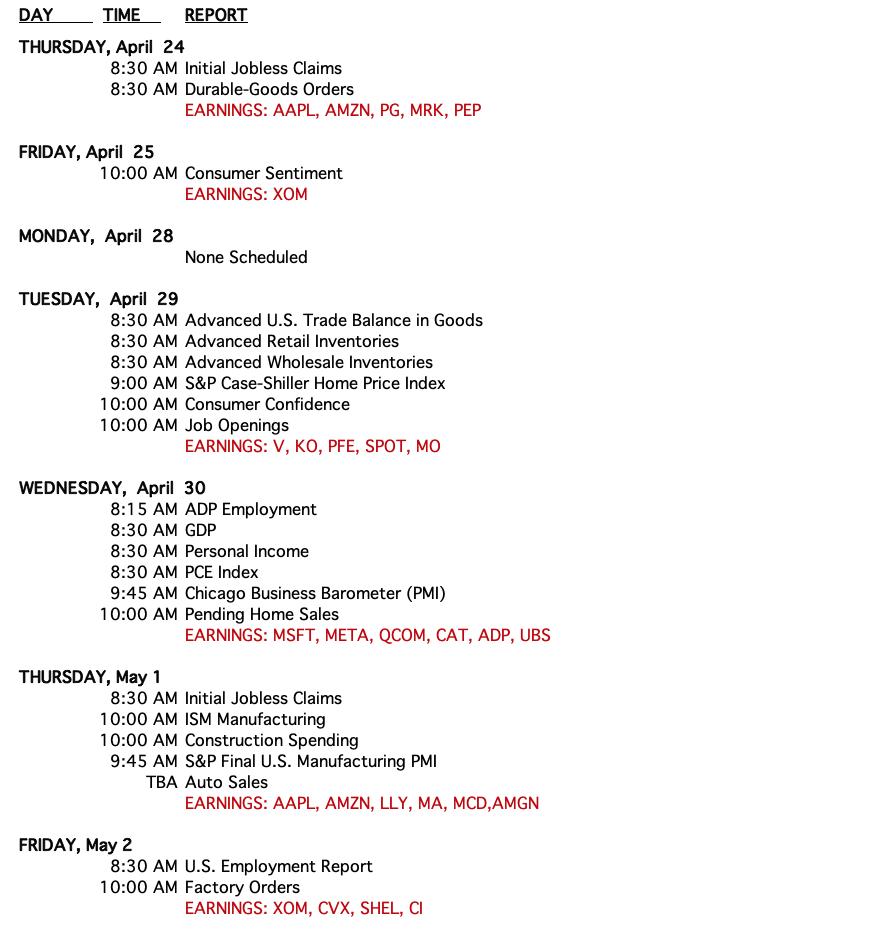
CALENDAR
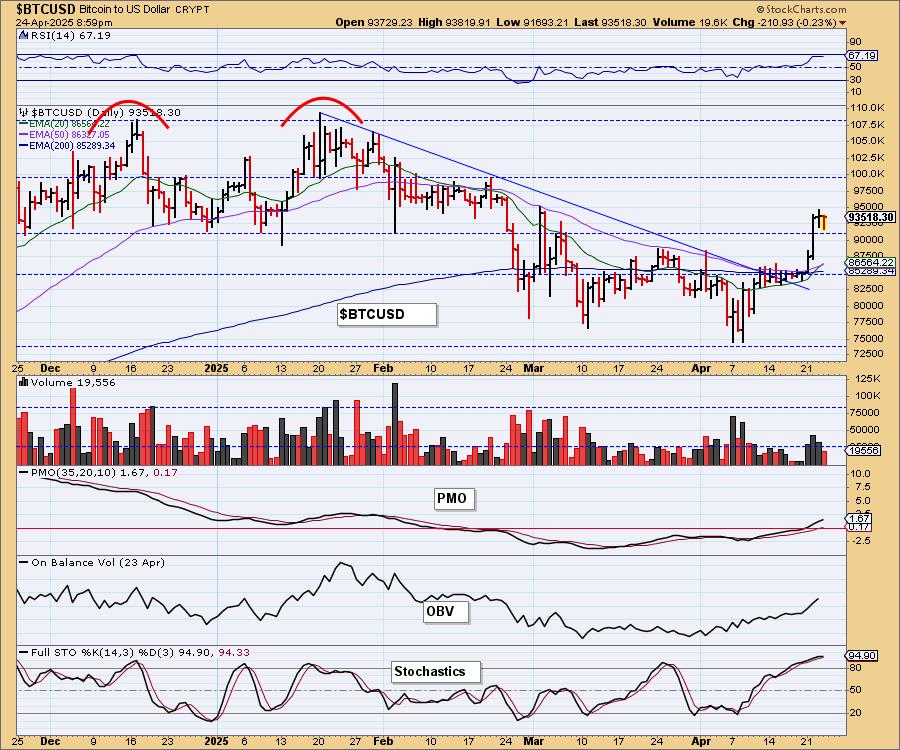
BITCOIN
Bitcoin took a breather today pulling back slightly toward the breakout point. This is a mechanical operation that usually occurs before the next rally higher. The indicators are still very bullish and the RSI isn't overbought yet so we do expect more upside from Bitcoin.
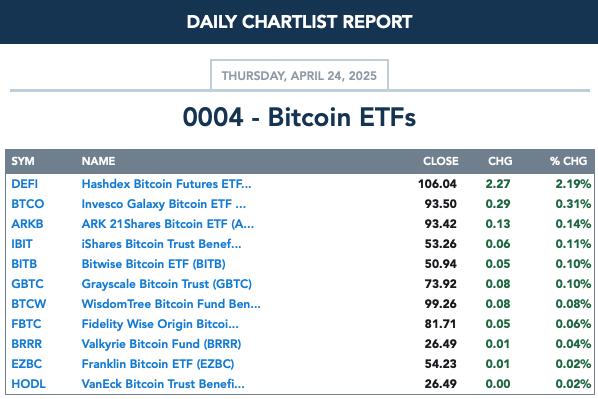
BITCOIN ETFs
INTEREST RATES
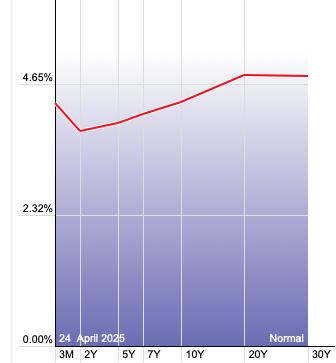
Long-term yields are definitely softening and could see some more downside. Short-term yields are mostly consolidation sideways. We've been looking for them to rise further, but it appears we're getting some Bond buying and that will push them down.

The Yield Curve Chart from StockCharts.com shows us the inversions taking place. The red line should move higher from left to right. Inversions are occurring where it moves downward.
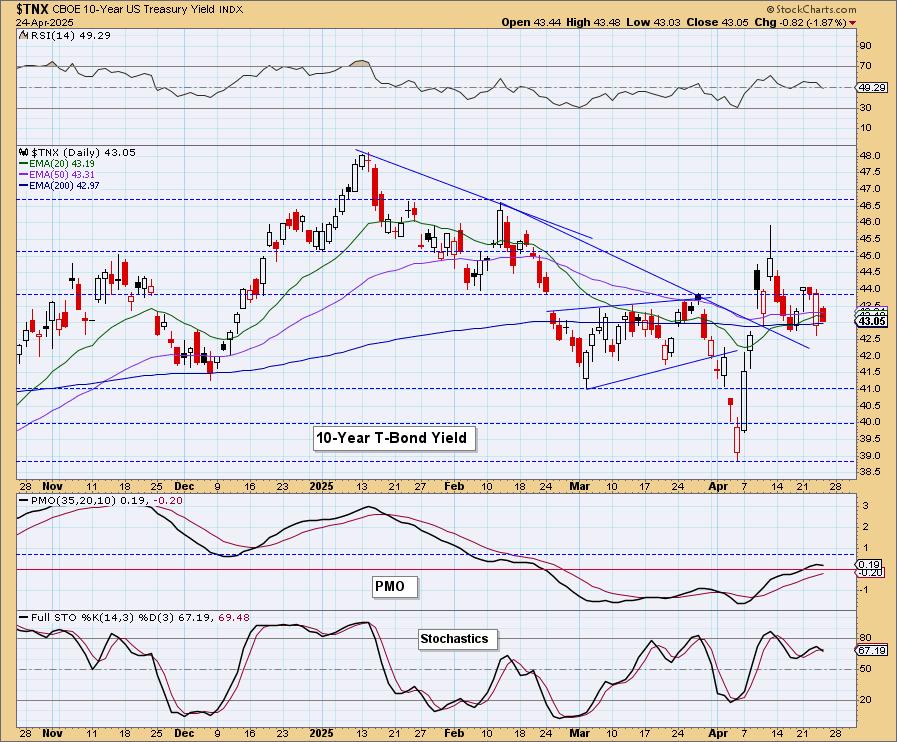
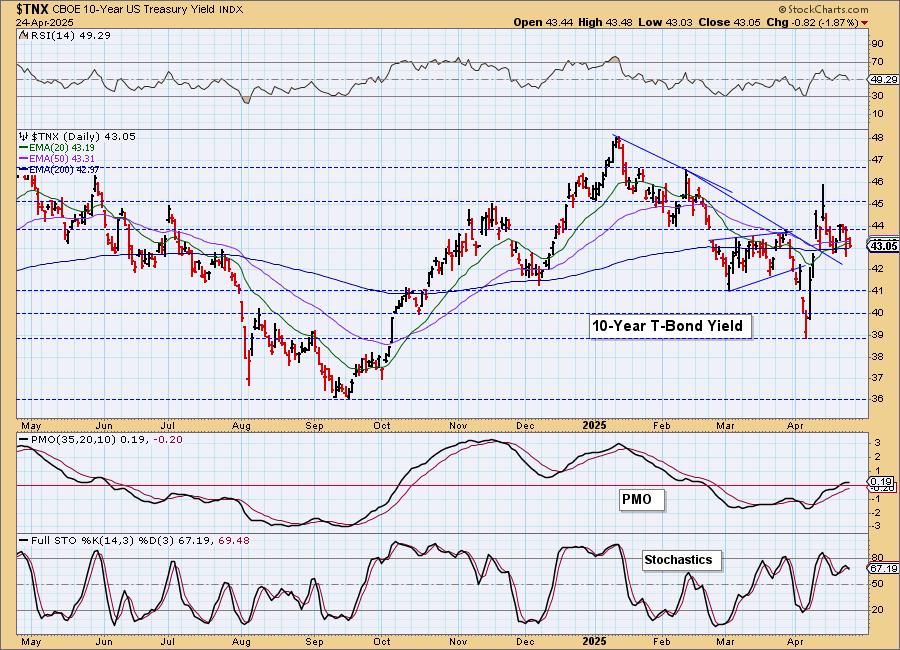
10-YEAR T-BOND YIELD
We don't like what we're seeing on $TNX right now. We've been looking for more upside, but given the declining trend that is forming out of this month's high, we need to switch gears. The PMO has also topped today and Stochastics are falling. The RSI just entered negative territory. Granted the 200-day EMA has provided some support, but with indicators failing we are looking for more downside.
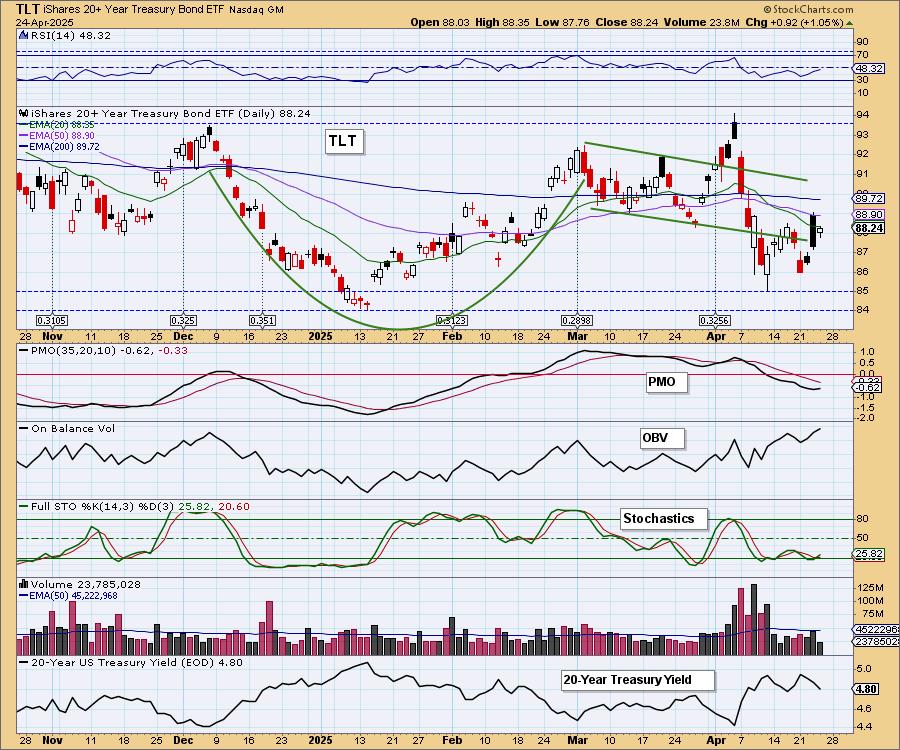
BONDS (TLT)
IT Trend Model: SELL as of 4/14/2025
LT Trend Model: SELL as of 12/13/2024
TLT Daily Chart: So much for the bearish filled black candlesticks. We now see a bullish double bottom and now the PMO has turned up. Stochastics are also rising again. We should see some rally here.

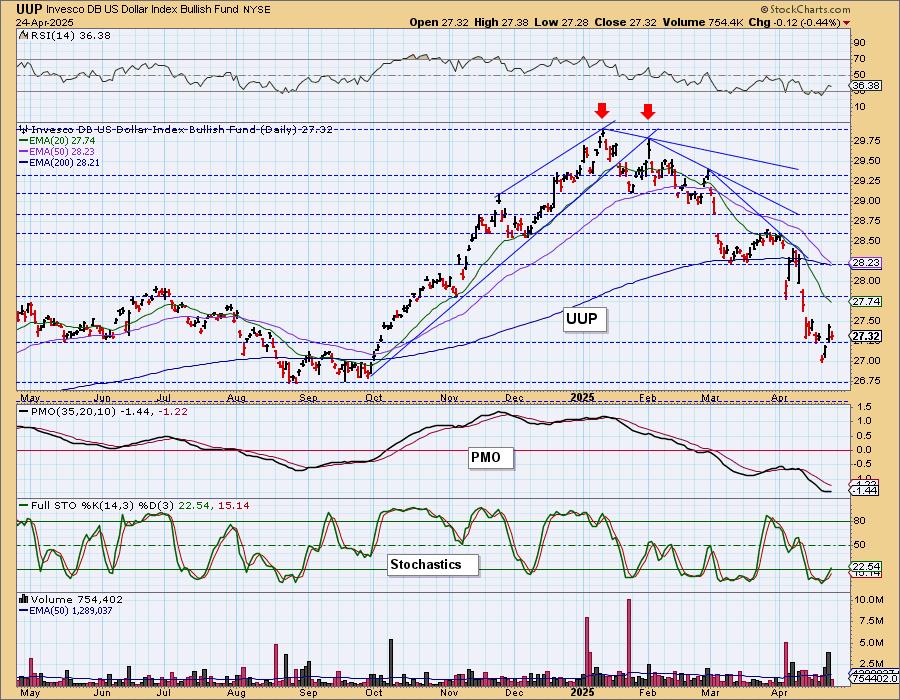
DOLLAR (UUP)
IT Trend Model: NEUTRAL as of 3/5/2025
LT Trend Model: BUY as of 5/25/2023
UUP Daily Chart: The Dollar stalled today but didn't lose that much ground. It still has tremendous work to do. The PMO is flat and unresponsive so while the short-term declining trend has been broken, we're not so sure that we'll get an extended rally here. Stochastics are rising but are still in negative territory. Look for more sideways movement.
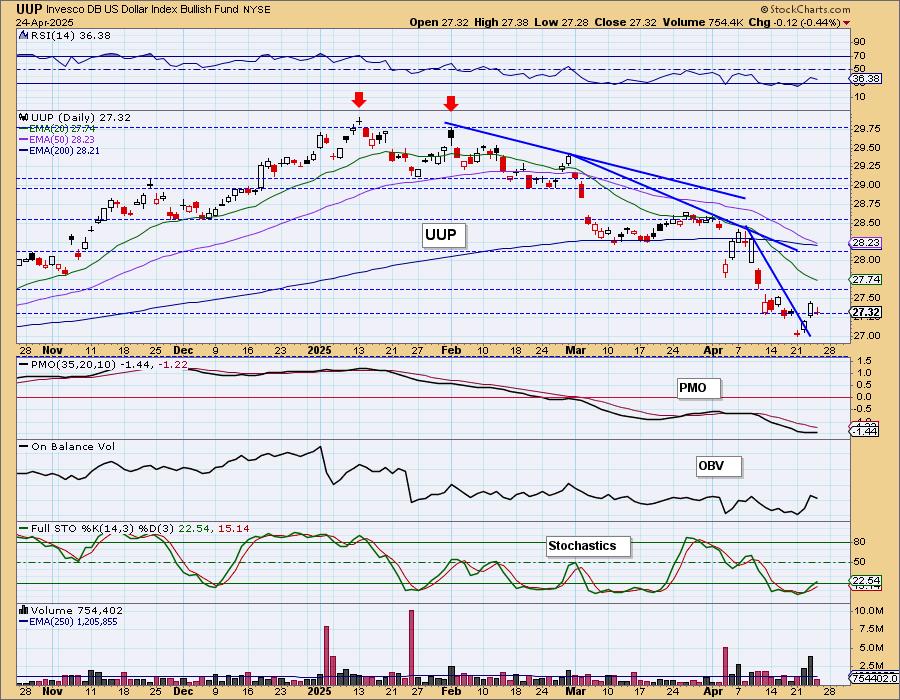
Price is rebounding not far off support so it is possible it will have a more meaningful rally.
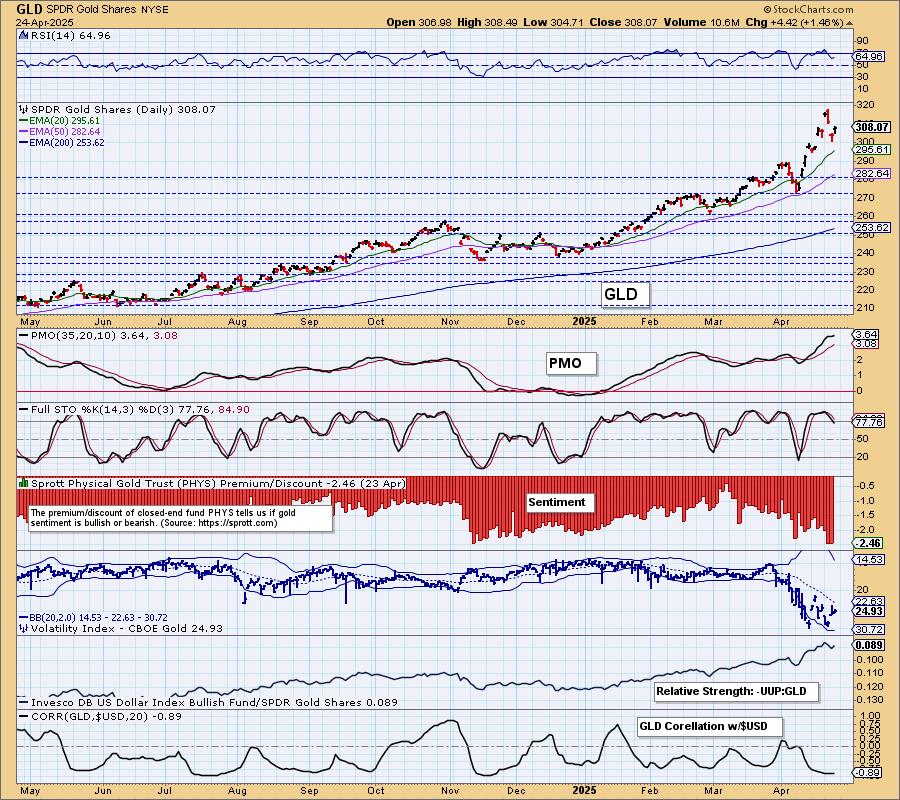
GOLD
IT Trend Model: BUY as of 1/10/2025
LT Trend Model: BUY as of 10/20/2023
GLD Daily Chart: Gold rallied and we wouldn't be surprised if it is back to the races. The PMO is accelerating again and it isn't overbought as far as the RSI is concerned. Stochastics however are still falling. With mixed indicators, we'll look for sideways consolidation.
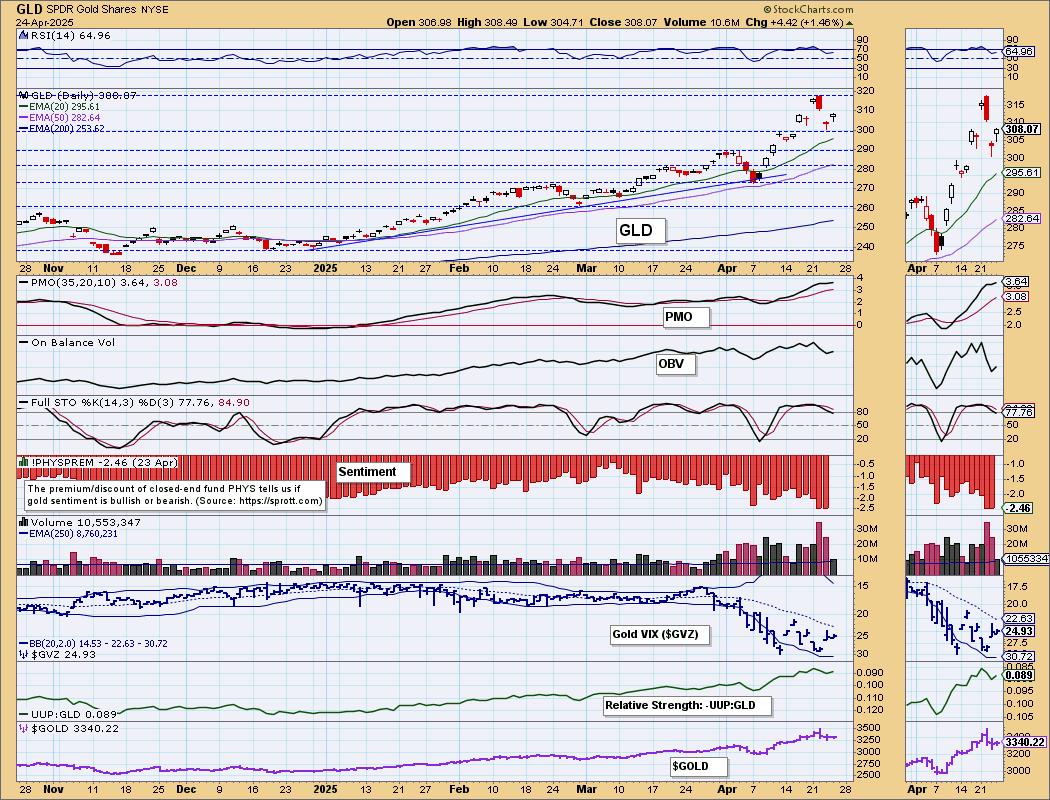
The inverse correlation between Gold and the Dollar is strong. The Dollar is showing signs of waking, but really when you look at both charts, they seem to point to sideways movement more than anything else.
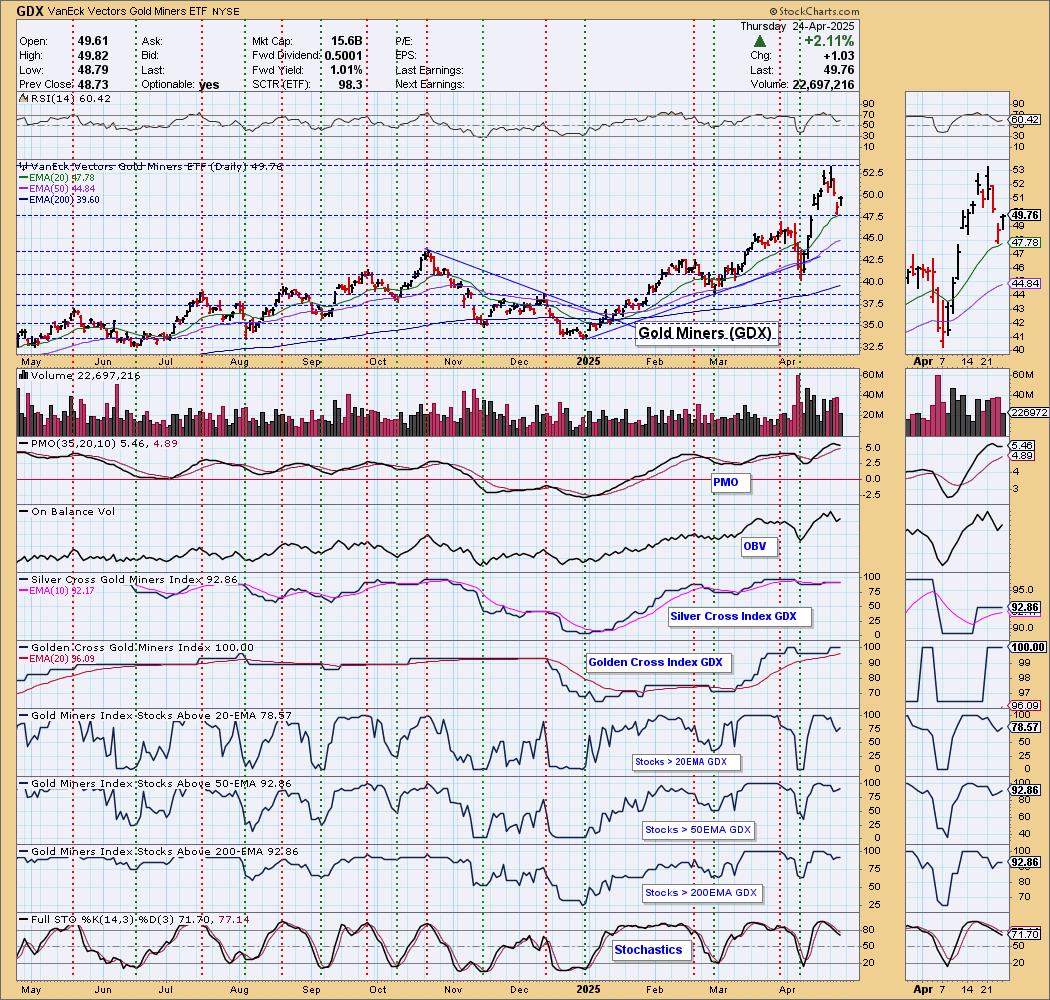
GOLD MINERS (GDX) Daily Chart: Gold Miners had a good day on the back of rising Gold prices. It has reversed on gap resistance which is positive. They are no longer overbought based on the RSI so they could rally from here. Participation is strong enough, but we don't think Gold is done with its consolidation or even decline. For now we expect another move down based on falling Stochastics.
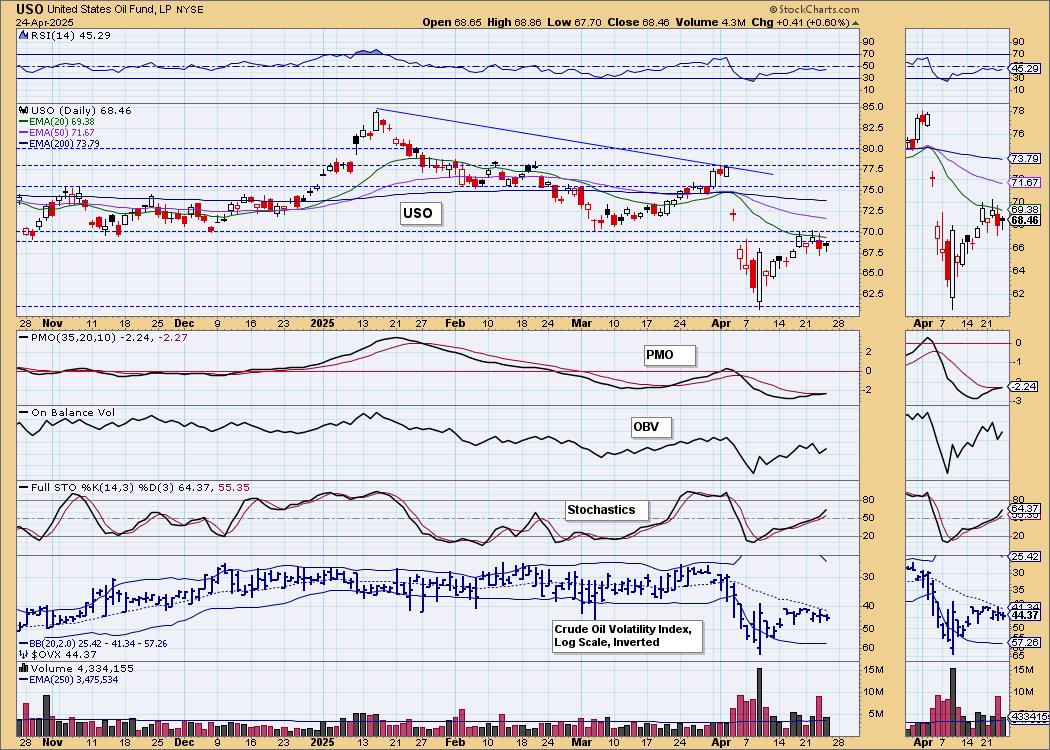
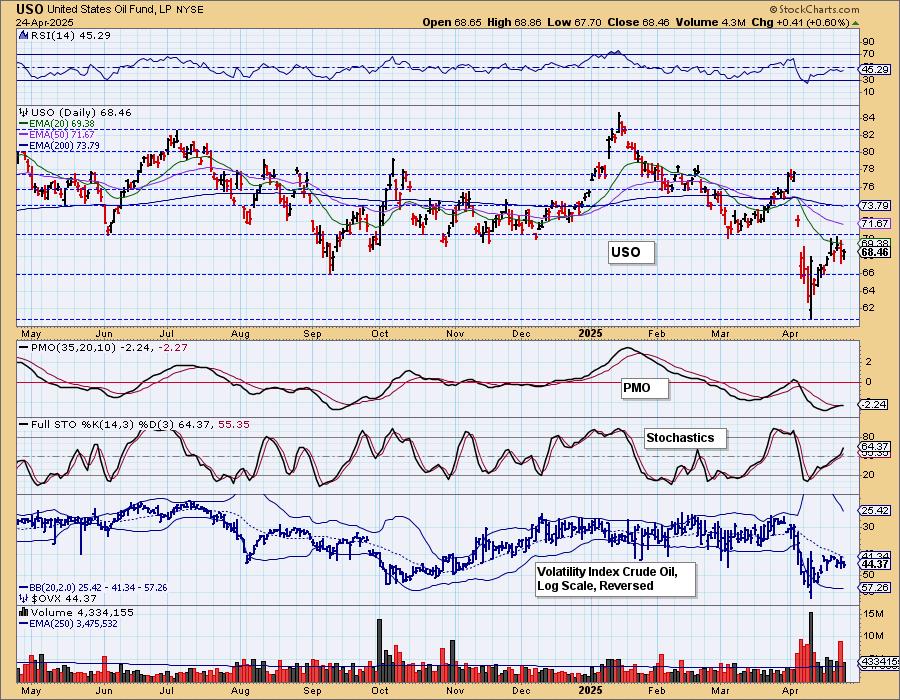
CRUDE OIL (USO)
IT Trend Model: NEUTRAL as of 2/27/2025
LT Trend Model: SELL as of 3/18/2025
USO Daily Chart: Yesterday's comments still apply:
"We had a feeling that Crude would run into problems at the resistance zone. We would look for the rally to fail. The Crude Volatility Index ($OVX) is oscillating below its moving average on the inverted scale that could indicate internal weakness. The PMO and Stochastics look bullish, but neither is rocketing higher. This strikes us as diminishing weakness not necessarily new strength."
Good Luck & Good Trading!
Erin Swenlin and Carl Swenlin
Technical Analysis is a windsock, not a crystal ball. --Carl Swenlin
(c) Copyright 2025 DecisionPoint.com
Disclaimer: This blog is for educational purposes only and should not be construed as financial advice. The ideas and strategies should never be used without first assessing your own personal and financial situation, or without consulting a financial professional. Any opinions expressed herein are solely those of the author, and do not in any way represent the views or opinions of any other person or entity.
DecisionPoint is not a registered investment advisor. Investment and trading decisions are solely your responsibility. DecisionPoint newsletters, blogs or website materials should NOT be interpreted as a recommendation or solicitation to buy or sell any security or to take any specific action.
NOTE: The signal status reported herein is based upon mechanical trading model signals, specifically, the DecisionPoint Trend Model. They define the implied bias of the price index based upon moving average relationships, but they do not necessarily call for a specific action. They are information flags that should prompt chart review. Further, they do not call for continuous buying or selling during the life of the signal. For example, a BUY signal will probably (but not necessarily) return the best results if action is taken soon after the signal is generated. Additional opportunities for buying may be found as price zigzags higher, but the trader must look for optimum entry points. Conversely, exit points to preserve gains (or minimize losses) may be evident before the model mechanically closes the signal.
Helpful DecisionPoint Links:
DecisionPoint Alert Chart List
DecisionPoint Golden Cross/Silver Cross Index Chart List
DecisionPoint Sector Chart List
Price Momentum Oscillator (PMO)