
Today the Energy Sector ETF (XLE) 20-day EMA crossed down through the 50-day EMA (Dark Cross) above the 200-day EMA, generating an IT Trend Model NEUTRAL Signal. Support has been lost and Crude is spiraling downward. This sector is likely to continue to be hit hard. We have no stocks above their 20/50-day EMAs and only 18% above their 200-day EMAs. Granted these are oversold readings, but in a bear market those readings can easily persist.
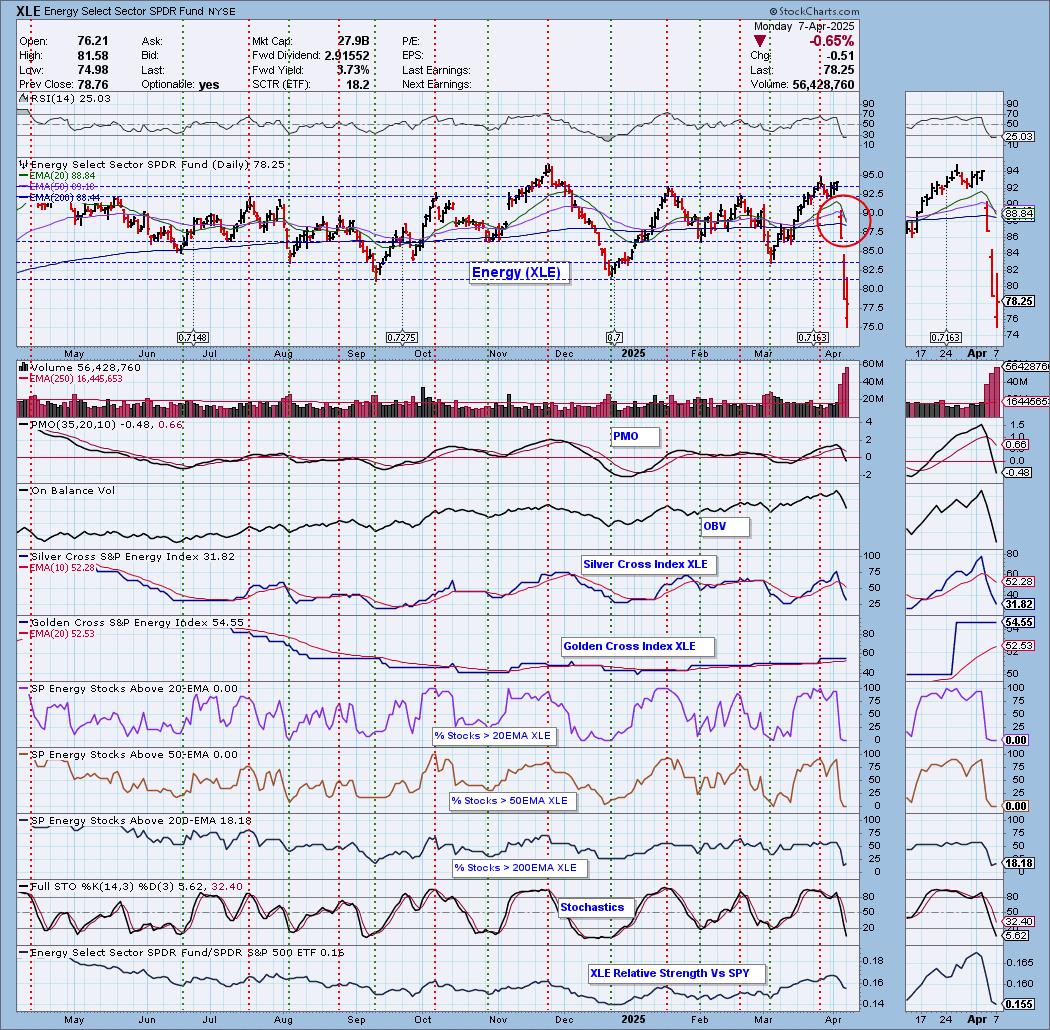
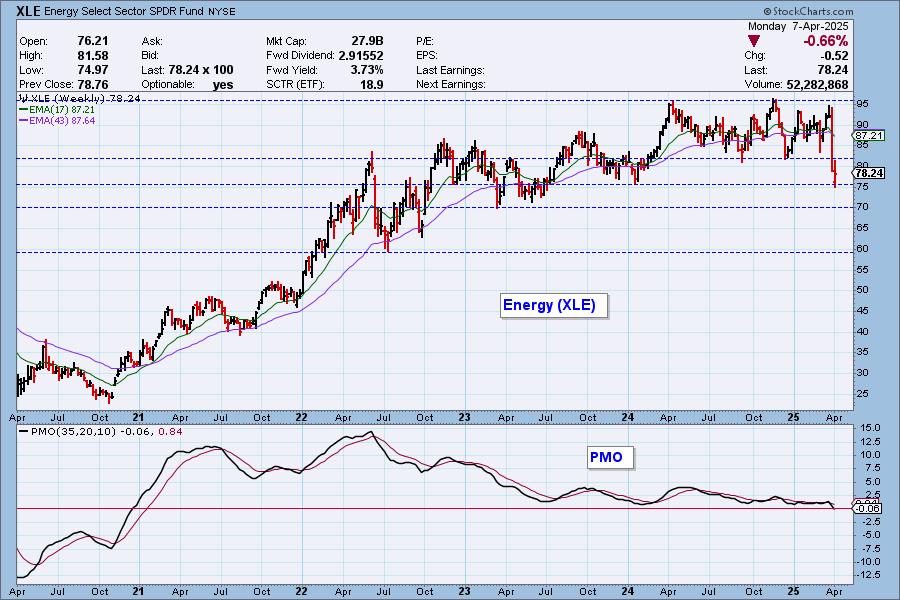
Energy has been in a period of consolidation, but has now lost the first line of support. This level looks highly vulnerable. The weekly PMO has now hit negative territory. One way to play the inverse of Energy is using the Energy Bear 2x ETF (ERY) however, support is arriving at 70 so tread carefully.
__________
Today the Utilities Sector ETF (XLU) 20-day EMA crossed down through the 50-day EMA (Dark Cross) above the 200-day EMA, generating an IT Trend Model NEUTRAL Signal. XLU has been in a sideways trading range for some time and it caused some whipsaw on our IT Trend Model. Strong support was lost today, but the next level of support looks fairly sturdy around 70. Participation is in the tank and Stochastics are diving so that level is vulnerable.
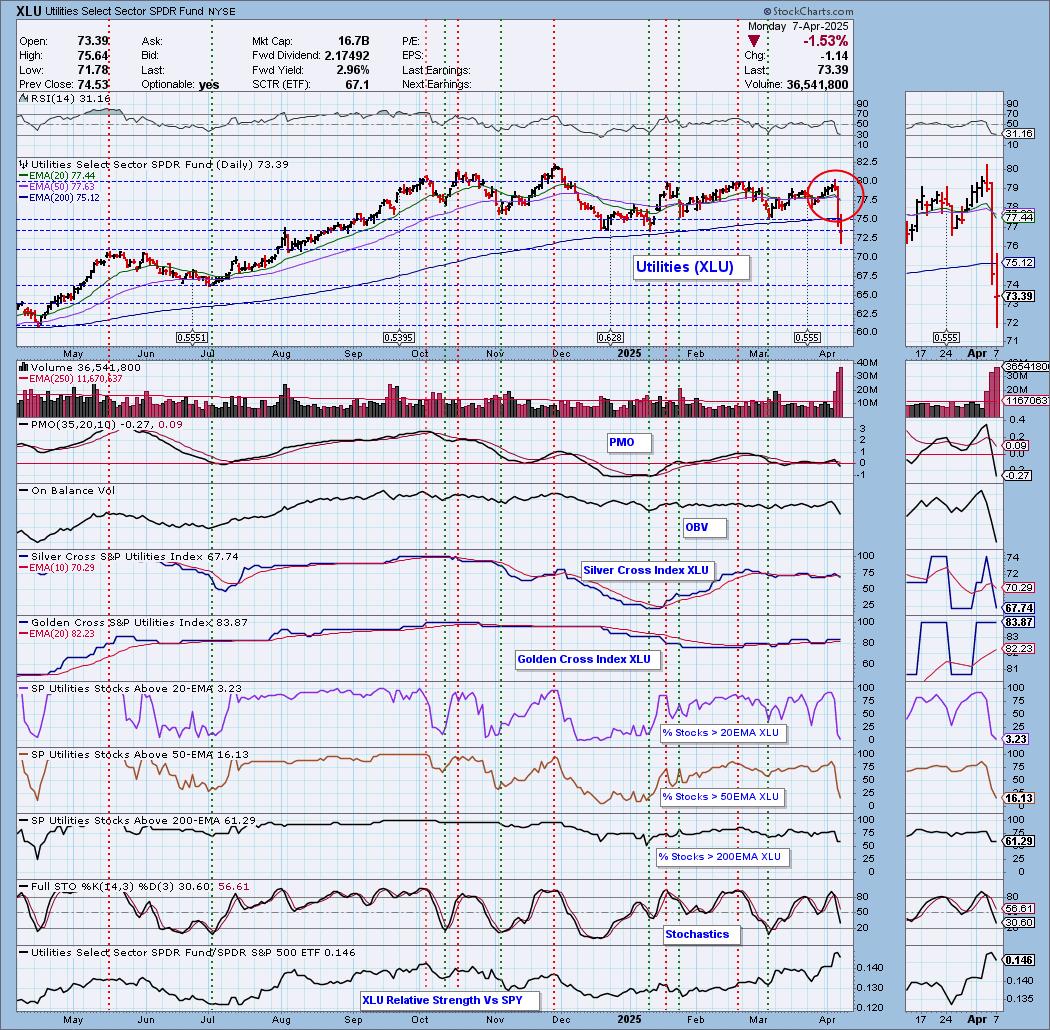
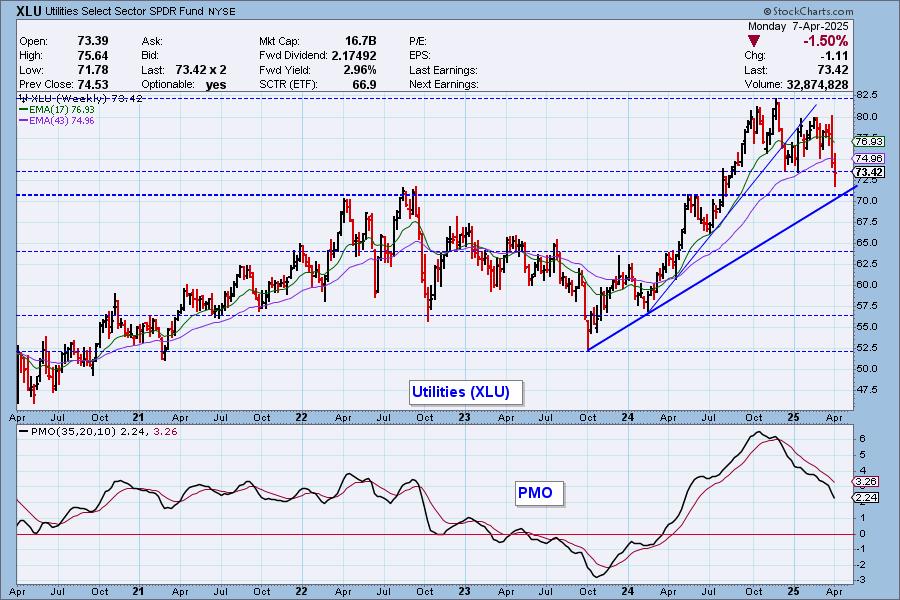
The long-term rising bottoms trendline is about to be tested. It coincides with strong support at 70 so we could see a reversal. The weekly PMO doesn't inspire confidence though.
The DecisionPoint Alert Weekly Wrap presents an end-of-week assessment of the trend and condition of the Stock Market, the U.S. Dollar, Gold, Crude Oil, and Bonds. The DecisionPoint Alert daily report (Monday through Thursday) is abbreviated and gives updates on the Weekly Wrap assessments.
MARKET/INDUSTRY GROUP/SECTOR INDEXES
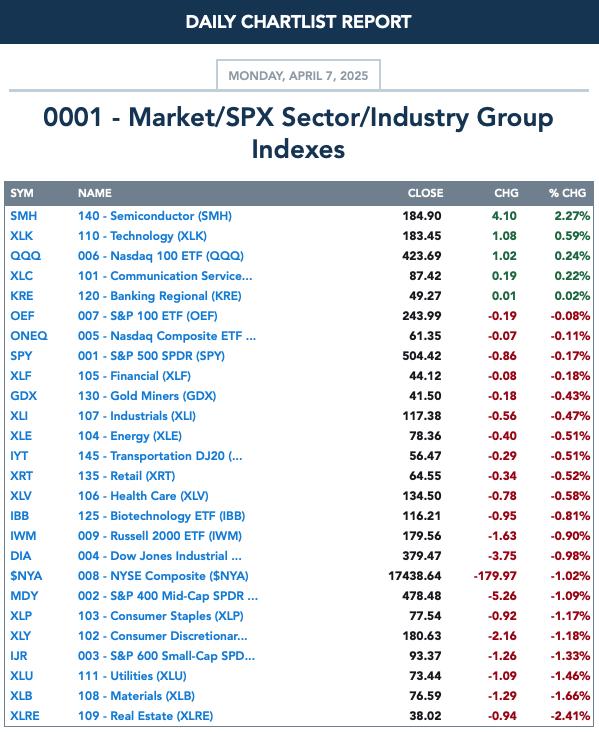
CLICK HERE for Carl's annotated Market Index, Sector, and Industry Group charts.
THE MARKET (S&P 500)
IT Trend Model: NEUTRAL as of 3/4/2025
LT Trend Model: BUY as of 3/29/2023
SPY 10-Minute Chart: It was a rocky trading session, apparently the volatility was the most we've seen since 2020. Early in the day we saw a strong reversal, but this was on a false rumor that tariffs might see a 90-day pause. The White House quashed that rumor rather quickly and the decline continued. The market did even out to finish the day only slightly down.

SPY Daily Chart: Price is now flirting with official bear market territory (20%+ decline). In especially bearish fashion, price broke down out of an already declining trend channel. On the bright side, we have a bullish hollow red candlestick and an oversold RSI that could be signaling a possible snapback in the future.

The VIX spiked lower on our inverted scale as extreme volatility was injected into the market today. This could suggest a possible upside reversal ahead, but we wouldn't expect much to come from it at this point. Stochastics are below 20 signaling extreme internal weakness.

S&P 500 New 52-Week Highs/Lows: We saw no New Highs today so no one is going unscathed. New Lows have spiked and that could also imply a short-term bottom. The High-Low Differential is highly negative as it is declining vertically.
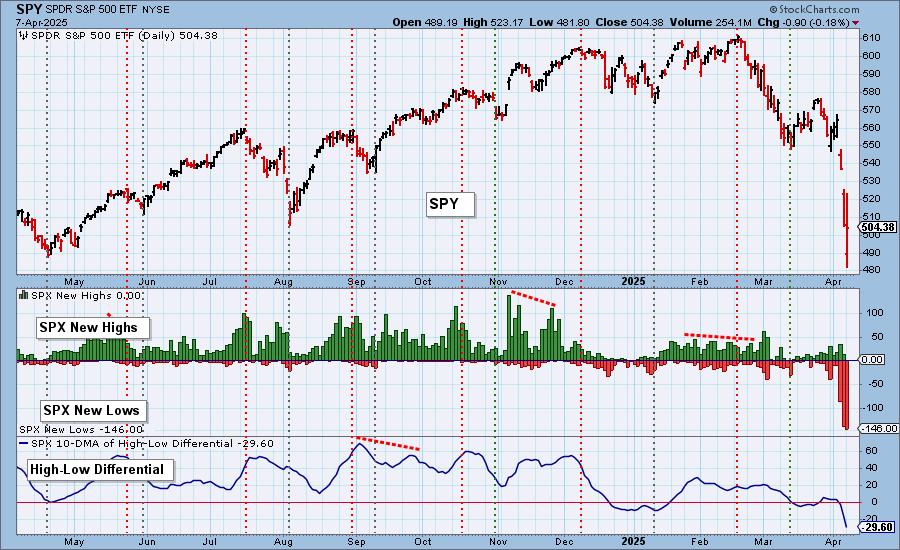
Climax* Analysis: There were no climax readings today. SPX Total Volume was 250% of the one-year daily average volume, easily qualifying as blowout volume. This points toward a price bottom having been made for the time being, so we're looking for a bounce.
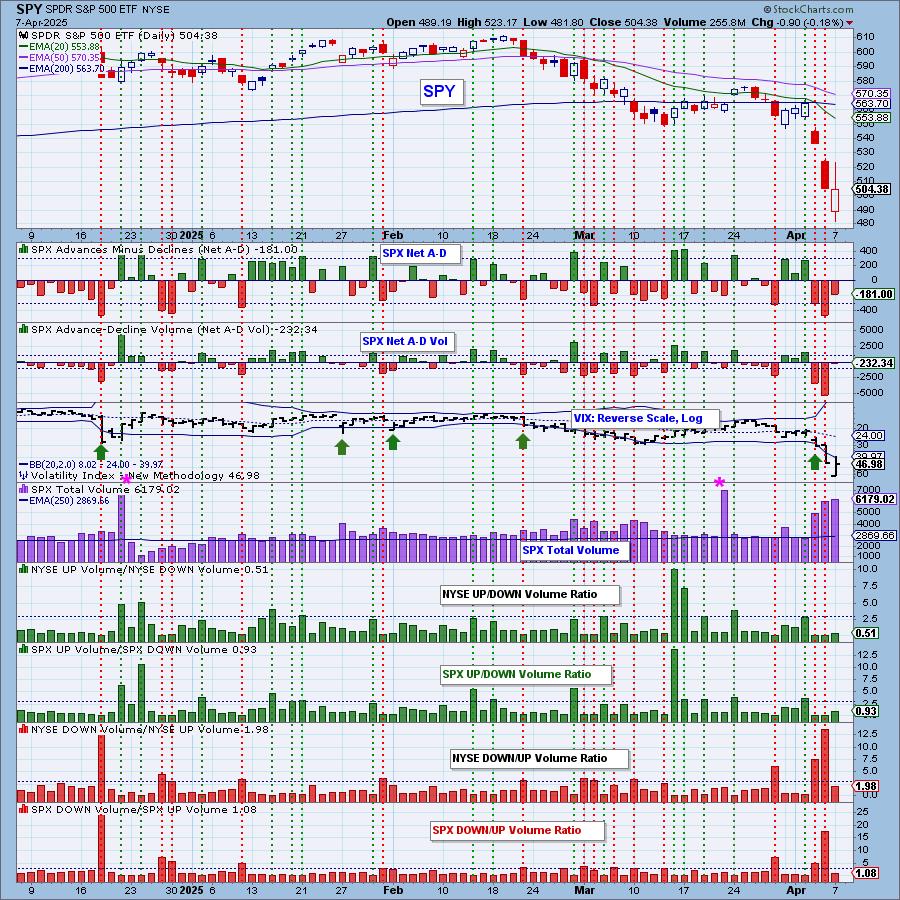
*A climax is a one-day event when market action generates very high readings in, primarily, breadth and volume indicators. We also include the VIX, watching for it to penetrate outside the Bollinger Band envelope. The vertical dotted lines mark climax days -- red for downside climaxes, and green for upside. Climaxes are at their core exhaustion events; however, at price pivots they may be initiating a change of trend.
Short-Term Market Indicators: The short-term market trend is DOWN and the condition is SOMEWHAT OVERSOLD.
The Swenlin Trading Oscillators (STOs) are declining as we would expect right now. We are listing them as "somewhat oversold" right now, but they can certainly accommodate far more downside. We have less than 2% with price above the 20-day EMA which is exceedingly weak. Only 2% of the index show rising momentum which is not going to help dig the index out of the current hole. It is oversold, no doubt, but we also know these conditions can persist in a bear market situation. It does tell us that this decline may be overdone.
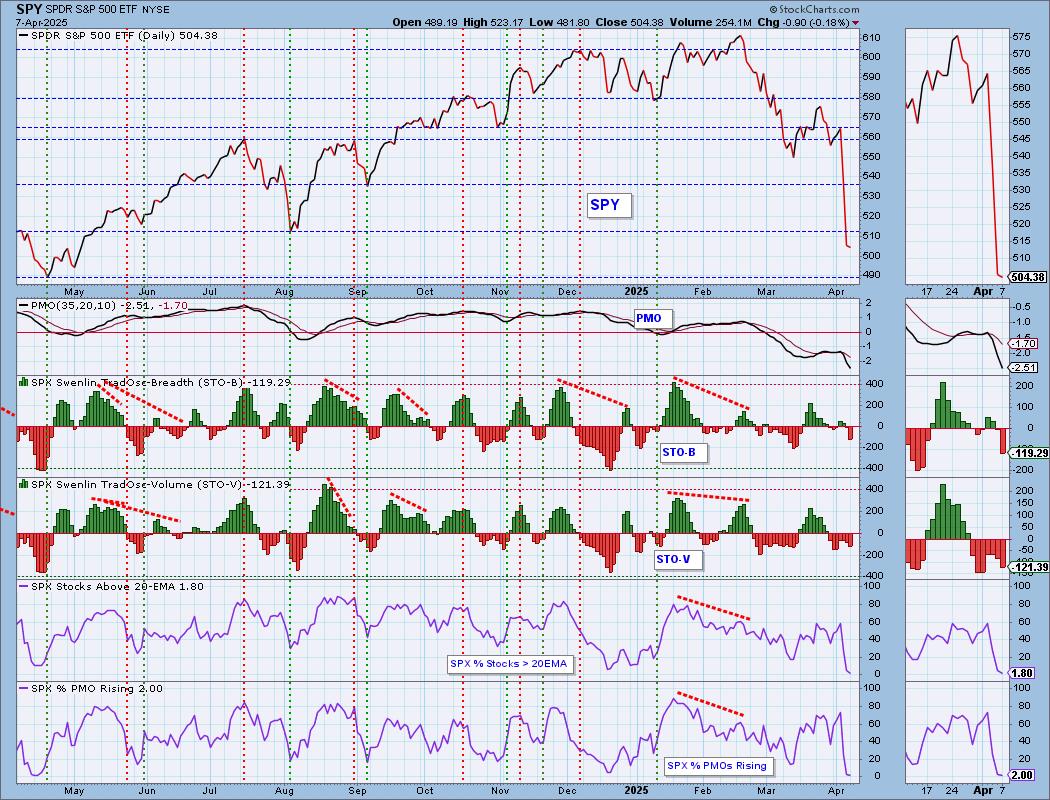
Intermediate-Term Market Indicators: The intermediate-term market trend is DOWN and the condition is NEUTRAL.
The ITBM hit negative territory today on its decline and the ITVM continued to fall. A mere 9% hold PMO Crossover BUY Signals and with only 2% showing rising PMOs, that indicator is likely to move even lower. It is also clearly oversold.

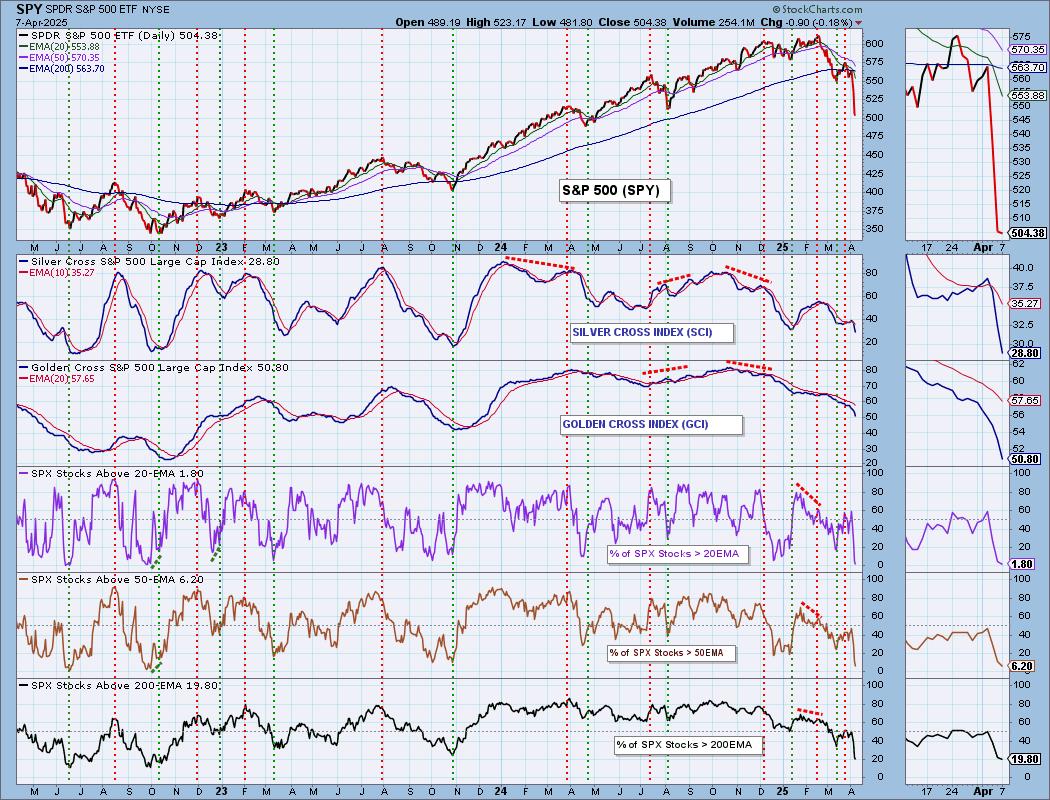
PARTICIPATION CHART (S&P 500): The following chart objectively shows the depth and trend of participation for the SPX in two time frames.
- Intermediate-Term - the Silver Cross Index (SCI) shows the percentage of SPX stocks on IT Trend Model BUY signals (20-EMA > 50-EMA). The opposite of the Silver Cross is a "Dark Cross" -- those stocks are, at the very least, in a correction.
- Long-Term - the Golden Cross Index (GCI) shows the percentage of SPX stocks on LT Trend Model BUY signals (50-EMA > 200-EMA). The opposite of a Golden Cross is the "Death Cross" -- those stocks are in a bear market.
The market bias is BEARISH in the intermediate and long terms.
Participation has been slashed and has now moved into oversold territory. We lost an incredible number of stocks above their 200-day EMA. Even that indicator is oversold, though it could get more oversold given we are likely in a bear market for the SPY. The Silver Cross Index is now falling vertically lower and the Golden Cross Index continues to lose ground. We aren't oversold on the Golden Cross Index yet so this bear market is likely to have staying power. Both the Silver Cross Index and Golden Cross Index are below their signal lines so the IT and LT Biases are BEARISH.
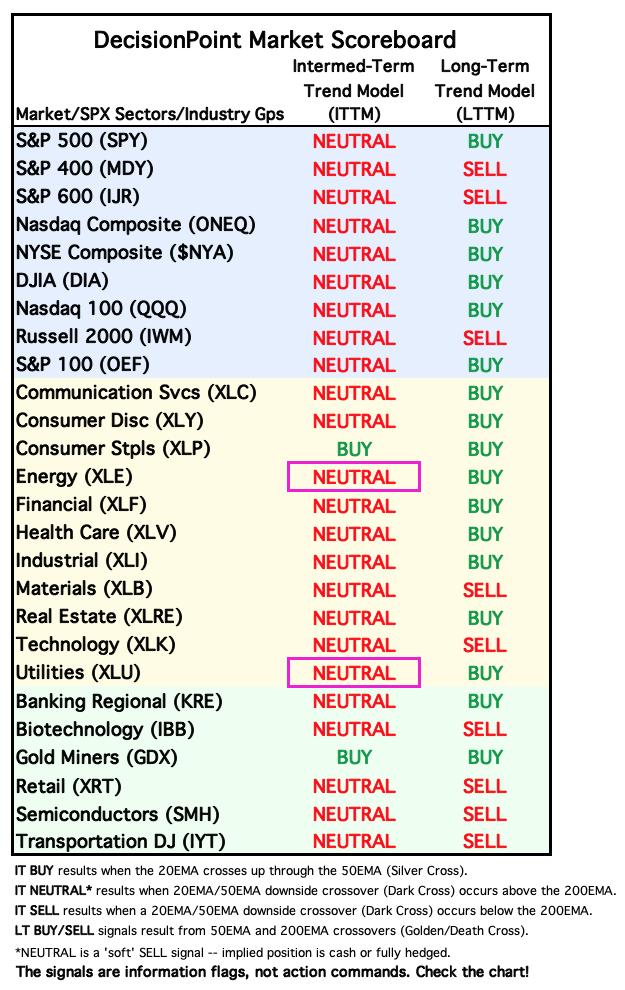
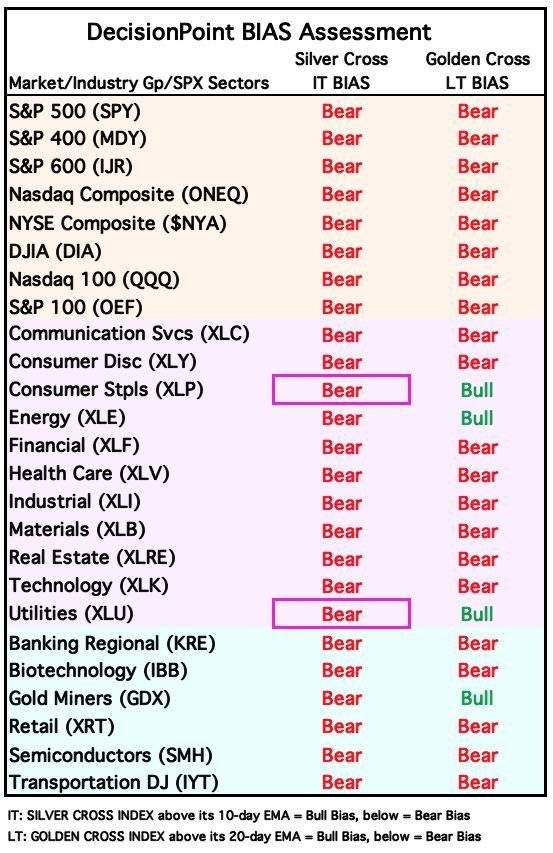
BIAS Assessment: The following table expresses the current BIAS of various price indexes based upon the relationship of the Silver Cross Index to its 10-day EMA (intermediate-term), and of the Golden Cross Index to its 20-day EMA (long-term). When the Index is above the EMA it is bullish, and it is bearish when the Index is below the EMA. The BIAS does not imply that any particular action should be taken. It is information to be used in the decision process.
The items with highlighted borders indicate that the BIAS changed today.
*****************************************************************************************************
CONCLUSION: The Bias Table above is now showing bearish for all entities in the intermediate term. We have incredible market weakness based on participation that has been slashed. We are in a bear market as far as we're concerned and there will be more pain to absorb. However, we do believe this decline has been overdone in the short term. The RSI agrees as it is now oversold. We should see some sort of a bounce soon, but we don't believe it will result in much upside. Yes, conditions are oversold, but in bear markets that can be considered thin ice or basically not a strong foundation for a meaningful rally. We suspect we will see oversold conditions persist, but for now with this strong decline, it is time for some kind of snapback.
Erin is 10% long, 0% short. (This is intended as information, not a recommendation.)
*****************************************************************************************************
CALENDAR
BITCOIN
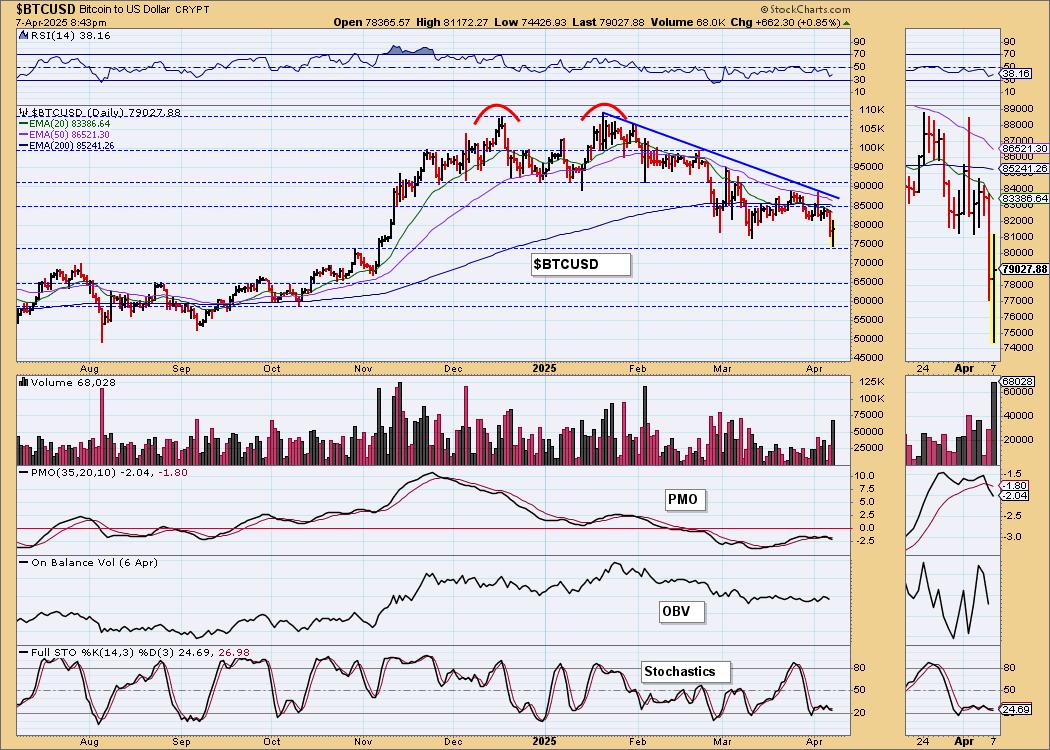
Bitcoin had a terrible weekend and that put Bitcoin ETFs severely in the red today in spite of today's mild bounce. The declining trend is strong. The PMO has triggered a Crossover SELL Signal below the zero line which is especially bearish. Stochastics are hovering in negative territory. This is a strong area of support, but we suspect that price is headed toward 65,000.
BITCOIN ETFs

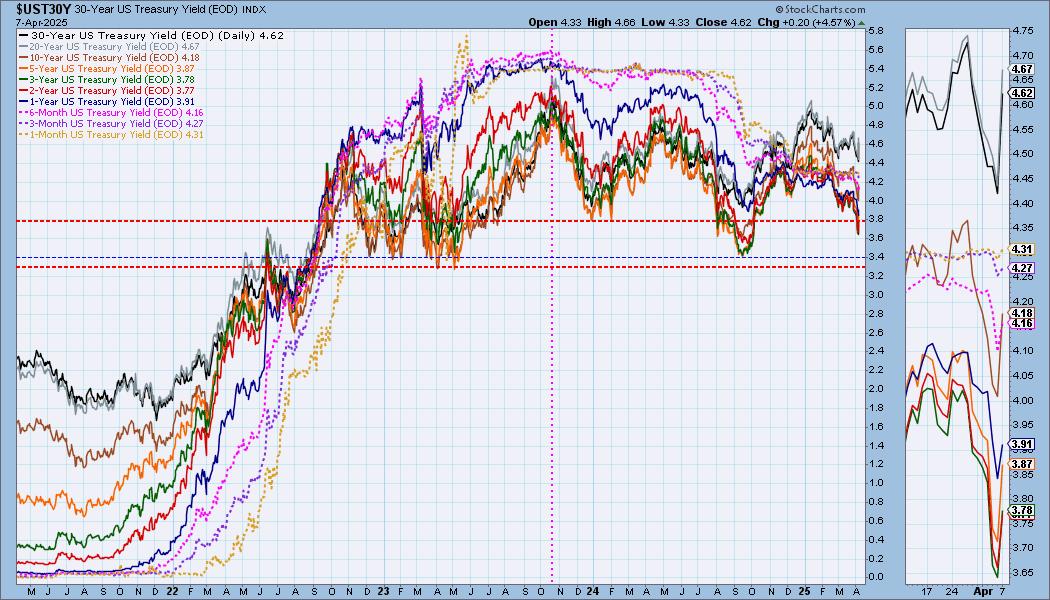
INTEREST RATES
Yields rocketed higher today, but they are still in declining trends so we are expecting them to move lower.
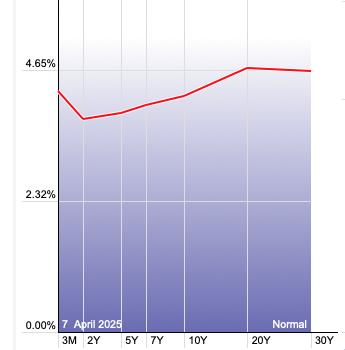
The Yield Curve Chart from StockCharts.com shows us the inversions taking place. The red line should move higher from left to right. Inversions are occurring where it moves downward.
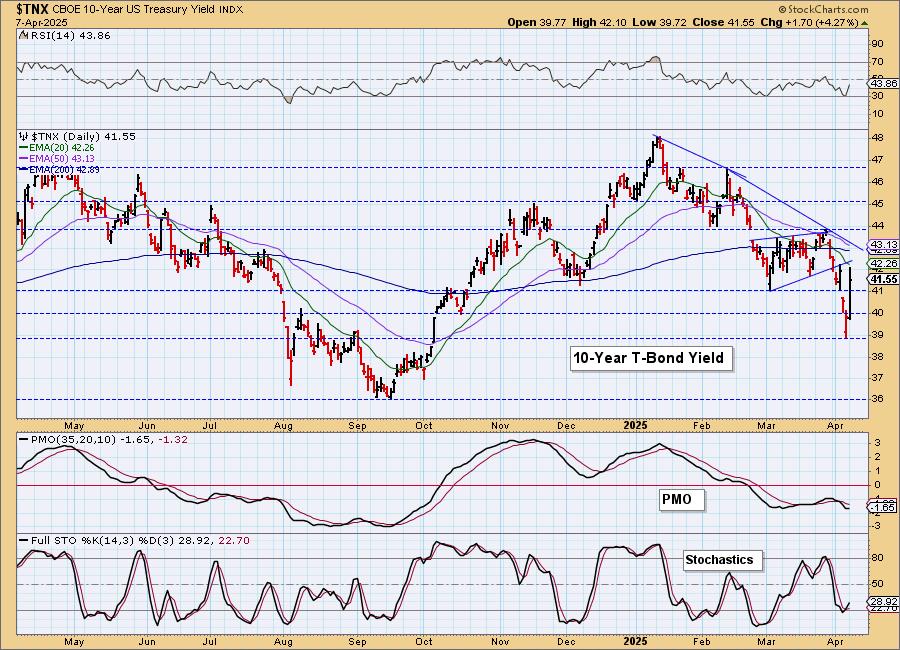
10-YEAR T-BOND YIELD
$TNX rebounded big time today, but ultimately the declining trend is intact. Stochastics did turn back up and the PMO flattened, but given investors are likely to move to Bonds as the bear market continues, we expect yields will stay in a declining trend.

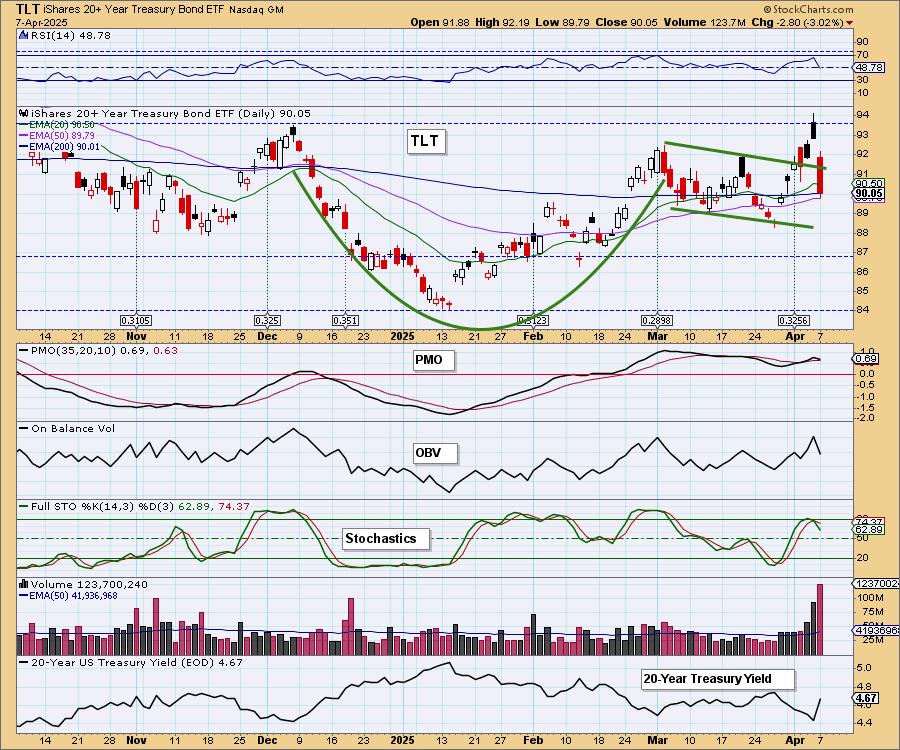
BONDS (TLT)
IT Trend Model: BUY as of 2/25/2025
LT Trend Model: SELL as of 12/13/2024
TLT Daily Chart: The bullish cup with handle pattern is failing, but we aren't going to call it busted yet. We like Bonds moving forward and believe this is a temporary condition. We may see more sloppy sideways trading though if the market rebounds.

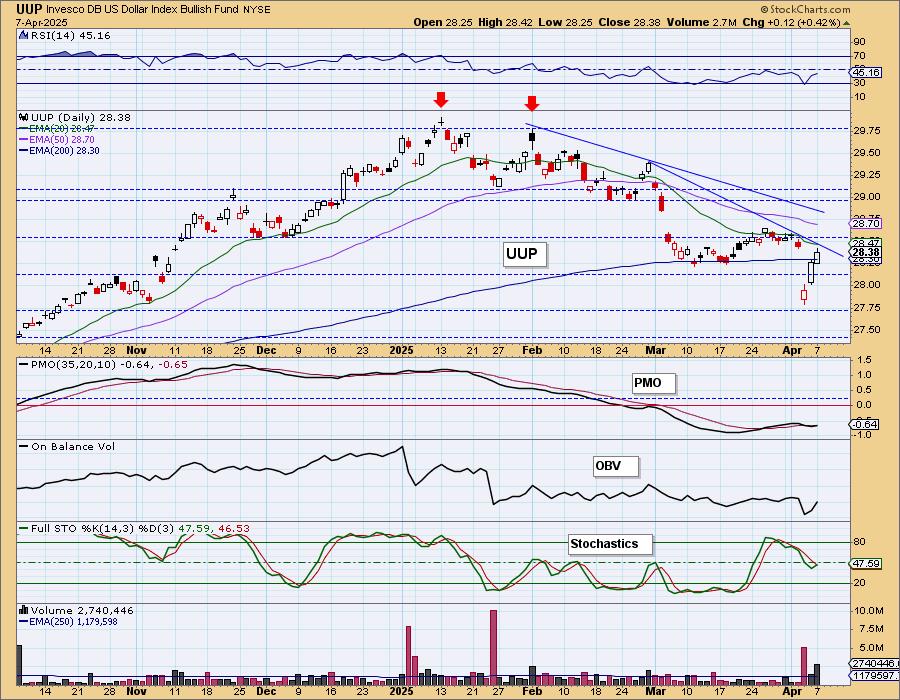
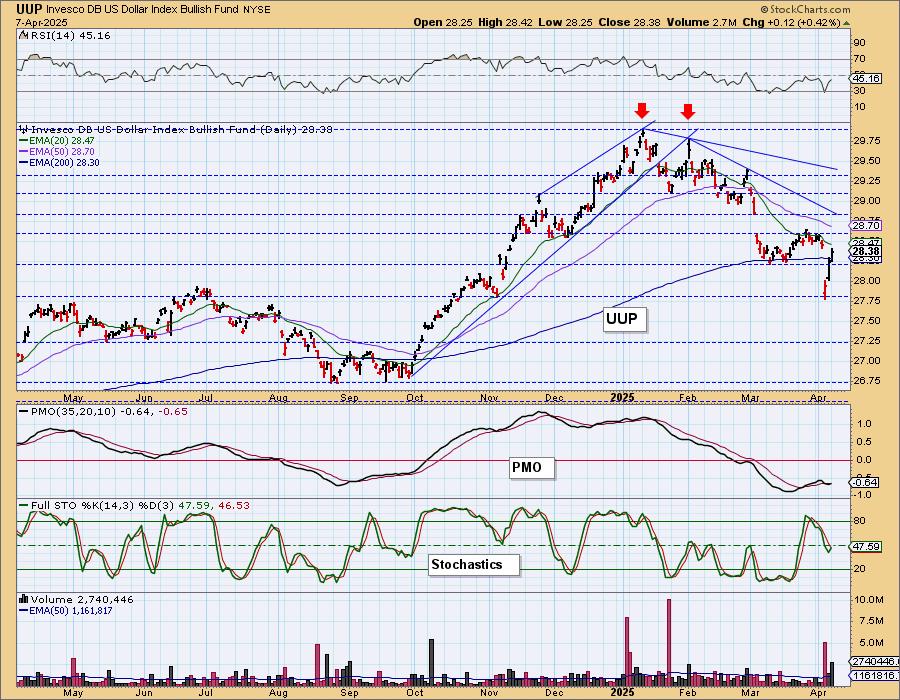
DOLLAR (UUP)
IT Trend Model: NEUTRAL as of 3/5/2025
LT Trend Model: BUY as of 5/25/2023
UUP Daily Chart: The Dollar is rebounding after its precipitous decline on Thursday. We're unsure how tariffs will affect the Dollar as it dropped on the news but is rebounding even with the news. Price will be testing a shorter-term declining trendline soon. The PMO is on a brand new Crossover BUY Signal and Stochastics have turned up so at this point we will look for more rally here.
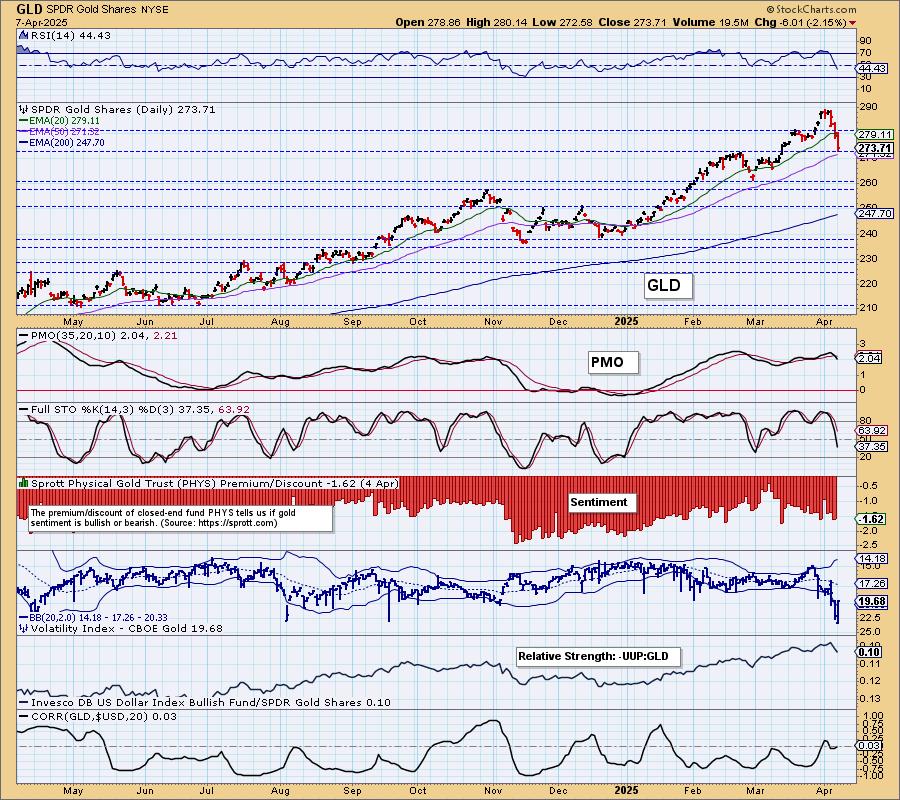
GOLD
IT Trend Model: BUY as of 1/10/2025
LT Trend Model: BUY as of 10/20/2023
GLD Daily Chart: Gold fell beneath the rising bottoms trendline on the rally in the Dollar. It was a painful decline. We still believe Gold is the place to be in the long term, but it may have more decline to absorb in the short term. The PMO looks especially bearish and the RSI has moved into negative territory.
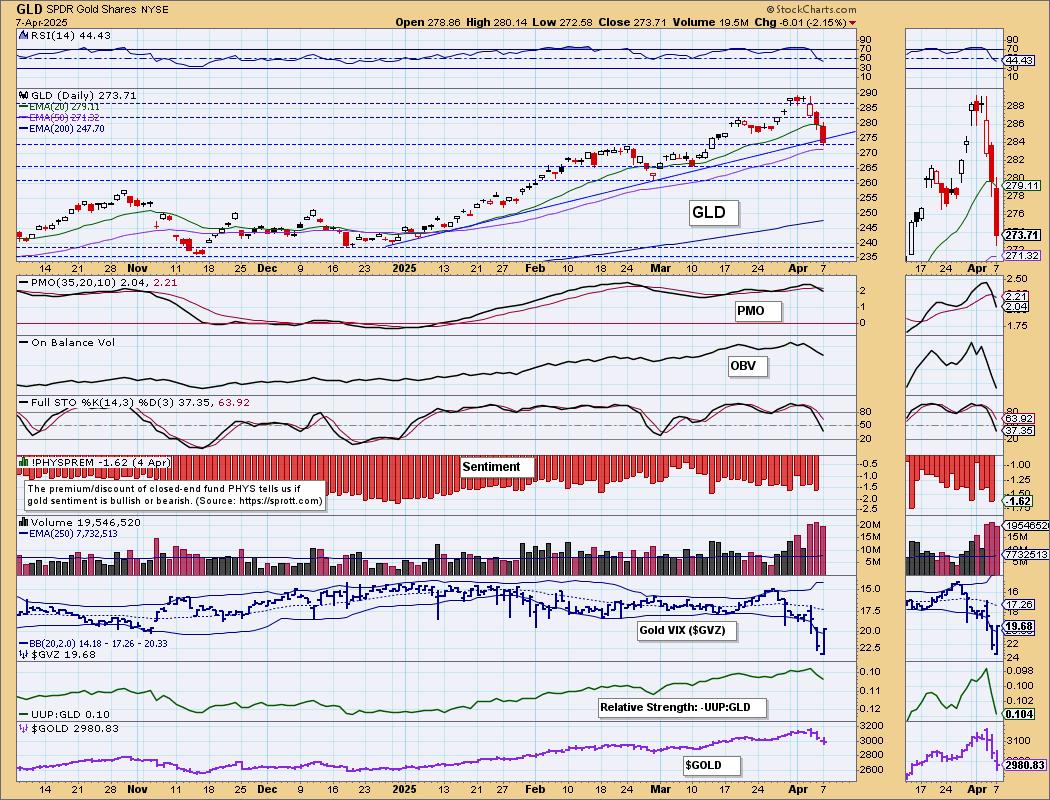
Relative strength to the Dollar is deteriorating and this will cause more trouble for Gold. Stochastics look particularly negative so while we are sitting on strong support, we do think it will fall further from here.
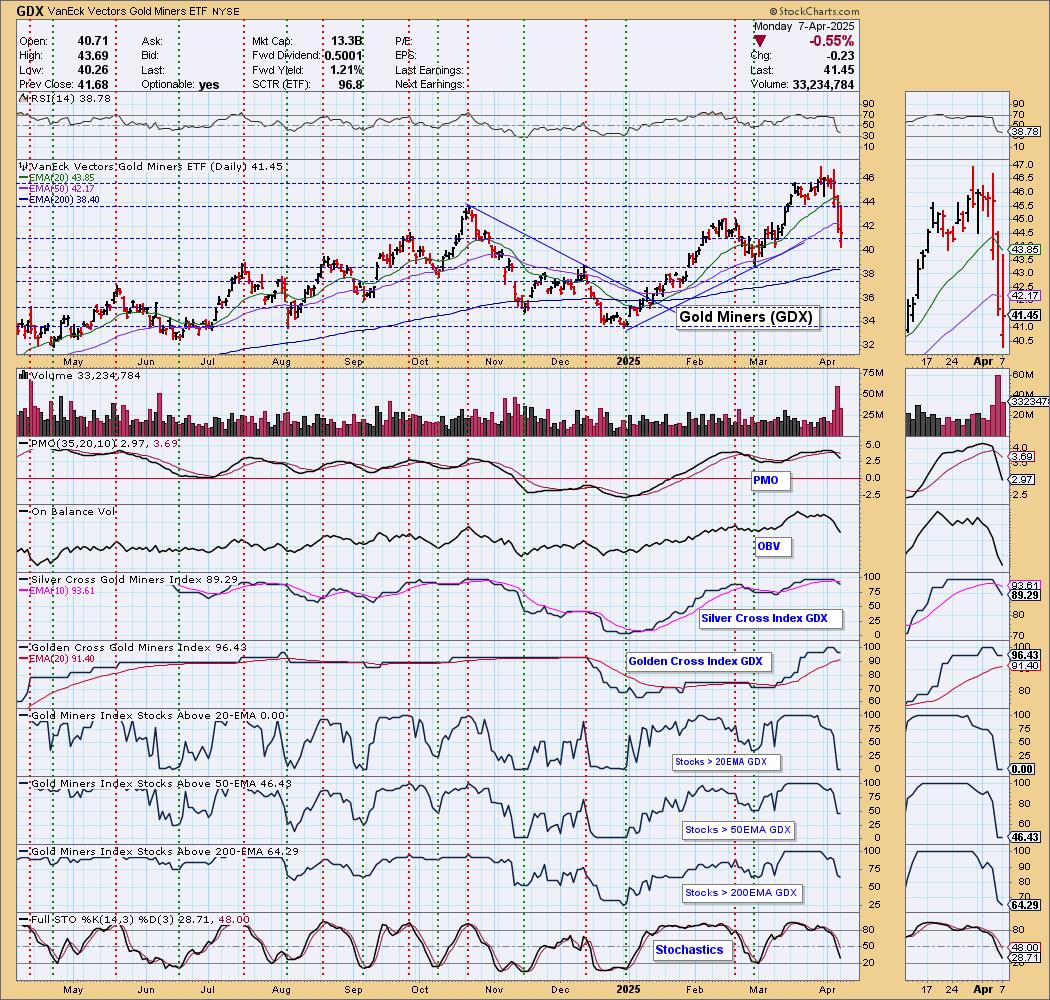
GOLD MINERS (GDX) Daily Chart: Being bearish on Gold means being bearish on Gold Miners which are highly sensitive to Gold prices. They are pulling back and have lost their rising trend. Participation was sucked out of the group and the Silver Cross Index has had a Bearish Shift across the signal line. We would look for a test at the early March low. We don't think it is out of the question that we could see it drop further from there. A market reversal could offer them an opportunity to rally, but Gold really needs to be on their side to get back to previous highs.
CRUDE OIL (USO)
IT Trend Model: NEUTRAL as of 2/27/2025
LT Trend Model: SELL as of 3/18/2025
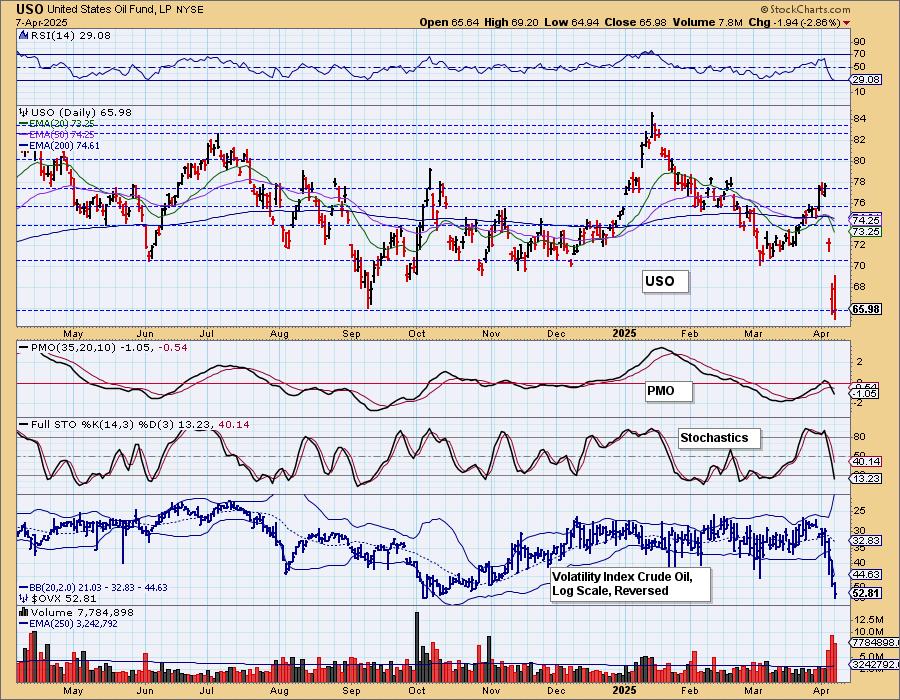
USO Daily Chart: Crude Oil continued is flight lower. We have another bullish hollow red candlestick and the decline has been swift so we could see a small bounce off this level. The Crude Volatility Index ($OVX) is very oversold on our inverted scale so it is overdue for some kind of rally.
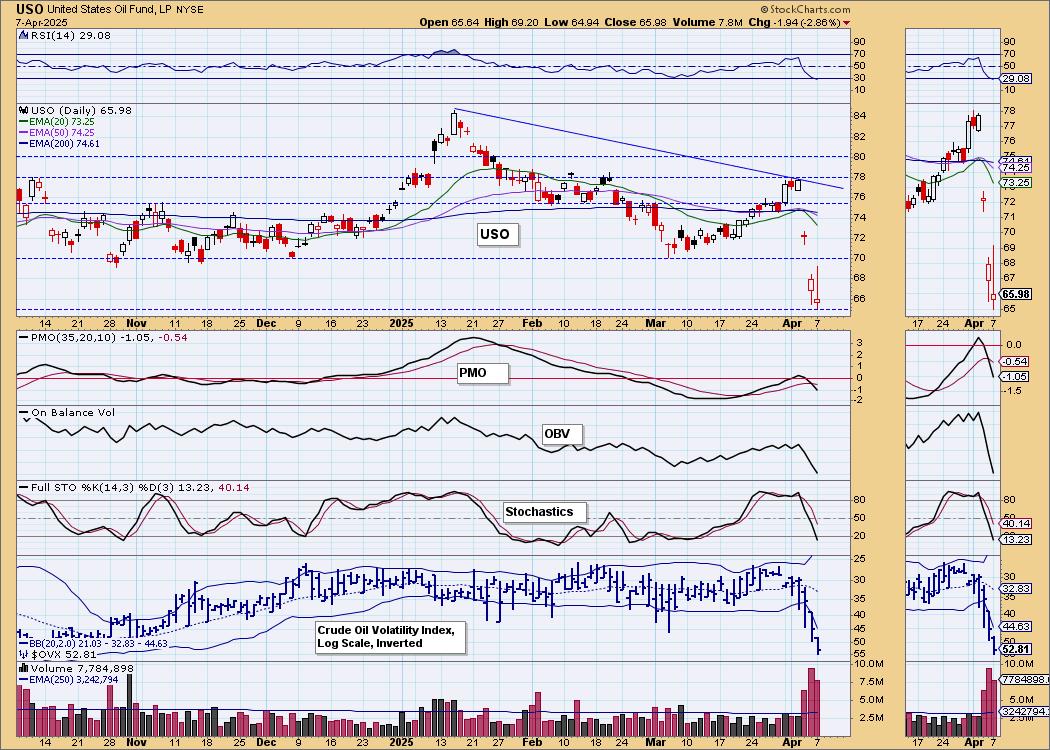
It has dropped below important support at the September low. This is a good area to get a little upside. It isn't likely that a bounce would turn into a good rally as fundamentals are suggesting lower Energy prices ahead as the administration works to keep prices low.
Good Luck & Good Trading!
Erin Swenlin and Carl Swenlin
Technical Analysis is a windsock, not a crystal ball. --Carl Swenlin
(c) Copyright 2025 DecisionPoint.com
Disclaimer: This blog is for educational purposes only and should not be construed as financial advice. The ideas and strategies should never be used without first assessing your own personal and financial situation, or without consulting a financial professional. Any opinions expressed herein are solely those of the author, and do not in any way represent the views or opinions of any other person or entity.
DecisionPoint is not a registered investment advisor. Investment and trading decisions are solely your responsibility. DecisionPoint newsletters, blogs or website materials should NOT be interpreted as a recommendation or solicitation to buy or sell any security or to take any specific action.
NOTE: The signal status reported herein is based upon mechanical trading model signals, specifically, the DecisionPoint Trend Model. They define the implied bias of the price index based upon moving average relationships, but they do not necessarily call for a specific action. They are information flags that should prompt chart review. Further, they do not call for continuous buying or selling during the life of the signal. For example, a BUY signal will probably (but not necessarily) return the best results if action is taken soon after the signal is generated. Additional opportunities for buying may be found as price zigzags higher, but the trader must look for optimum entry points. Conversely, exit points to preserve gains (or minimize losses) may be evident before the model mechanically closes the signal.
Helpful DecisionPoint Links:
DecisionPoint Alert Chart List
DecisionPoint Golden Cross/Silver Cross Index Chart List
DecisionPoint Sector Chart List
Price Momentum Oscillator (PMO)