
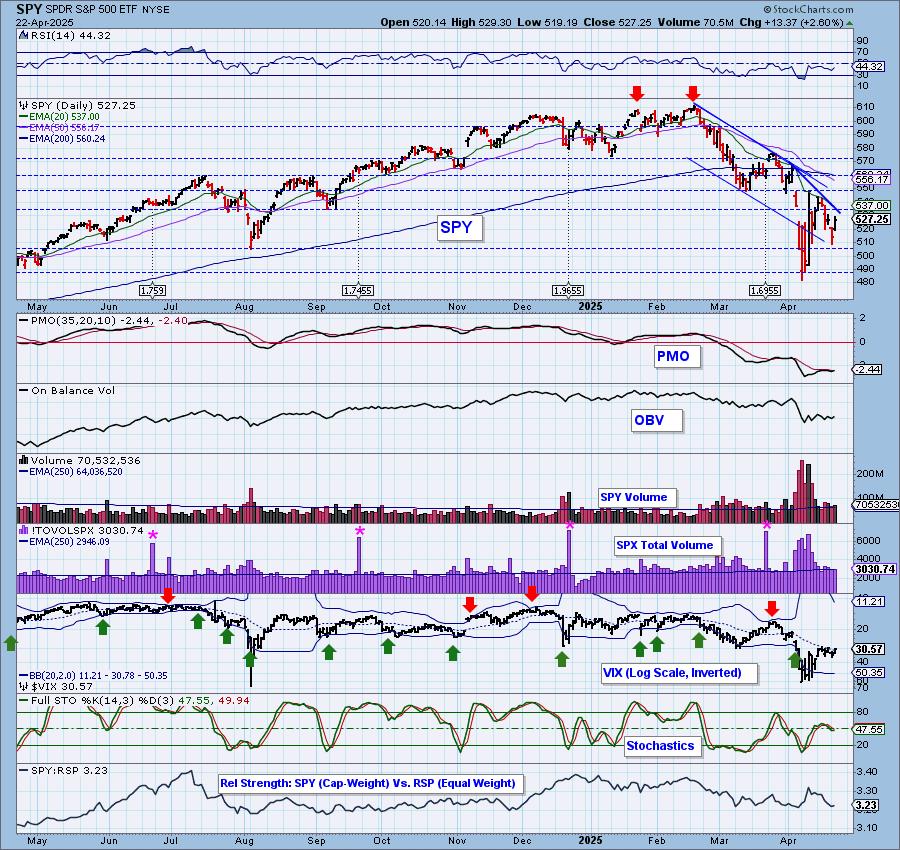
One of the indicators that we study is relative strength of the SPY versus equal-weight RSP. In the chart below, when RSP is showing relative strength, the mega-caps are underperforming. Given the weight of the SPY is highly affected by the performance of these top stocks, we know that there will be downside pressure on price when they underperform.
Currently we are seeing RSP greatly outperforming the SPY and thus the SPY is likely to continue to experience problems in the shorter term.

The DecisionPoint Alert Weekly Wrap presents an end-of-week assessment of the trend and condition of the Stock Market, the U.S. Dollar, Gold, Crude Oil, and Bonds. The DecisionPoint Alert daily report (Monday through Thursday) is abbreviated and gives updates on the Weekly Wrap assessments.
MARKET/INDUSTRY GROUP/SECTOR INDEXES
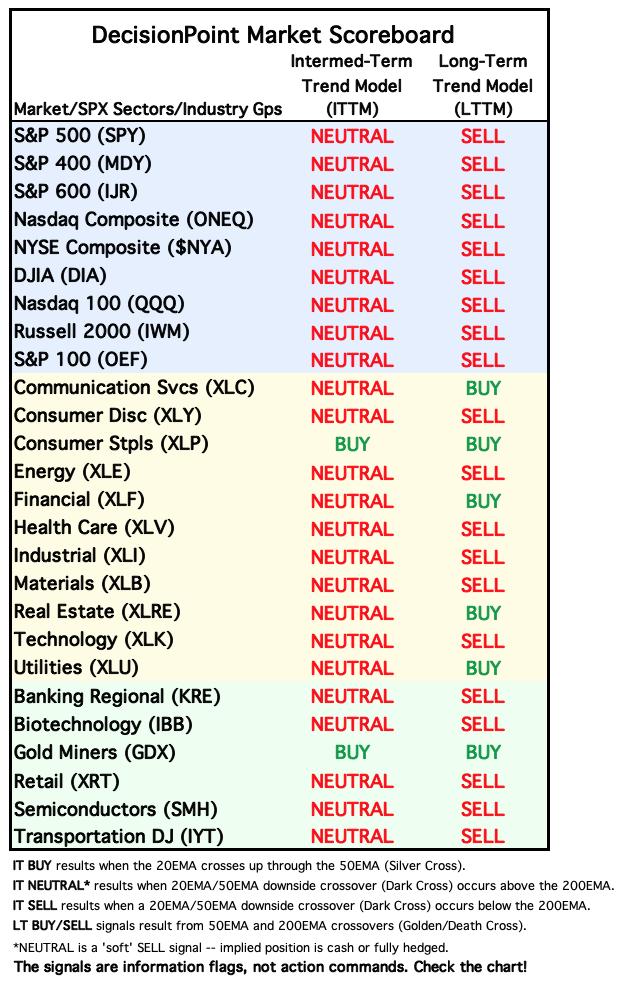
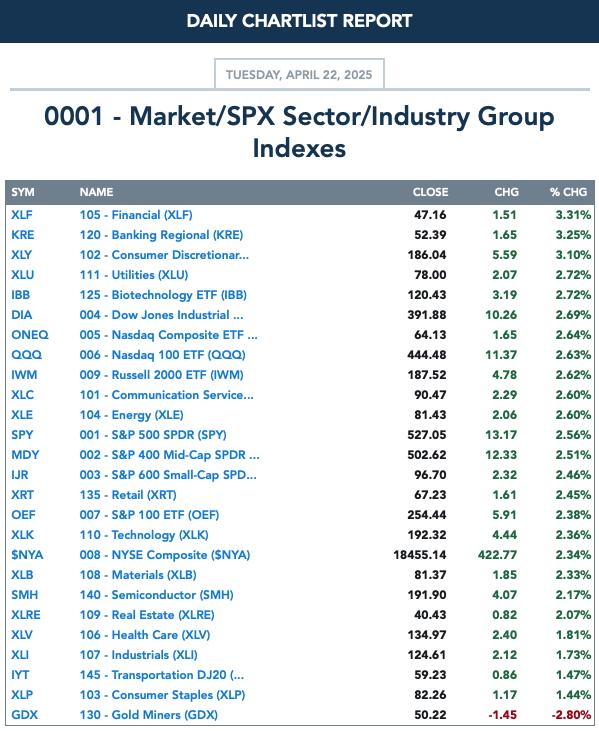
CLICK HERE for Carl's annotated Market Index, Sector, and Industry Group charts.
THE MARKET (S&P 500)
IT Trend Model: NEUTRAL as of 3/4/2025
LT Trend Model: BUY as of 3/29/2023
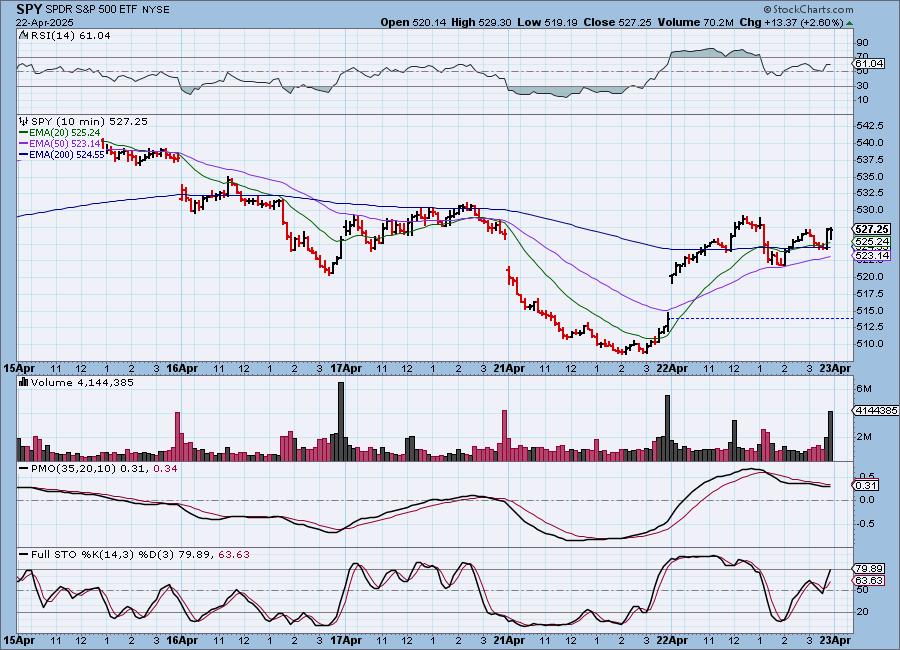
SPY 10-Minute Chart: We saw an excellent continuation of yesterday's late day rally with a gap up and higher prices. It did stumble midday but finished with a small rising trend and a breakout from the late day declining trend. The 10-minute PMO is technically rising and Stochastics are almost above 80 suggesting we could get a little follow-through tomorrow.
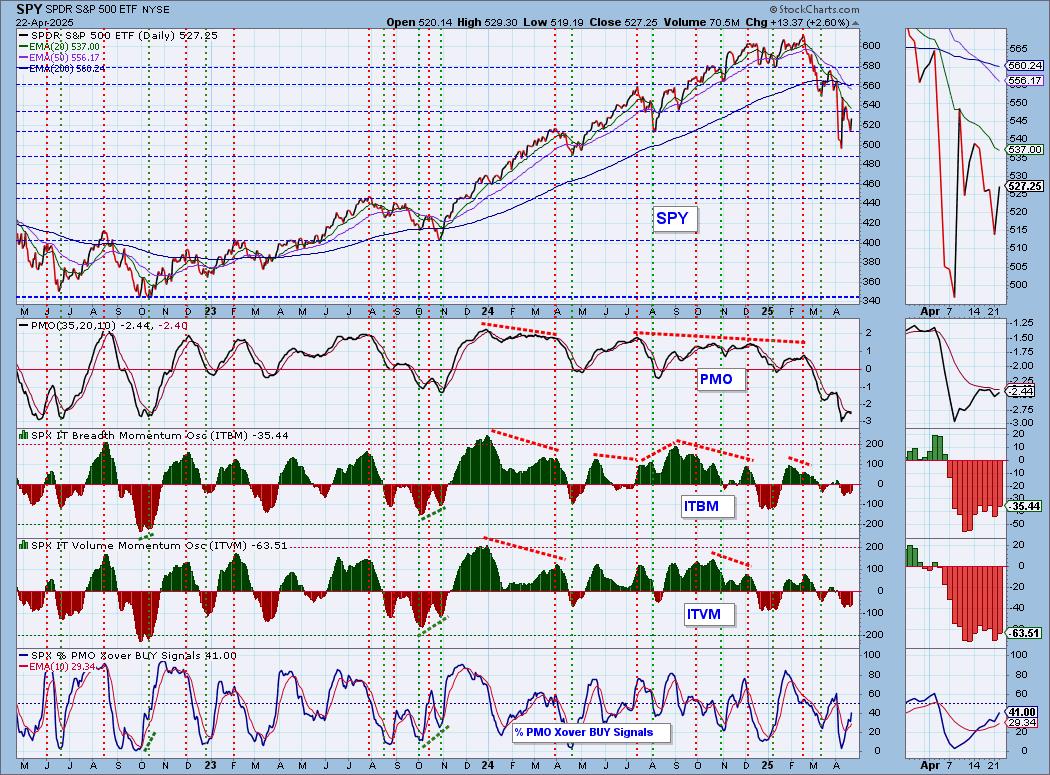
SPY Daily Chart: The declining trend was not really challenged with today's rally. The PMO did turn back up but is avoiding a Crossover BUY Signal for now. We'll be watching to see if this declining trend will be broken soon.
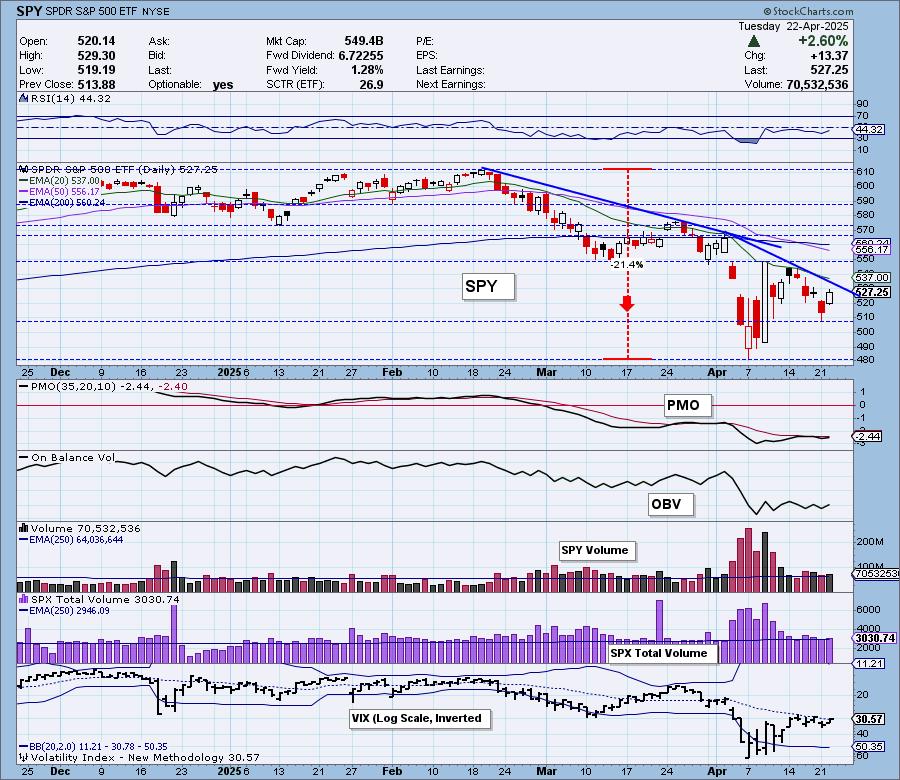
The VIX is still holding beneath its moving average on the inverted scale and Stochastics are essentially trending lower so we still detect near-term weakness.
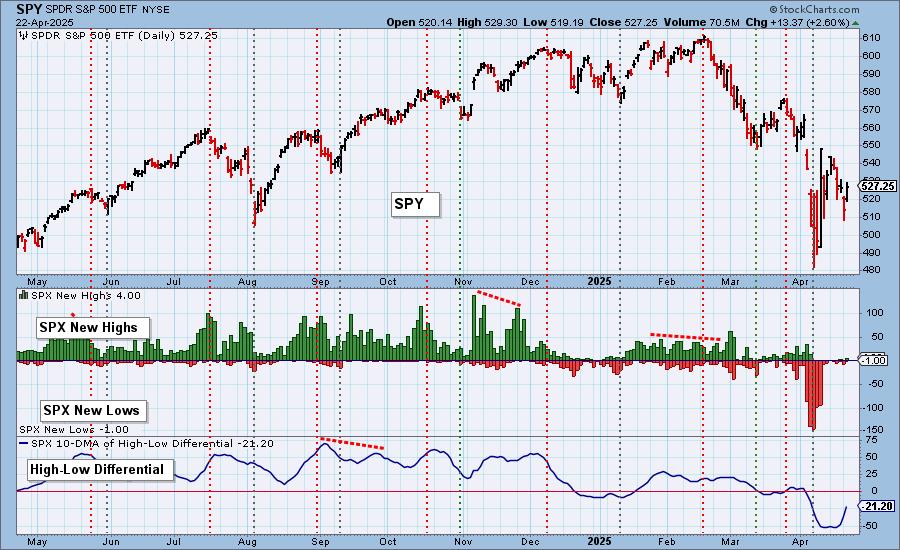
S&P 500 New 52-Week Highs/Lows: New Highs were muted on the rally but New Lows were barely detected with on one today. The High-Low Differential looks very bullish as it rises. This is one indicator that the bulls have to like right now.
Climax* Analysis: Today there were unanimous, strong climax readings on the four relative indicators, giving us an upside initiation climax. Total Volume was on average so this wasn't a blowoff.
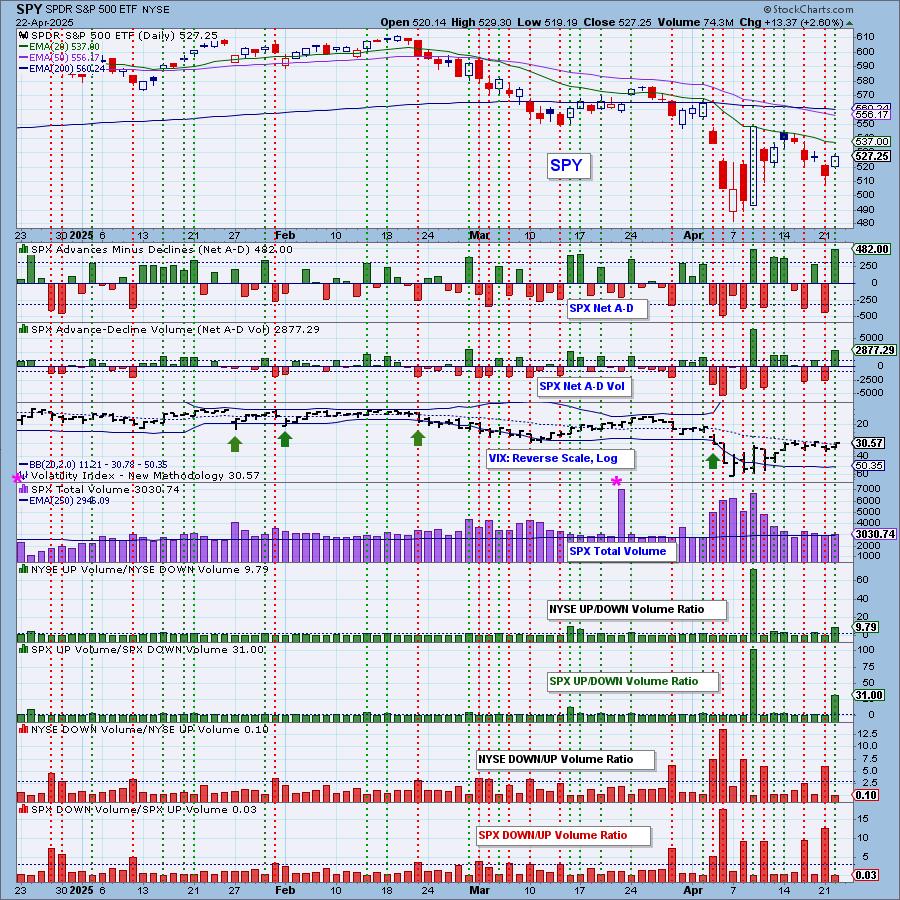
*A climax is a one-day event when market action generates very high readings in, primarily, breadth and volume indicators. We also include the VIX, watching for it to penetrate outside the Bollinger Band envelope. The vertical dotted lines mark climax days -- red for downside climaxes, and green for upside. Climaxes are at their core exhaustion events; however, at price pivots they may be initiating a change of trend.
Short-Term Market Indicators: The short-term market trend is DOWN and the condition is NEUTRAL.
The Swenlin Trading Oscillators (STOs) made their way lower again today. They are no where near oversold territory and thus can accommodate far more downside. Participation did shoot upward today and Rising PMOs rocketed higher leaving us with a large 81% holding rising momentum.
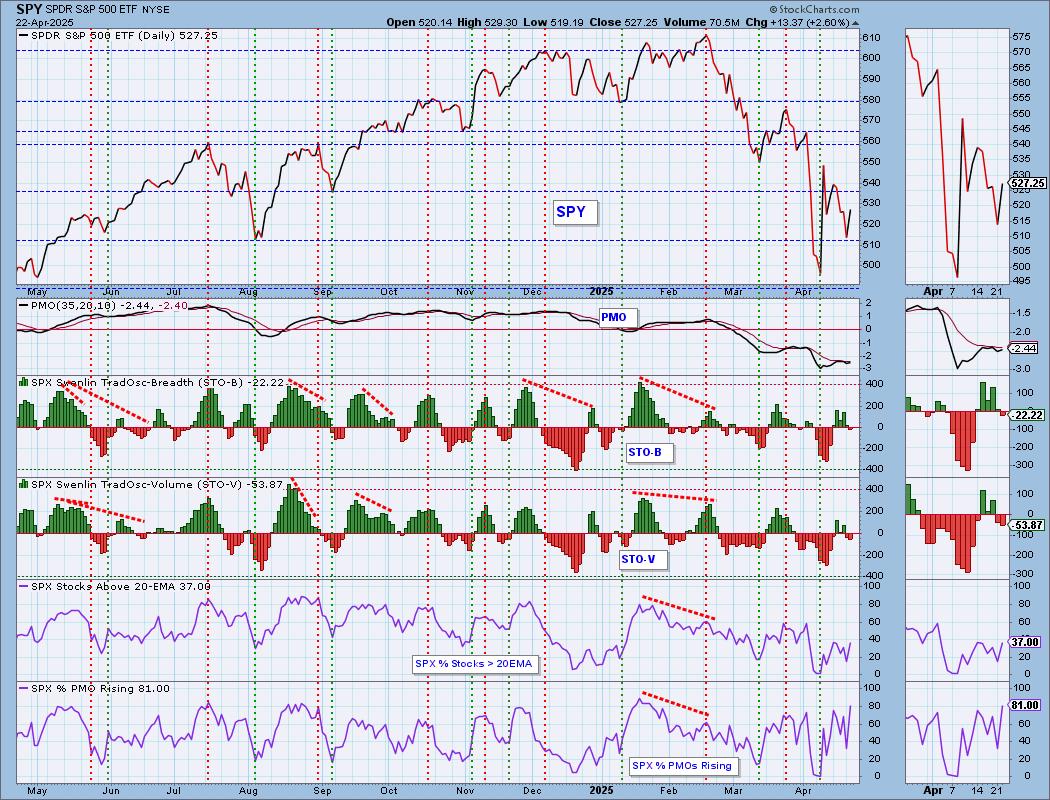
Intermediate-Term Market Indicators: The intermediate-term market trend is DOWN and the condition is NEUTRAL.
Interestingly the STOs were down on the day, but both the ITBM and ITVM turned up. This does have us questioning the veracity of the bear market. They could be implying that this could be a bottom. We aren't on board with a something more that a bear market rally. We don't think we're out of the woods just yet. We got another nice increase to the number of PMO Crossover BUY Signals. With 81% showing rising PMOs now, that indicator could move higher again tomorrow.
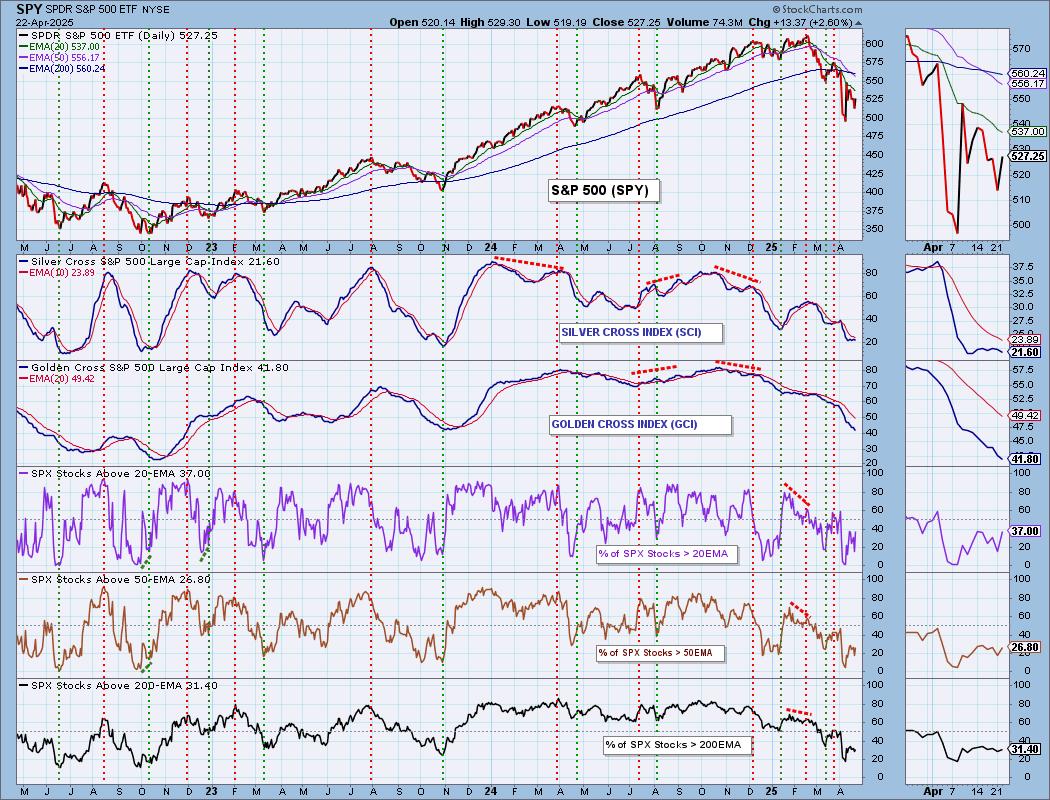
PARTICIPATION CHART (S&P 500): The following chart objectively shows the depth and trend of participation for the SPX in two time frames.
- Intermediate-Term - the Silver Cross Index (SCI) shows the percentage of SPX stocks on IT Trend Model BUY signals (20-EMA > 50-EMA). The opposite of the Silver Cross is a "Dark Cross" -- those stocks are, at the very least, in a correction.
- Long-Term - the Golden Cross Index (GCI) shows the percentage of SPX stocks on LT Trend Model BUY signals (50-EMA > 200-EMA). The opposite of a Golden Cross is the "Death Cross" -- those stocks are in a bear market.
The market bias is BEARISH in the intermediate and long terms.
Participation did see some expansion today, but numbers remain very low to look for an intermediate-term bottom. Overall participation is still in a declining trend. The Silver Cross Index has turned back down below its signal line and the Golden Cross Index continues to make its way lower. The Silver Cross Index could begin rising again given there are more stocks above their 20/50-day EMAs versus those with Silver Crosses. That would be welcomed. For now both the Silver Cross Index and Golden Cross Index are below their signal lines so the IT and LT Biases are still reading BEARISH.
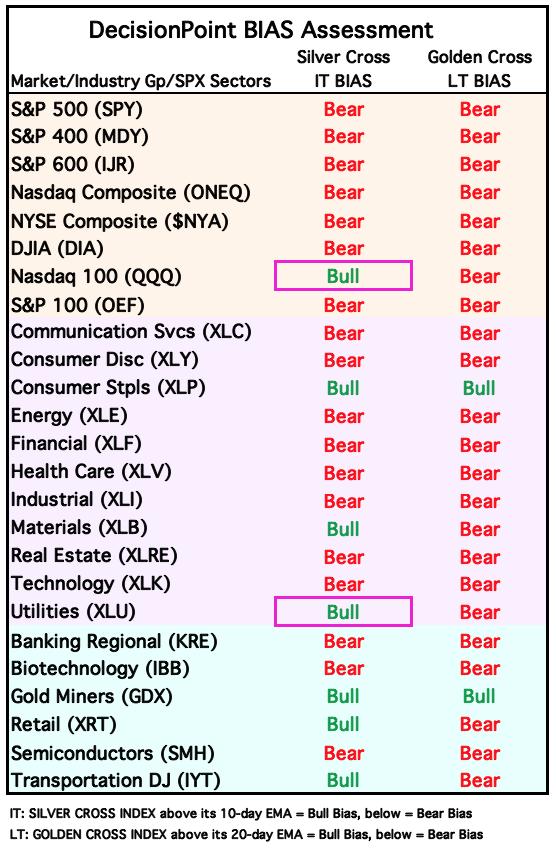
BIAS Assessment: The following table expresses the current BIAS of various price indexes based upon the relationship of the Silver Cross Index to its 10-day EMA (intermediate-term), and of the Golden Cross Index to its 20-day EMA (long-term). When the Index is above the EMA it is bullish, and it is bearish when the Index is below the EMA. The BIAS does not imply that any particular action should be taken. It is information to be used in the decision process.
The items with highlighted borders indicate that the BIAS changed today.
*****************************************************************************************************
CONCLUSION: We're starting to see a few more "Bull" designations on our Bias Table above so we are seeing some short-term improvement. We saw a huge gain on Rising PMOs and the High-Low Differential looks very bullish. We also have an upside initiation climax that implies higher prices over the next day or two. The one big problem is that STOs are still declining which is a surprise given the ITBM/ITVM turned back up today. It tells us to be cautious as we move forward. Participation is still weak so we'll need to see more improvement there before getting overly bullish. We still believe we are in a bear market but it appears time for another bear market rally.
Erin is 10% long, 0% short. (This is intended as information, not a recommendation.)
*****************************************************************************************************
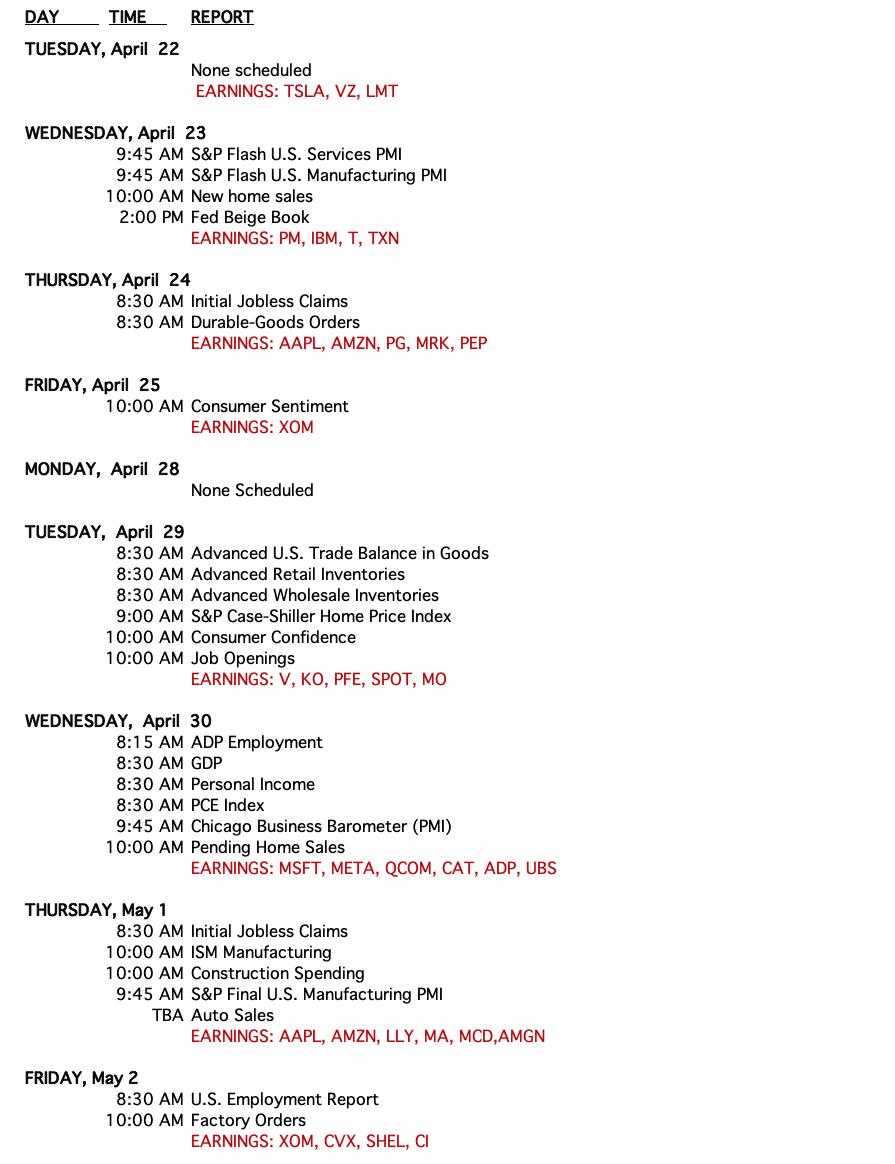
CALENDAR
BITCOIN
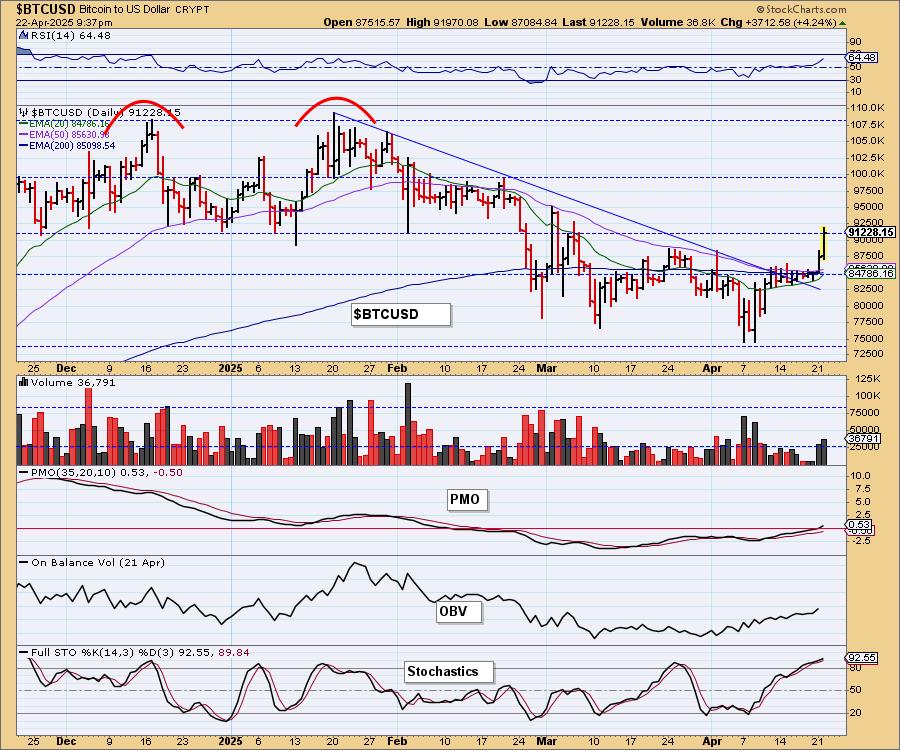
Bitcoin is off to the races again. This is an excellent breakout from the intermediate-term declining trend. The PMO is now in positive territory and the RSI is not yet overbought so we would look for more upside.
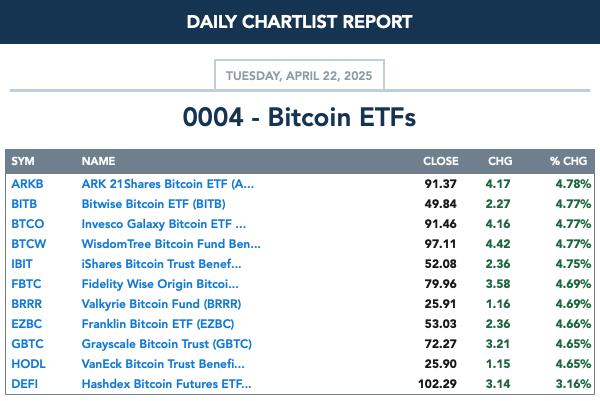
BITCOIN ETFs
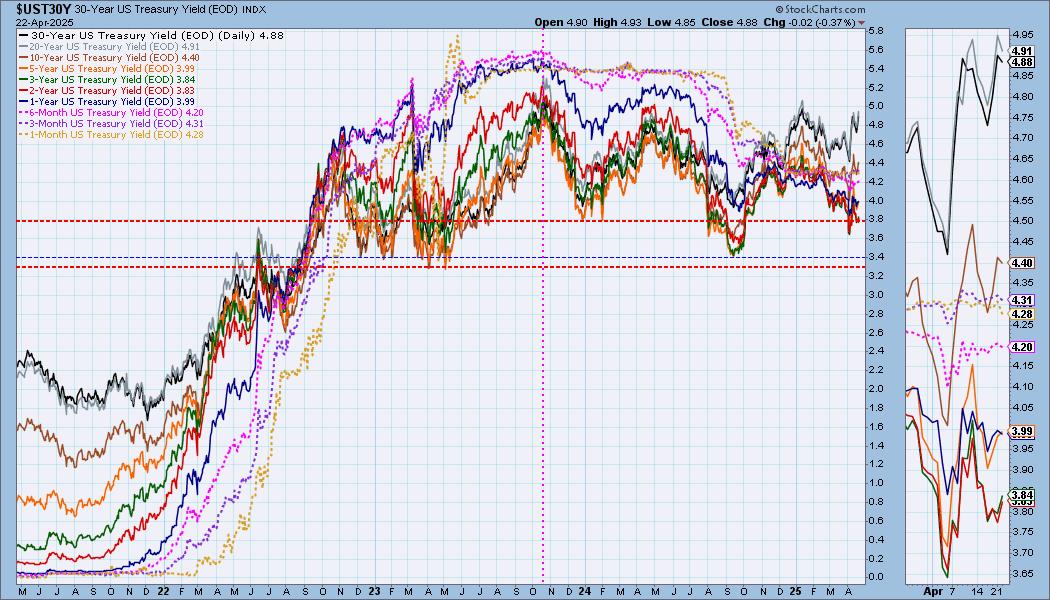
INTEREST RATES
Yields did back off slightly today. We are looking for them to continue to advance in their new rising trends.
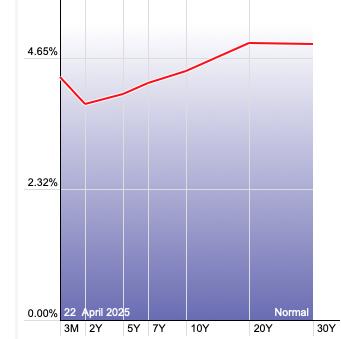
The Yield Curve Chart from StockCharts.com shows us the inversions taking place. The red line should move higher from left to right. Inversions are occurring where it moves downward.
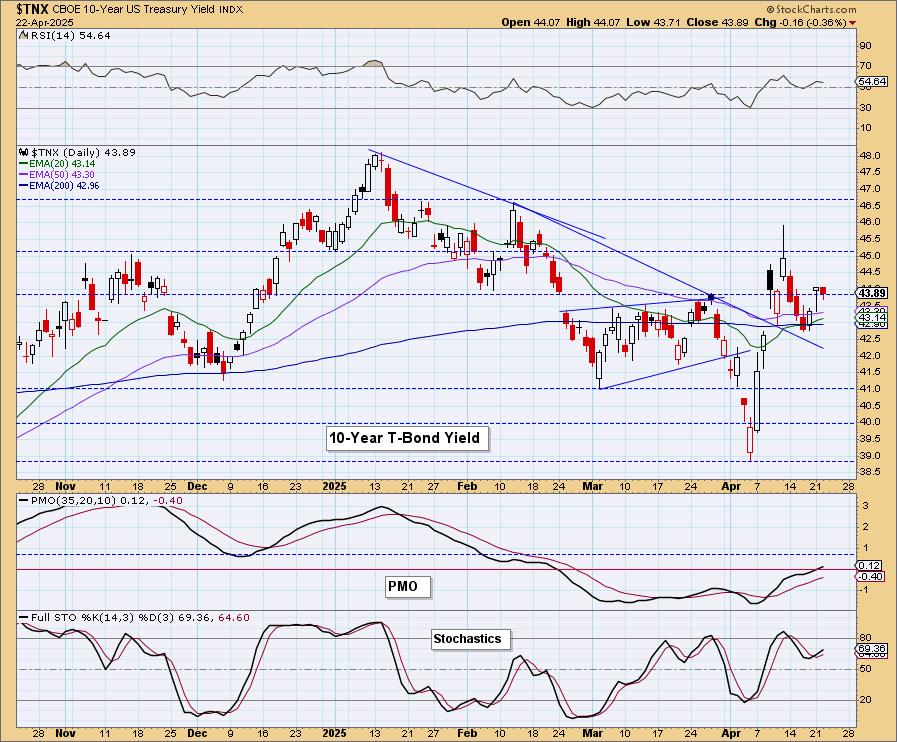
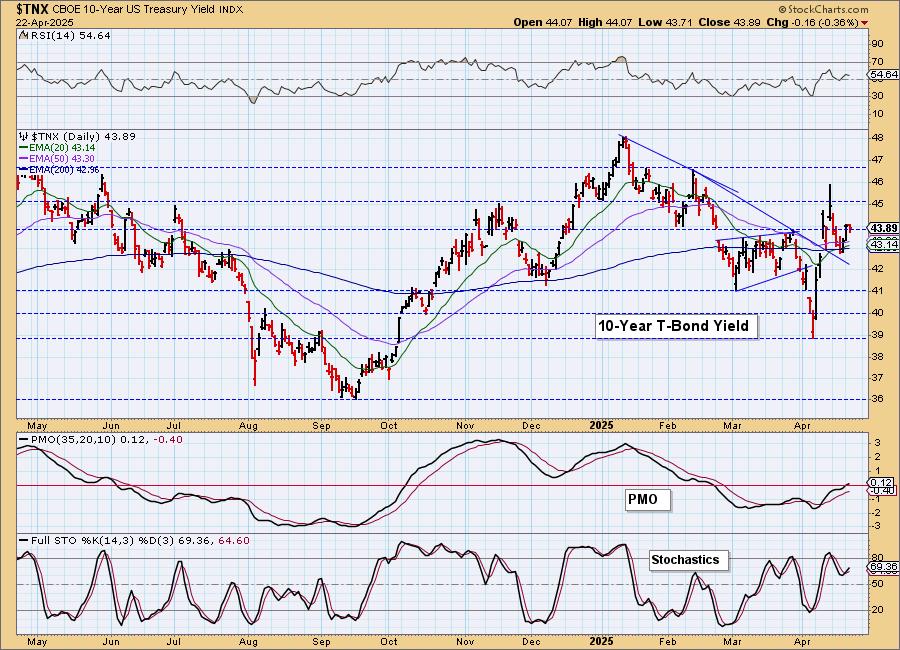
10-YEAR T-BOND YIELD
$TNX dropped slightly today. We still like it rallying out of a bull flag formation. The PMO just moved into positive territory and Stochastics are rising so we're looking for the advance to continue further.
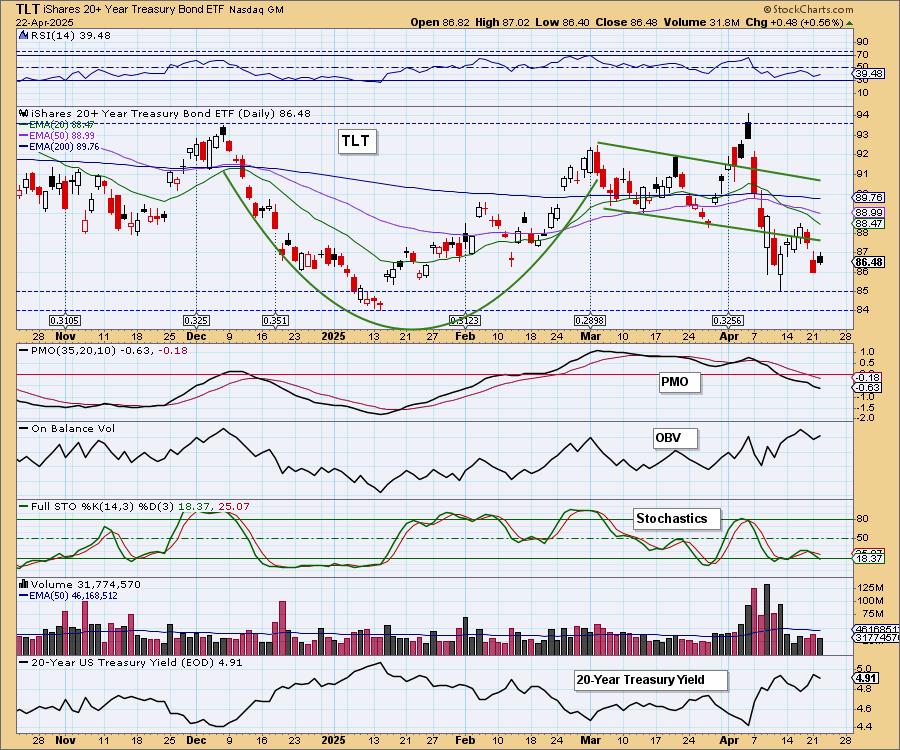
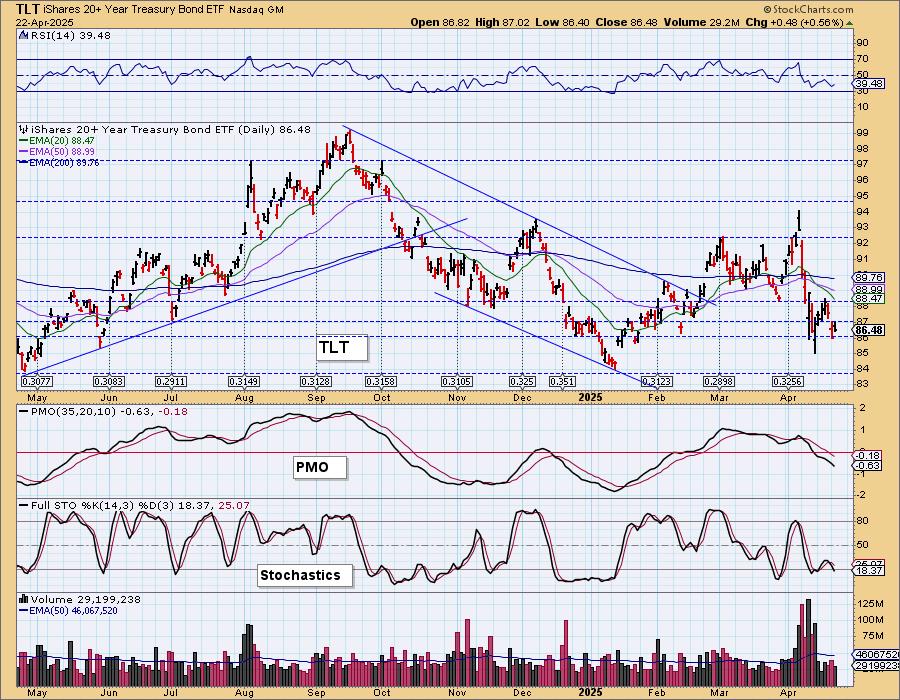
BONDS (TLT)
IT Trend Model: SELL as of 4/14/2025
LT Trend Model: SELL as of 12/13/2024
TLT Daily Chart: Today TLT formed a bearish filled black candlestick. We still believe yields are going to rise further from here so we expect support to eventually be tested at the January low. The PMO is in decline and Stochastics have dropped below 20 so weakness is clearly visible.
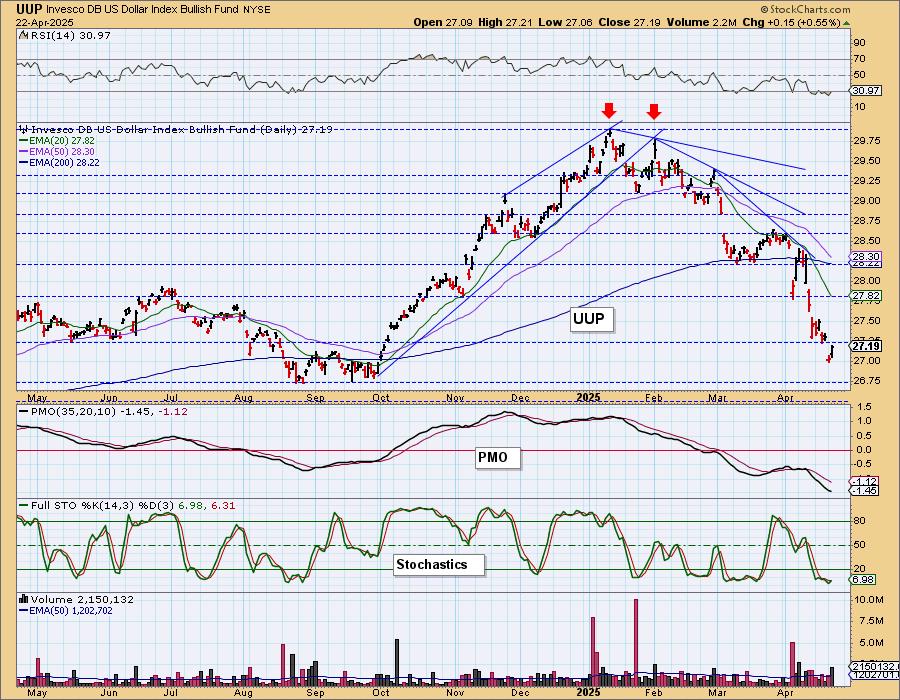
DOLLAR (UUP)
IT Trend Model: NEUTRAL as of 3/5/2025
LT Trend Model: BUY as of 5/25/2023
UUP Daily Chart: The Dollar did rally today and it is breaking from its steep declining trend. While it is overdue for a good rally we don't trust it yet. The RSI is negative, not oversold anymore and Stochastics are stuck beneath 20. The PMO is also still declining. We could get a little more upside here, but we're not looking for an extended rally. It's just too weak right now.
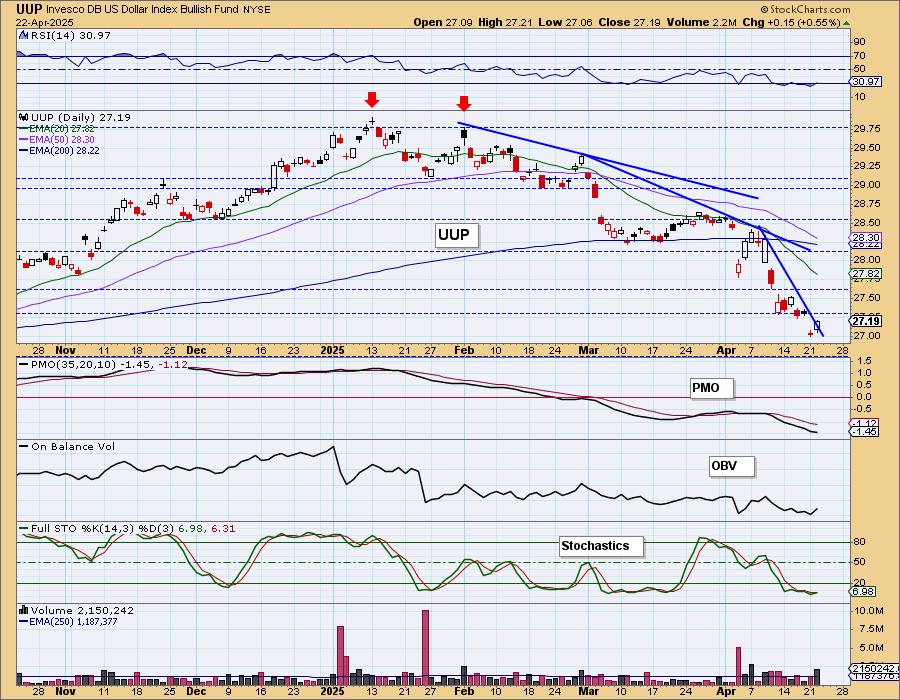
We are looking for a stronger bottom at support at 26.75. We think it will still make its way down there before rallying in a meaningful way.
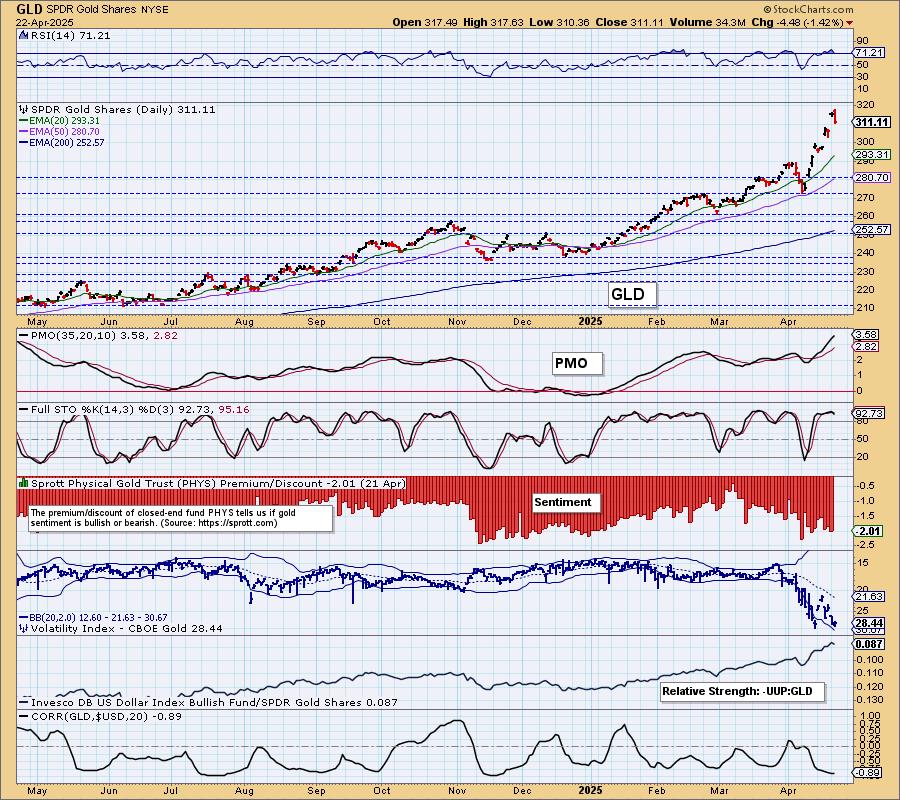
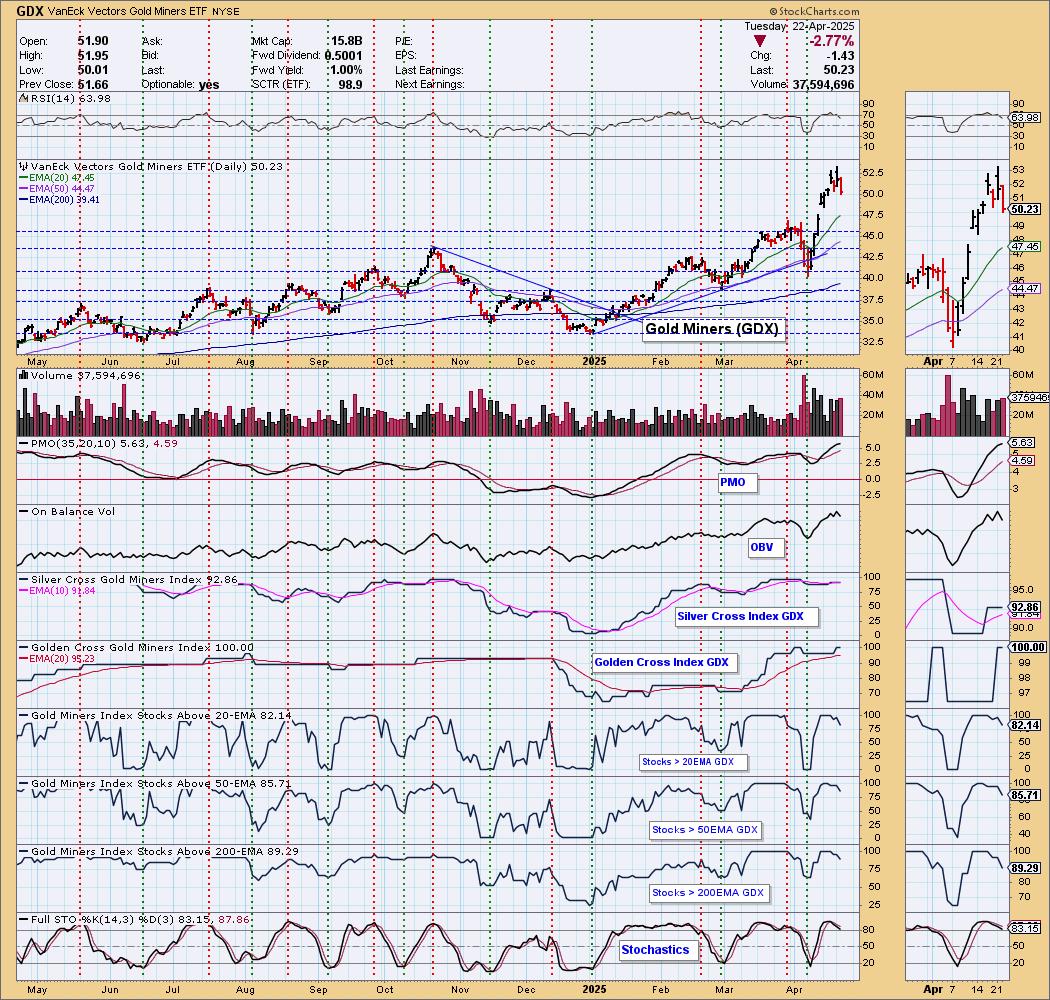
GOLD
IT Trend Model: BUY as of 1/10/2025
LT Trend Model: BUY as of 10/20/2023
GLD Daily Chart: Gold finally took a break and based on the small 0.55% gain on the Dollar, we should have only seen a drop of that magnitude. We didn't so that means there were a lot of sellers today. It has gotten overextended and we have a bearish engulfing candlestick on the daily chart so a bit more downside makes sense. The rest of the chart is still very bullish, but the overbought RSI also is in agreement that we'll see a bit more weakness here.
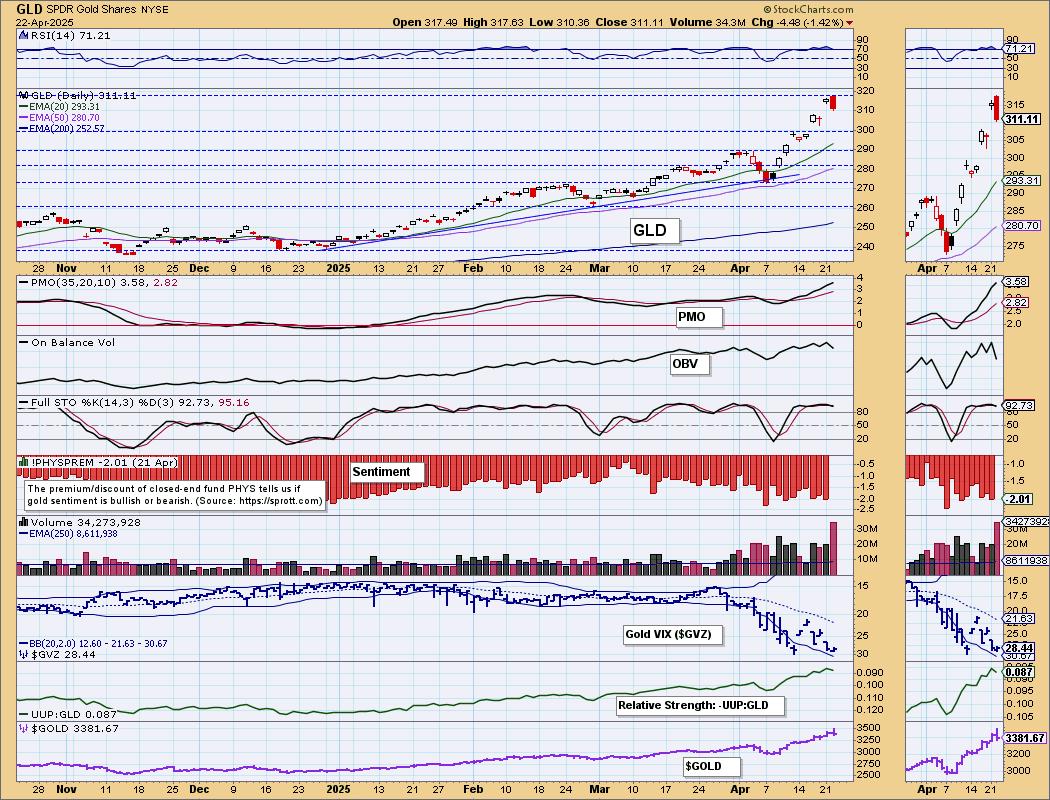
Discounts are elevated so there is bearish sentiment out there. If the Dollar decides to rally again, the inverse correlation with Gold is strong right now and tells us to look for lower prices for Gold.
GOLD MINERS (GDX) Daily Chart: We noticed a little weakness on GDX yesterday as it wasn't up as high as Gold. That turned into a big decline today on the heels of Gold's drop. This did bring the RSI out of overbought territory which is positive. Participation did slide on the decline so we do think we have more weakness ahead for Gold Miners.
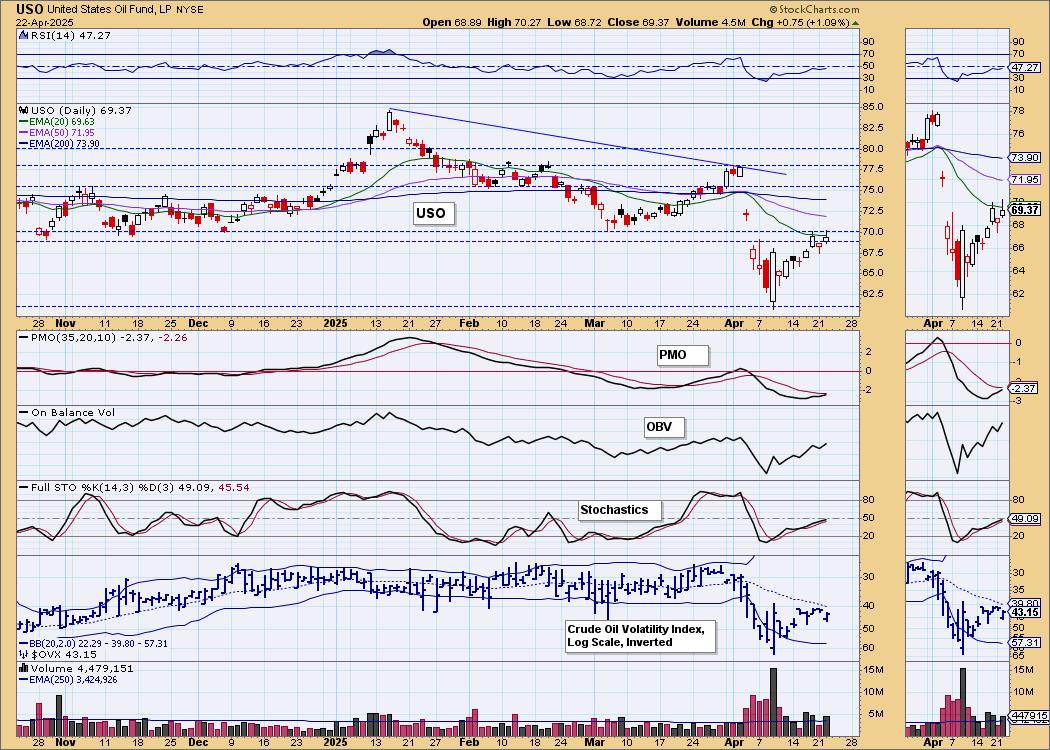
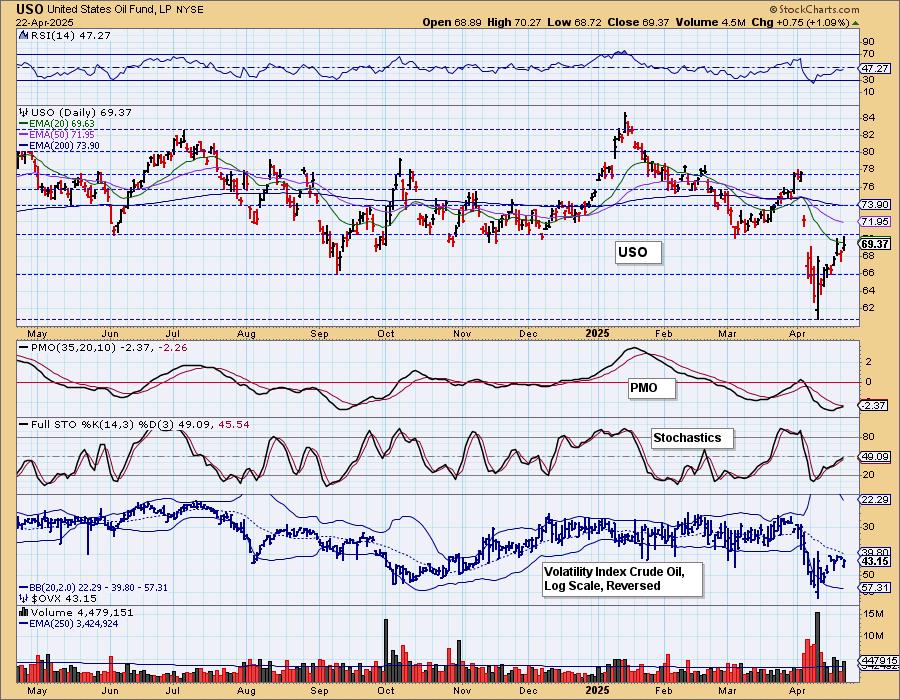
CRUDE OIL (USO)
IT Trend Model: NEUTRAL as of 2/27/2025
LT Trend Model: SELL as of 3/18/2025
USO Daily Chart: Crude Oil is enjoying a small rally off strong support. The problem is it hasn't made it past the current resistance zone. The PMO is nearing a Crossover BUY Signal but it is well below the zero line so we can't chalk it up to new strength, more like diminishing weakness, meaning the rising trend is vulnerable. Stochastics are rising, but the RSI is still in negative territory. This looks encouraging, but we aren't so sure it will breakout just yet.
Good Luck & Good Trading!
Erin Swenlin and Carl Swenlin
Technical Analysis is a windsock, not a crystal ball. --Carl Swenlin
(c) Copyright 2025 DecisionPoint.com
Disclaimer: This blog is for educational purposes only and should not be construed as financial advice. The ideas and strategies should never be used without first assessing your own personal and financial situation, or without consulting a financial professional. Any opinions expressed herein are solely those of the author, and do not in any way represent the views or opinions of any other person or entity.
DecisionPoint is not a registered investment advisor. Investment and trading decisions are solely your responsibility. DecisionPoint newsletters, blogs or website materials should NOT be interpreted as a recommendation or solicitation to buy or sell any security or to take any specific action.
NOTE: The signal status reported herein is based upon mechanical trading model signals, specifically, the DecisionPoint Trend Model. They define the implied bias of the price index based upon moving average relationships, but they do not necessarily call for a specific action. They are information flags that should prompt chart review. Further, they do not call for continuous buying or selling during the life of the signal. For example, a BUY signal will probably (but not necessarily) return the best results if action is taken soon after the signal is generated. Additional opportunities for buying may be found as price zigzags higher, but the trader must look for optimum entry points. Conversely, exit points to preserve gains (or minimize losses) may be evident before the model mechanically closes the signal.
Helpful DecisionPoint Links:
DecisionPoint Alert Chart List
DecisionPoint Golden Cross/Silver Cross Index Chart List
DecisionPoint Sector Chart List
Price Momentum Oscillator (PMO)