
Welcome to the inaugural DecisionPoint Diamonds Report on DecisionPoint.com! Thank you all for becoming "Charter" subscribers to our new website and specifically subscribers to Diamonds! The Diamonds Reports will continue in the same format they did in the StockCharts DP blog, but I will continue to adjust it. I want to add "stop zones" but I want to come up with a mechanically based methodology for that and I'm not there quite yet! Remember that Thursday is "Reader Request Diamonds", so send in your suggestions to erin@decisionpoint.com.
The market in general is flagging caution with choppy trading and looking "toppy". I found that on my Momentum Sleepers scan, a few charts came up with price near the bottom of a trading range. While in the long term trading ranges may not be profitable, it is possible to give a beat down stock that is sitting at the bottom of a range a try in the short to intermediate term. Setting a stop is pretty clear since you don't want to see the support at the bottom of the range broken.
Don't forget, on Thursdays I look at reader-requested symbols, so shoot me an email at erinh@stockcharts.com. I read every email I receive and try to answer them all! Your insight helps me to tailor my commentary to what my readers and viewers want to hear about.
Welcome to DecisionPoint Daily Diamonds, wherein I highlight five "diamonds in the rough." These are selected from the results of my DecisionPoint scans, which search for stocks that could benefit from the trend and condition of the market. Remember, these are not recommendations to buy or sell, but are the most interesting of the stocks that surfaced in my scans. My objective is to save you the work of the initial, tedious culling process, but you need to apply your own analysis to see if these stocks pique your interest as well. There are no guaranteed winners here!
Current Market Outlook:
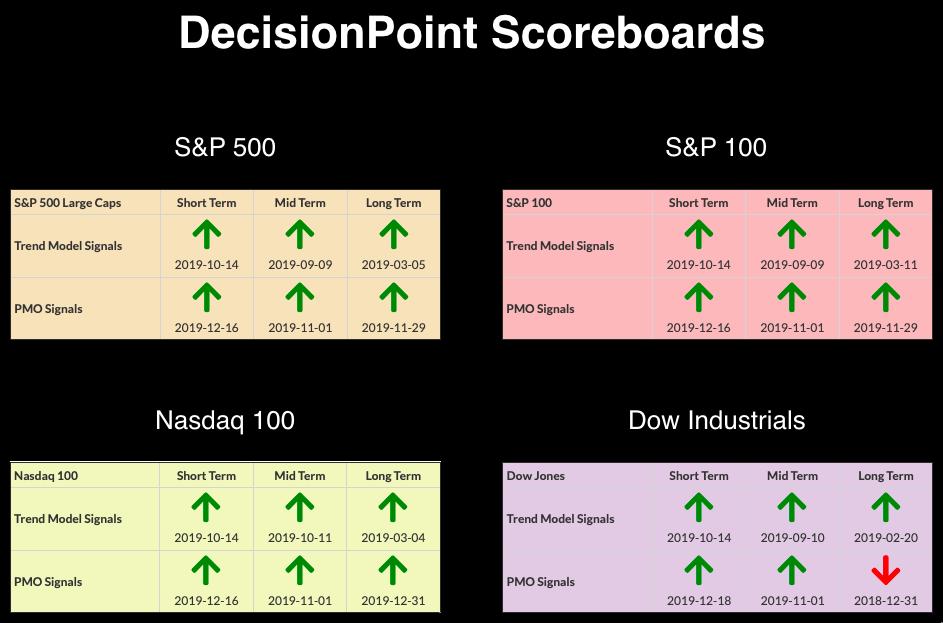
Market Trend: Currently, we have Trend Model BUY signals in all three timeframes on the DP Scoreboard Indexes.
Market Condition: The market is looking choppy. The NDX triggered a new Long-Term PMO BUY signal at the end of last month. To read more about this, check out today's DP Alert report. The market remains overbought, but we must remember that, in a bull market, overbought conditions can persist.
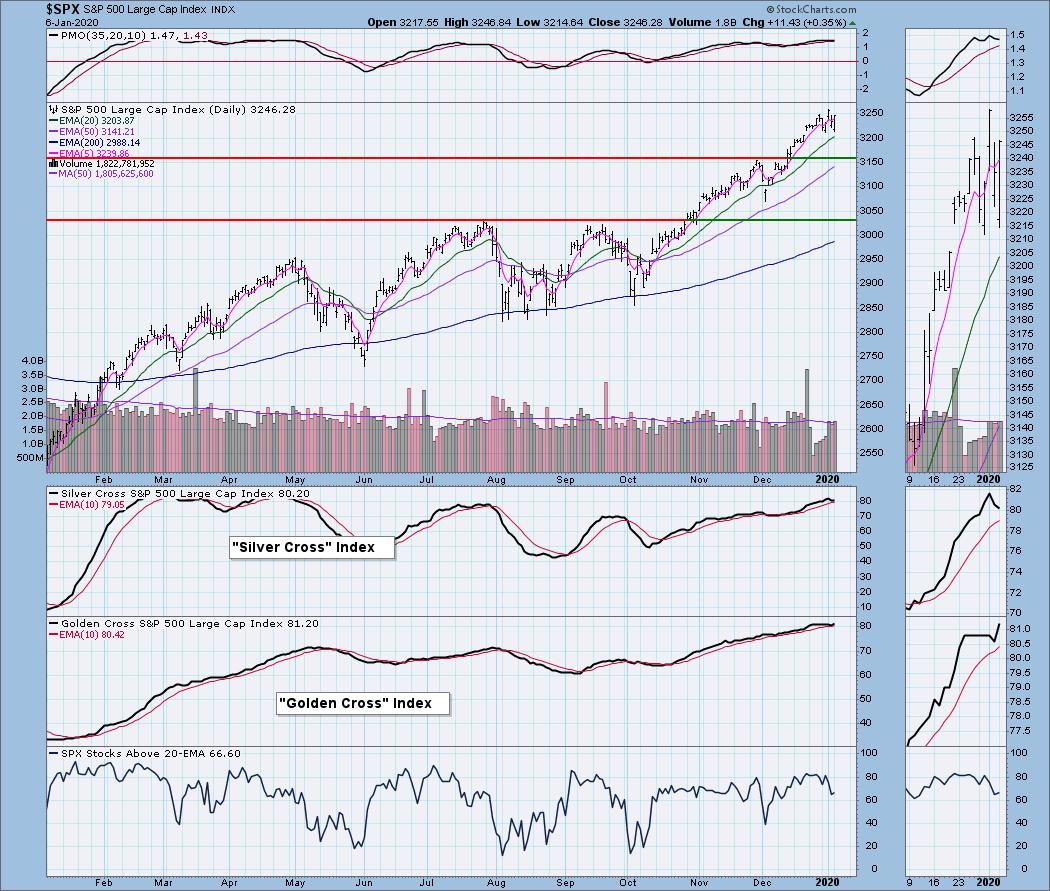
Market Environment: It is important to consider the odds for success. The Silver Cross Index measures the percentage of stocks on IT Trend Model BUY signals (20-EMA > 50-EMA), while the Golden Cross Index measures the percentage of stocks on LT Trend Model BUY signals (50-EMA > 200-EMA). Here are the current percentages on the Silver and Golden Cross Indexes:
Diamond Index:
- Diamond Scan Results: 3
- Diamond Dog Scan Results: 14
- Diamond Bull/Bear Ratio: .21
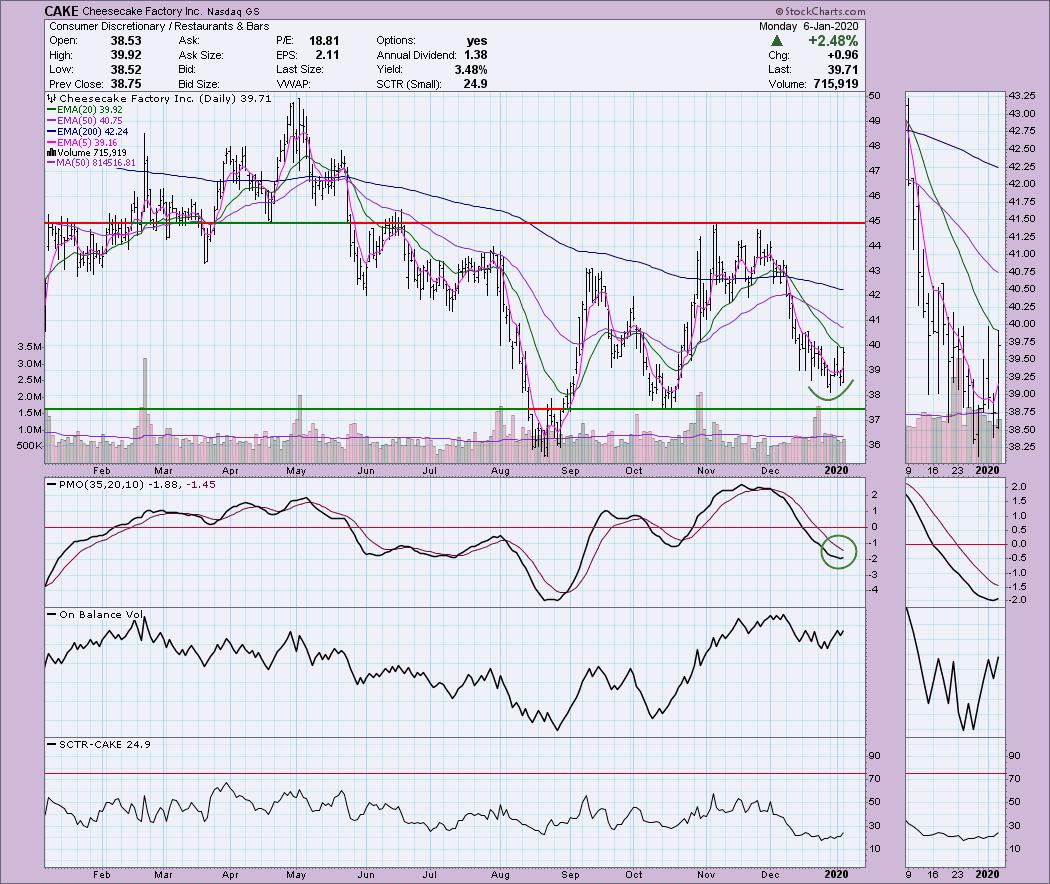
Cheesecake Factory Inc (CAKE) - Earnings: 2/18 - 2/24/2020
CAKE didn't quite hit the bottom of the range if you look at the October low as the support level. I find it bullish that price didn't have to move all the way down before finding enough momentum to right the ship. Price is getting stuck at the 20-EMA, but the PMO has turned up on this recent rounded price bottom. The stop here could be set around $37.50 or lower depending on your risk profile. After a 2.5% upside move today, I would expect to see a pullback which might be a good entry.
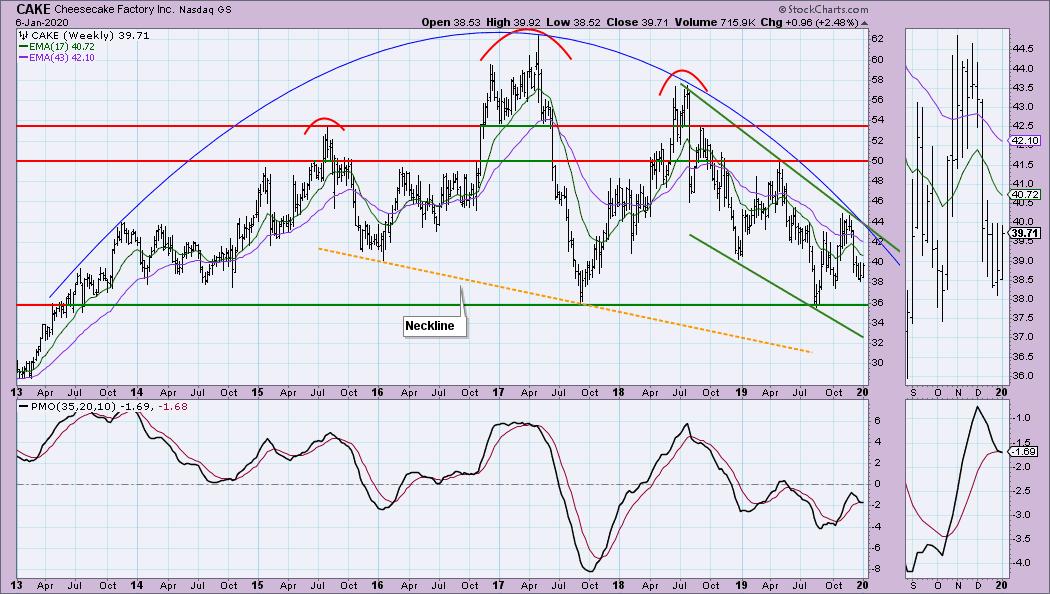
The weekly charts on "momentum sleepers" tend to be ugly. CAKE is not an exception. The PMO is decelerating, but it is trying to put in a SELL signal. We won't know if that signal comes to pass until the close on Friday. I do spot a bullish falling wedge. However very looooong-term, I see a rounded top or a head and shoulders pattern with an unusual neckline. If you're investing in just about any timeframe, the $36 support level is key and the bottom of an extensive trading range. The daily chart is positive enough but I think it important that you see what could be a gigantic trading range between $36 and $62 on the weekly chart, but ALSO be aware of the negativity in the long term with the rounded top and possible H&S.
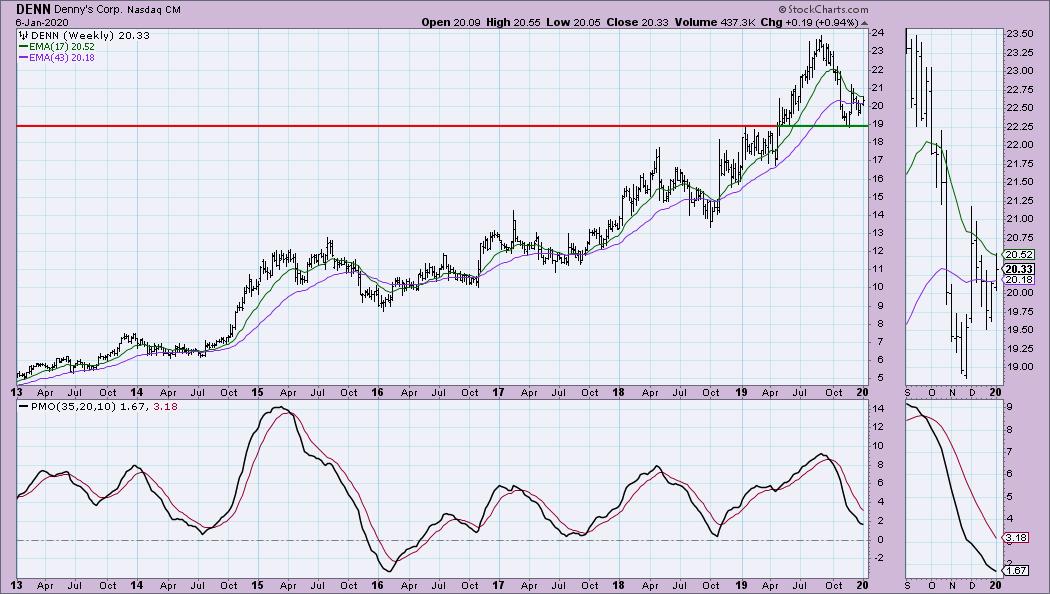
Denny's Corp (DENN) - Earnings: 2/10 - 2/14/2020
We have a slight breakout from a declining trend (green) in the intermediate-term and a big breakout from the short-term declining trendline (blue). The PMO has bottomed above its signal line which is very bullish. Notice the positive divergence between OBV lows and price lows. The SCTR could be better, but it is beat down after all. This last price bottom could be the second low of a double-bottom, but I don't want to get that far ahead of myself. The 5/20-EMAs just had a positive crossover which triggered a ST Trend Model BUY signal.
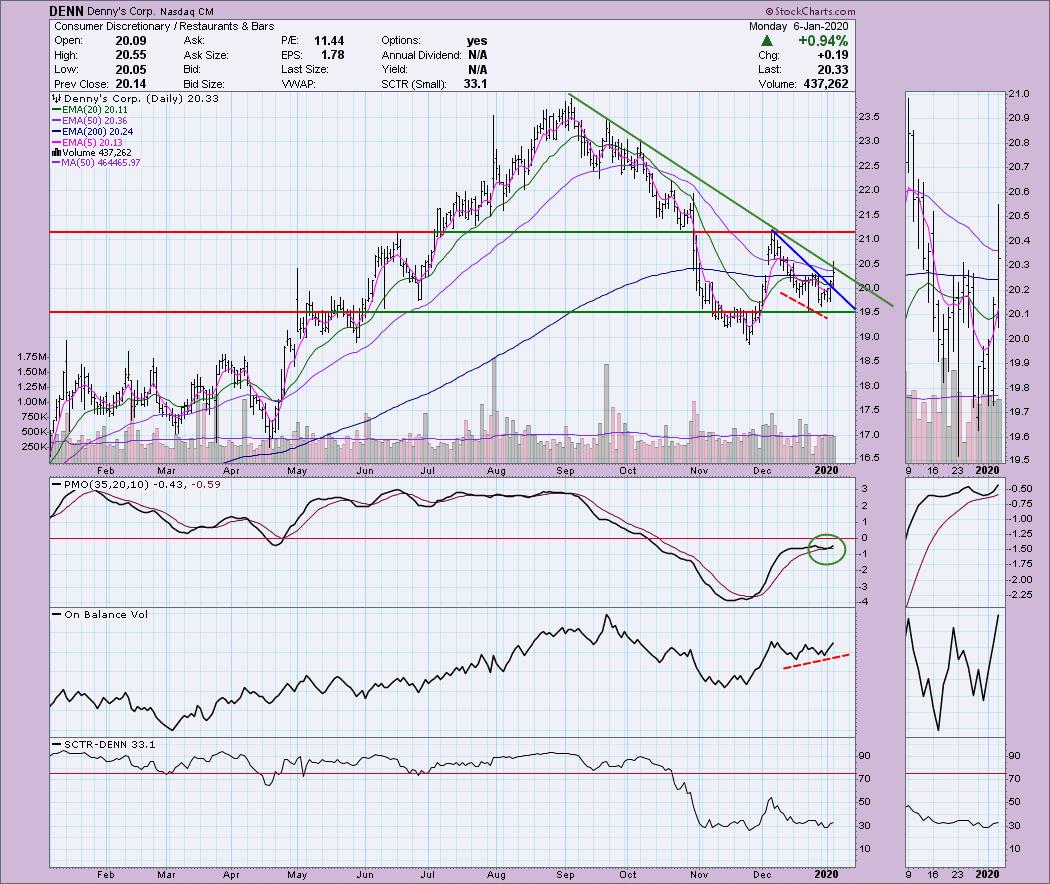
$19 seems to be the strongest area of support and the last price low didn't even need to test it before price started back up. The PMO is decelerating slightly.
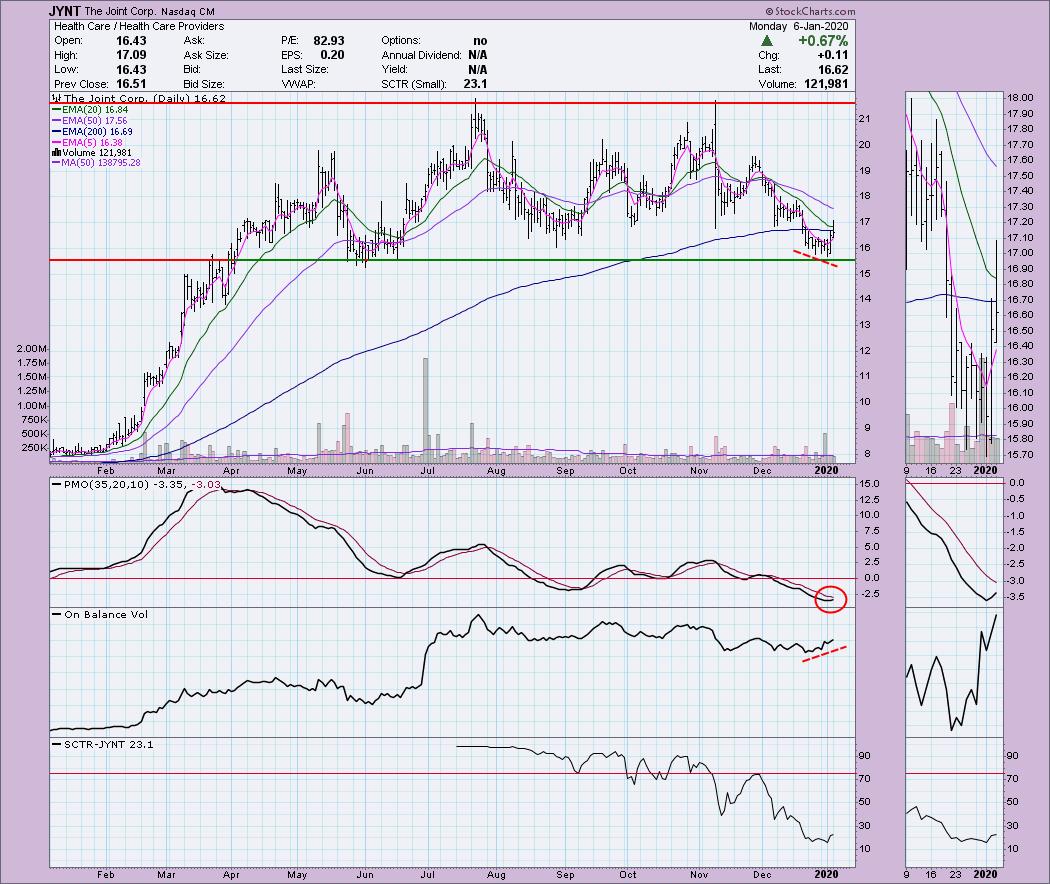
The Joint Corp (JYNT) - Earnings: 11/7/2019
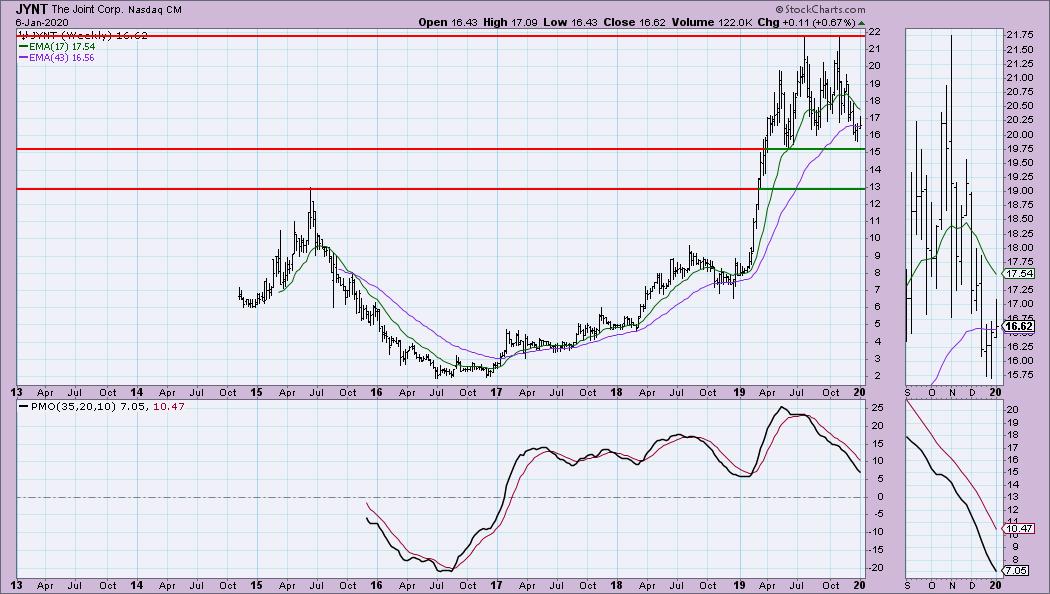
This was probably my favorite diamond of the day as far as trading ranges go. Price has just bounced off the bottom of a very defined trading range on the daily chart. The PMO has turned up and looks ready to give us a BUY signal. Note the positive divergence with the OBV. $15.50 is clear support and a possible stop placement.
The wide trading range was exclusive to 2019. The PMO is reaching what is oversold territory. Unfortunately it hasn't turned up and isn't decelerating yet, but if this turns out to be a rally back to the top of the price range, the PMO will likely take notice.
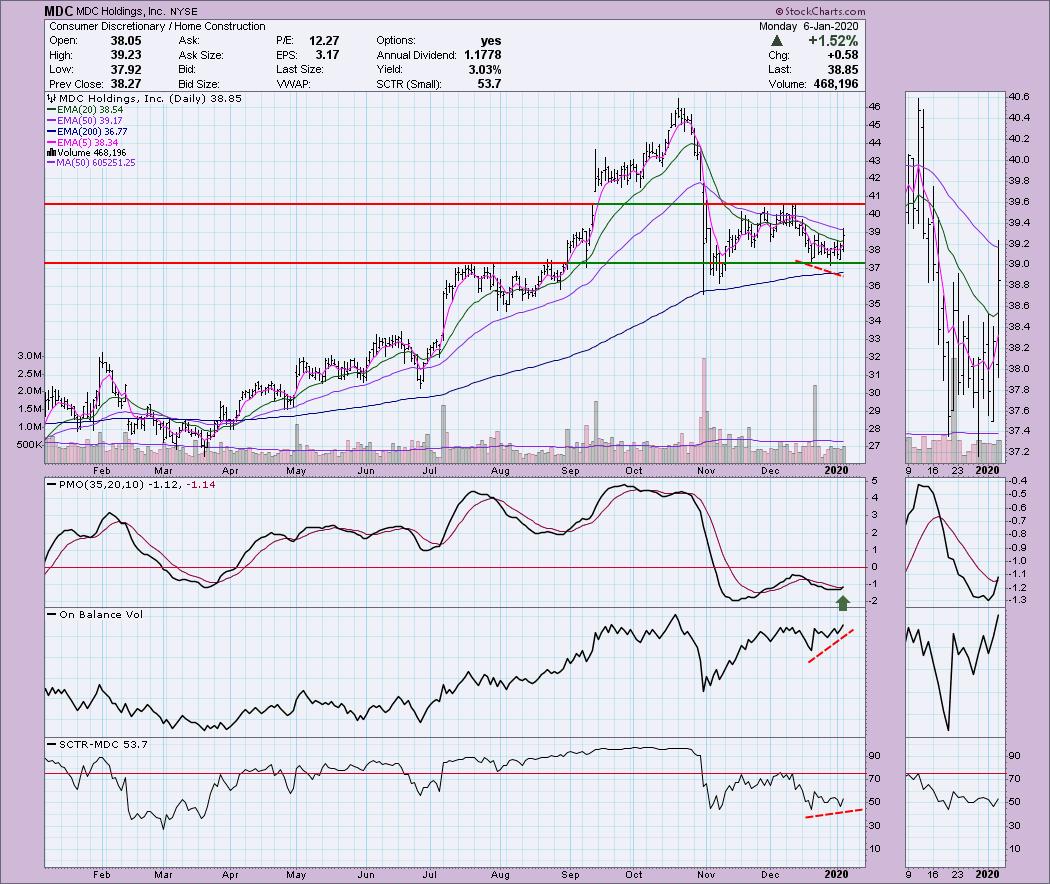
MDC Holdings Inc (MDC) - Earnings: 1/30/2020
Price on MDC is now unfortunately in the middle of its price range, but the PMO and positive divergence on the OBV coming alongside a breakout and close above the 20-EMA convinced me this is a diamond in the rough. Even the SCTR lows are rising. Notice that in September, price gapped up. Current overhead resistance lies at the Nov/Dec tops which also coincides with the start of a gap. I'm looking at a breakout here with a target around $47.
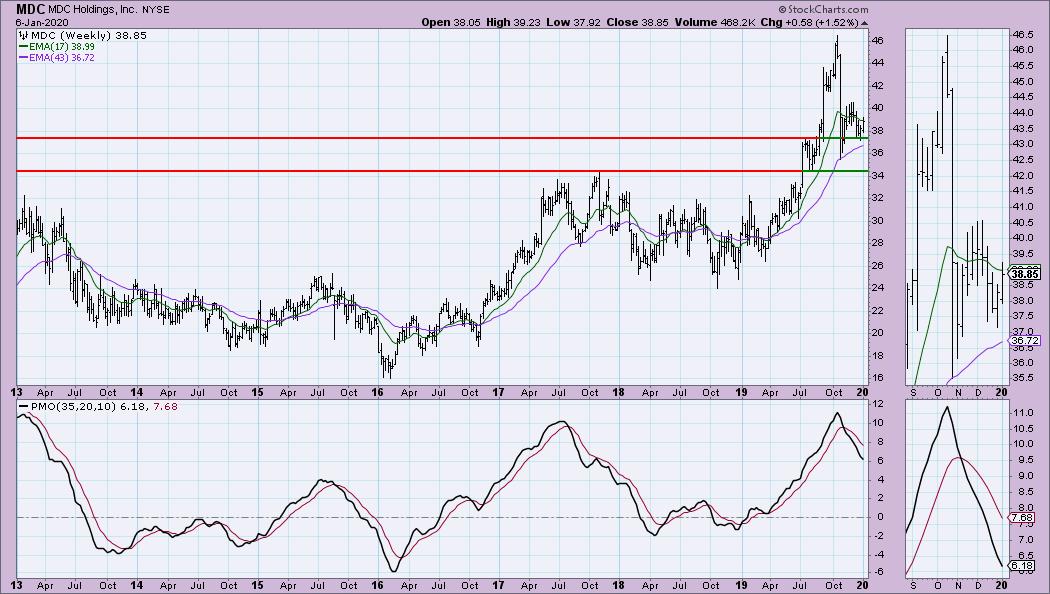
The weekly chart is nothing to write home about given the declining PMO. Support needs to hold at $37.00 which could be an excellent area for a stop.
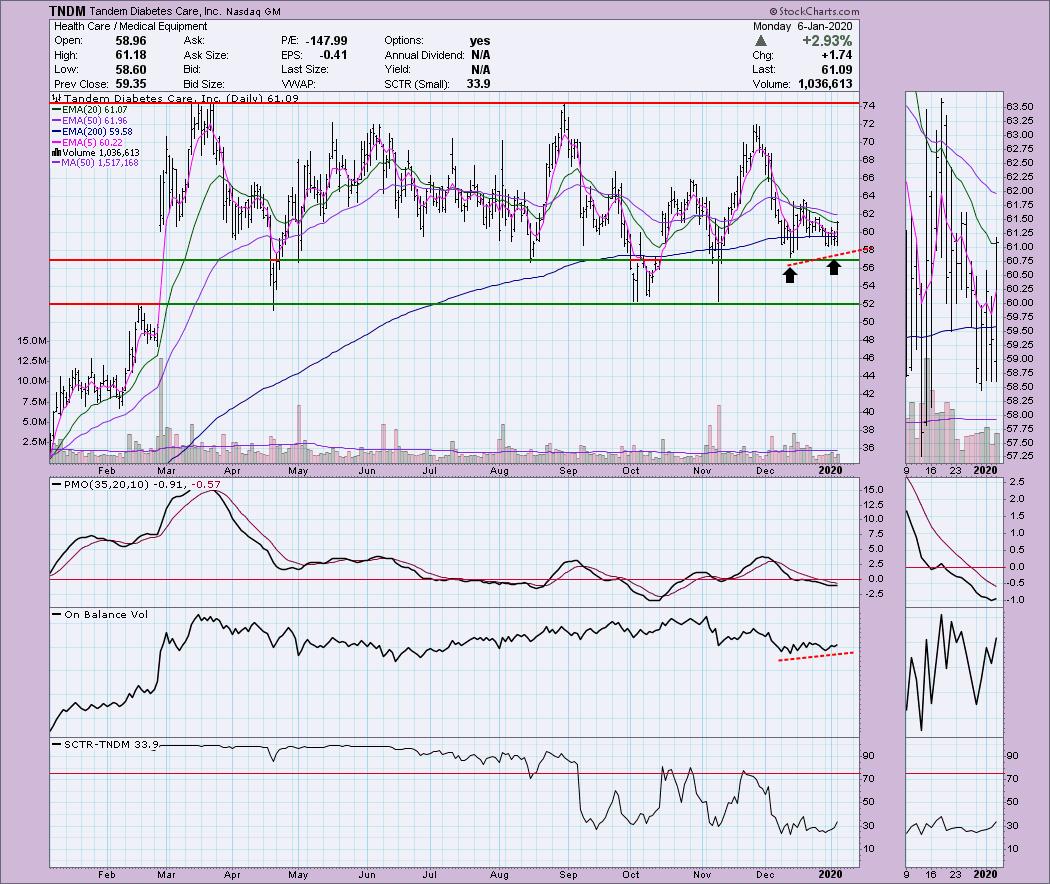
Tandem Diabetes Care Inc (TNDM) - Earnings: 2/24 - 2/28/2020
This is an excellent trading range example. Whether you consider $57 to be the bottom of the range or $52, in either case, price has some great upside potential should it make its way back up to the top of the range. The PMO has turned up. We did see that occur last month and it didn't pan out. As a consequence, we could be looking at a bullish double-bottom forming. OBV bottoms are rising with price to confirm. Price closed above the 20-EMA which suggests that it could be time for the break above the 50-EMA.
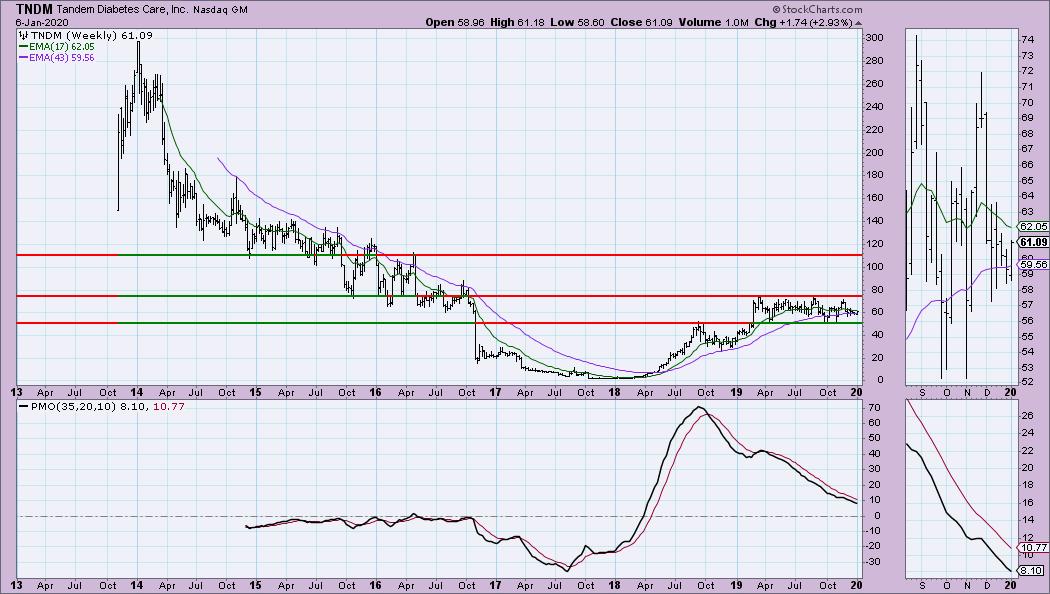
The range is well-defined. Should we see a breakout from the range, I would look at $110 as the next price target.
Full Disclosure: I do not own any of the stocks presented, but I have to say that many of these are on my watchlist for adding. I am 80% cash but am looking to enter a few positions later this week.
Market Vision 2020 - Sign Up for Details
I am so excited to be participating in "Market Vision 2020", an online financial conference to be held on Saturday, January 4, 2020 to kick off the new year. Make sure you're subscribed to the Market Vision 2020 newsletter in order to receive the latest updates on the event (and save a lot of money if you decide to attend!). *Click Here* to subscribe to the free newsletter. There will be lots of giveaways and free educational events for everyone who follows along – don't be left out!

Erin Swenlin will be presenting at the The MoneyShow Las Vegas on May 11-13, 2020! You'll have an opportunity to meet Erin and discuss the latest DecisionPoint news and Diamond Scans. The conference is free to attend or view online!
Watch the latest episode of DecisionPoint with Carl & Erin Swenlin LIVE on Mondays 5:00p EST or on the StockCharts TV YouTube channel here!
Technical Analysis is a windsock, not a crystal ball.
Happy Charting!
- Erin
erinh@stockcharts.com
NOTE: The stocks reported herein are from mechanical trading model scans that are based upon moving average relationships, momentum and volume. DecisionPoint analysis is then applied to get five selections from the scans. The selections given should prompt readers to do a chart review using their own analysis process. This letter is not a call for a specific action to buy, sell or short any of the stocks provided. There are NO sure things or guaranteed returns on the daily selection of "diamonds in the rough."
Helpful DecisionPoint Links:
DecisionPoint Shared ChartList and DecisionPoint Chart Gallery
Price Momentum Oscillator (PMO)
Swenlin Trading Oscillators (STO-B and STO-V)
**Don't miss DecisionPoint Commentary! Add your email below to be notified of new updates"**