
PAYC found its way onto my Diamond Scan again today, so I thought we could look at that chart again today. I found four others that looked promising on nice chart breakouts that I'm going to share as well. The market gave back over a third of the gains it picked up today in the last hour of trading. So despite traders shrugging off the news from overseas and a nice gain, I would take today's positive close with a grain of salt.
This is our first week at DecisionPoint.com and we value our new subscribers more than you know. For reference, I will be publishing Diamonds about three times a week (usually on Mondays, Tuesdays and Thursdays); however, if I see something interesting as I do my daily tasks, I will write on Wednesdays as well (like I am doing right now). On Thursdays, I plan to feature a reader requested Diamond and four of my own.
Don't forget, on Thursdays I look at reader-requested symbols, so shoot me an email at erin@decisionpoint.com. I read every email I receive and try to answer them all!
Welcome to DecisionPoint Daily Diamonds, wherein I highlight five "diamonds in the rough." These are selected from the results of my DecisionPoint scans, which search for stocks that could benefit from the trend and condition of the market. Remember, these are not recommendations to buy or sell, but are the most interesting of the stocks that surfaced in my scans. My objective is to save you the work of the initial, tedious culling process, but you need to apply your own analysis to see if these stocks pique your interest as well. There are no guaranteed winners here!
Current Market Outlook:
Market Trend: Currently, we have Trend Model BUY signals in all three timeframes on the DP Scoreboard Indexes.
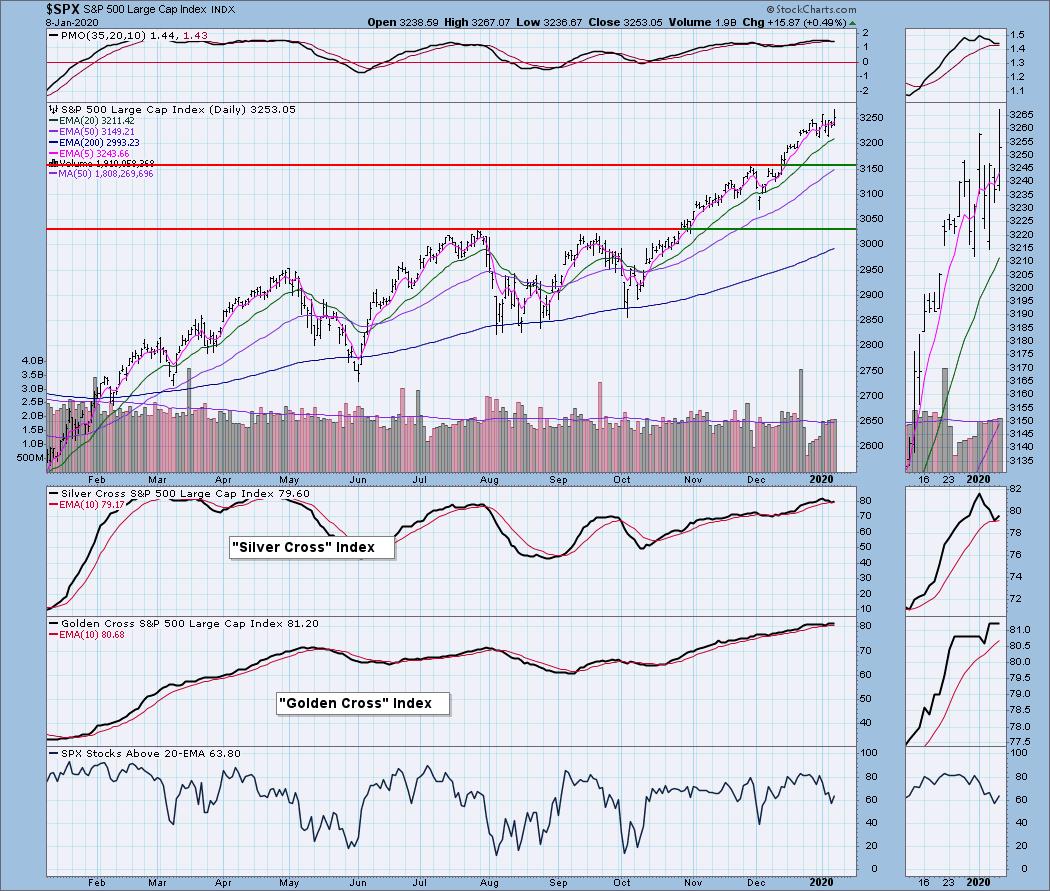
Market Condition: The market is still choppy and acting 'toppy' and as I mentioned above, the last hour of trading today is concerning. The market remains overbought, but we must remember that in a bull market, overbought conditions can persist.
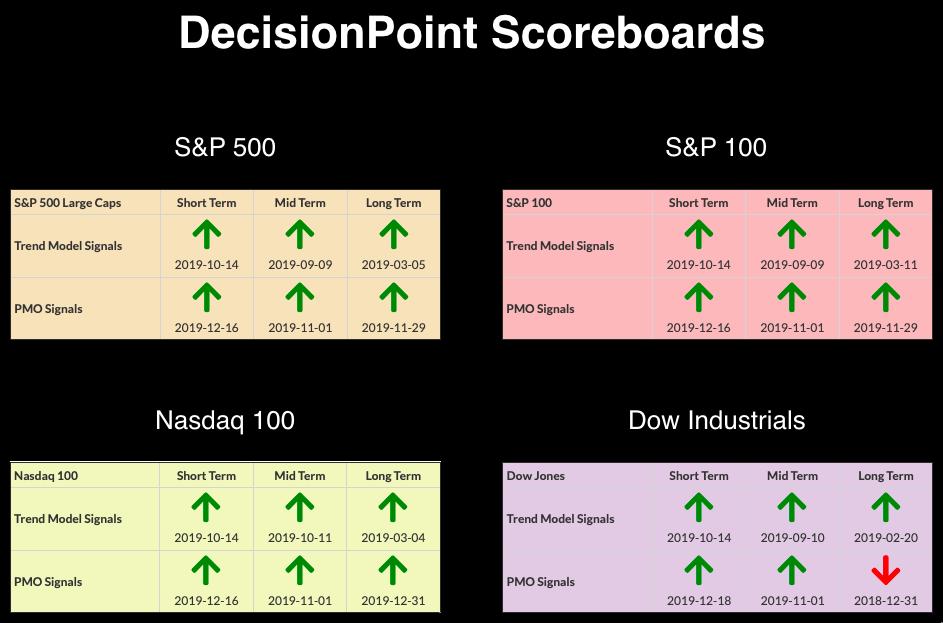
Market Environment: It is important to consider the odds for success. The Silver Cross Index measures the percentage of stocks on IT Trend Model BUY signals (20-EMA > 50-EMA), while the Golden Cross Index measures the percentage of stocks on LT Trend Model BUY signals (50-EMA > 200-EMA). Don't forget that as a "Diamonds" member, you have access to our GCI/SCI curated ChartList on DecisionPoint.com. You'll find it under "Members Only" links on the left side. Here are the current percentages on the Silver and Golden Cross Indexes:
Diamond Index:
- Diamond Scan Results: 13
- Diamond Dog Scan Results: 24
- Diamond Bull/Bear Ratio: .54
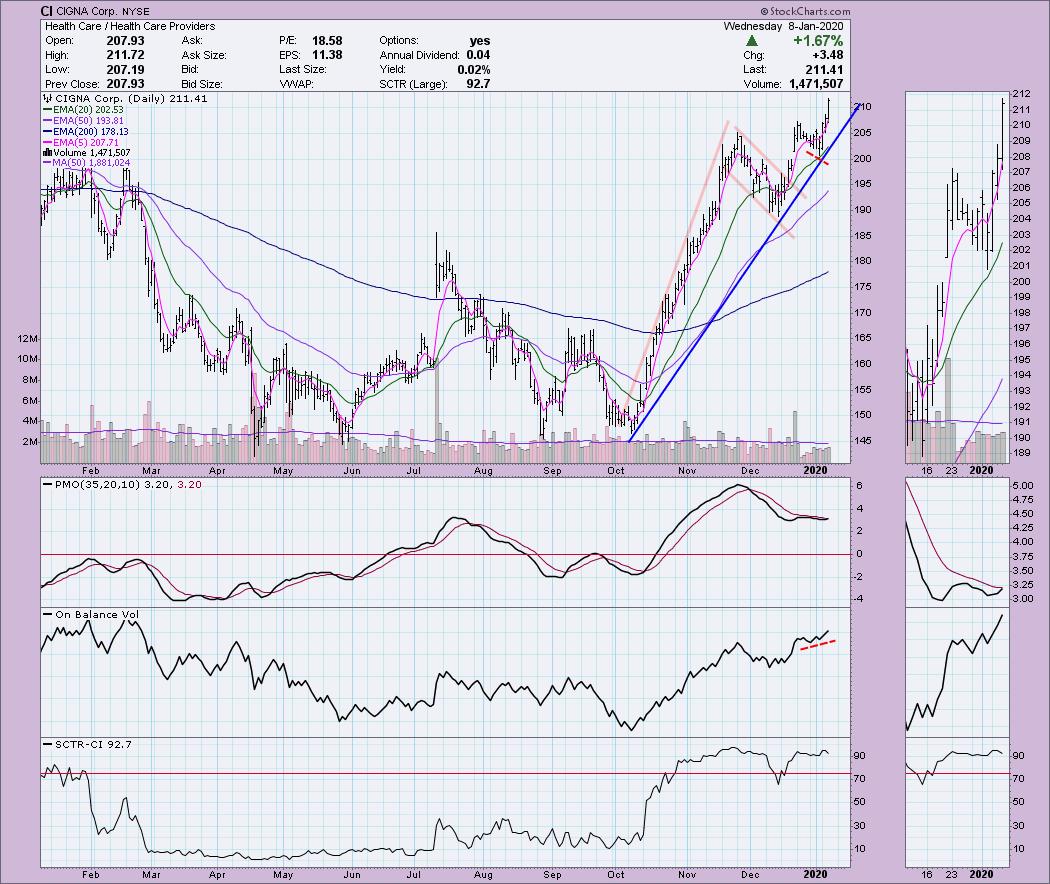
CIGNA Corp (CI) - Earnings: 2/6/2020
I was asked to add more fundamental analysis to my Diamonds but in all honesty, I don't use them much when I select my own stocks from my diamond mining and will only add that type of information if it makes sense to me. I did read today that CIGNA is an exciting player in the digital prescription area among health care providers. I imagine many of you use "ExpressScrips". They will be reporting earnings next month and analysts expect good news. The large flag formation executed in mid-December. After shooting higher with a gap up, CI consolidated the gains, bounced off the 20-EMA and formed another flag on a much smaller pole. The rising trend is very steep, but today's breakout was impressive. The PMO is about to give us a BUY signal and notice the positive divergence on the OBV that portended a possible breakout. On each breakout, the OBV set a new high which is great confirmation as well.
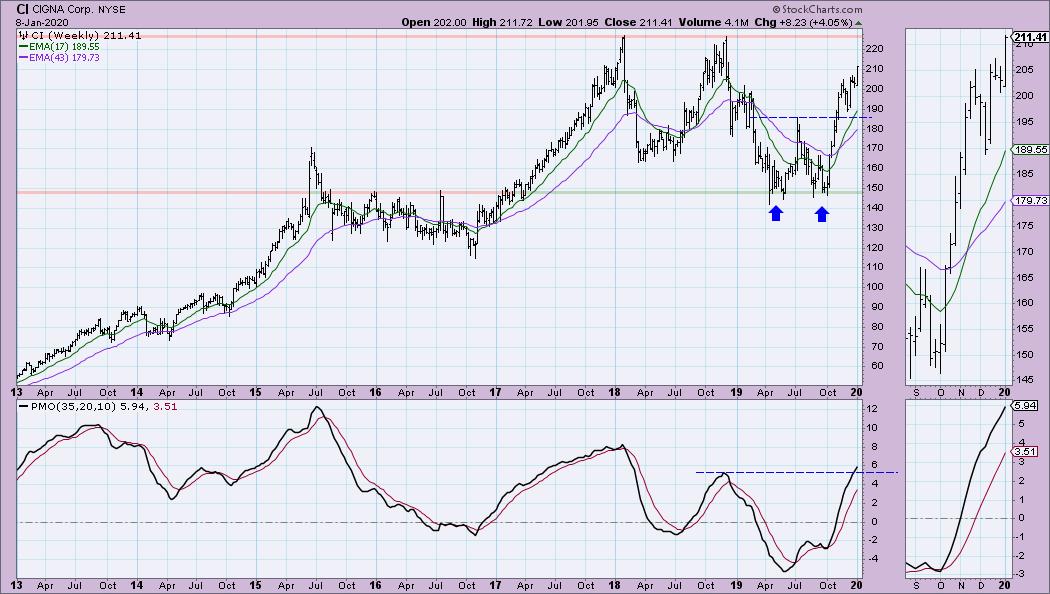
The double-bottom has executed. It appeared it would fail to reach its upside target (at all-time highs) after a pullback, but after price connected with the confirmation line, it took off again. The PMO is not overbought and has exceeded the previous top.
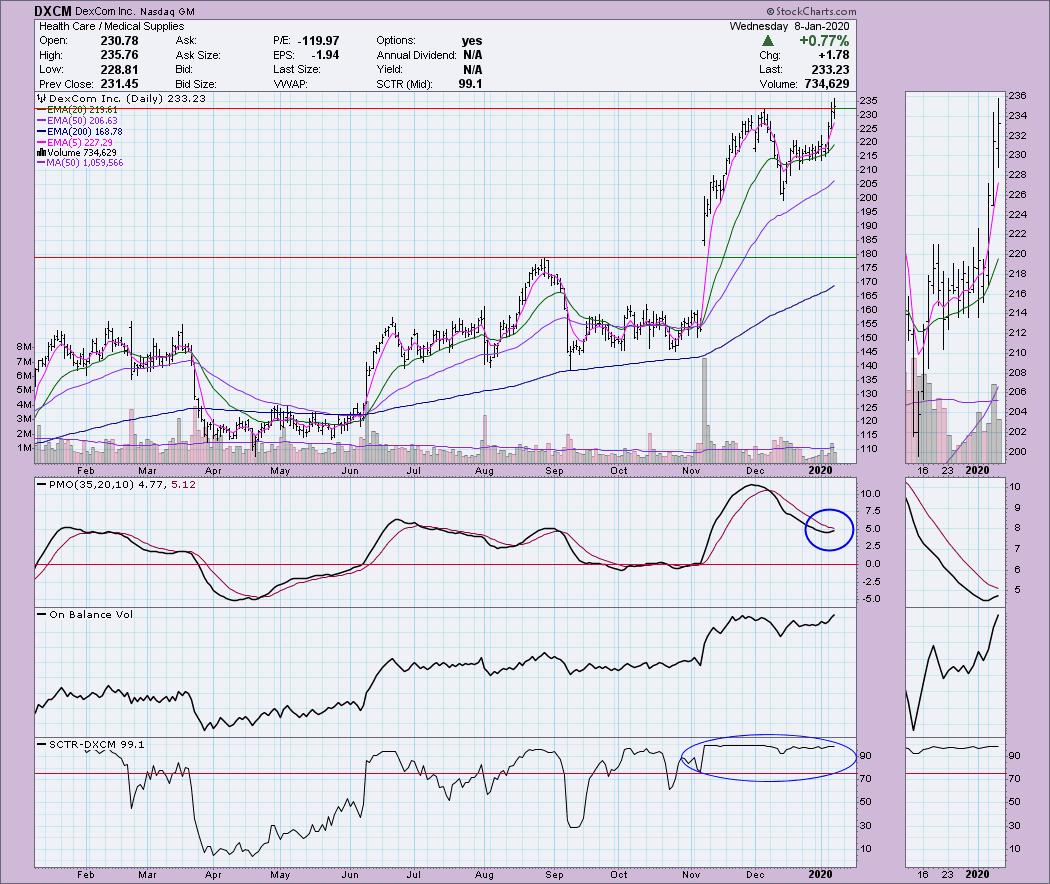
DexCom Inc (DXCM) - Earnings: 2/19 - 2/24/2020
DXCM broke out today and closed above the previous top. The PMO is reaching for a BUY signal and the OBV is confirming the price rise. The SCTR is very strong indicating relative and internal strength. I think the $220 area would be a good area to consider a stop.
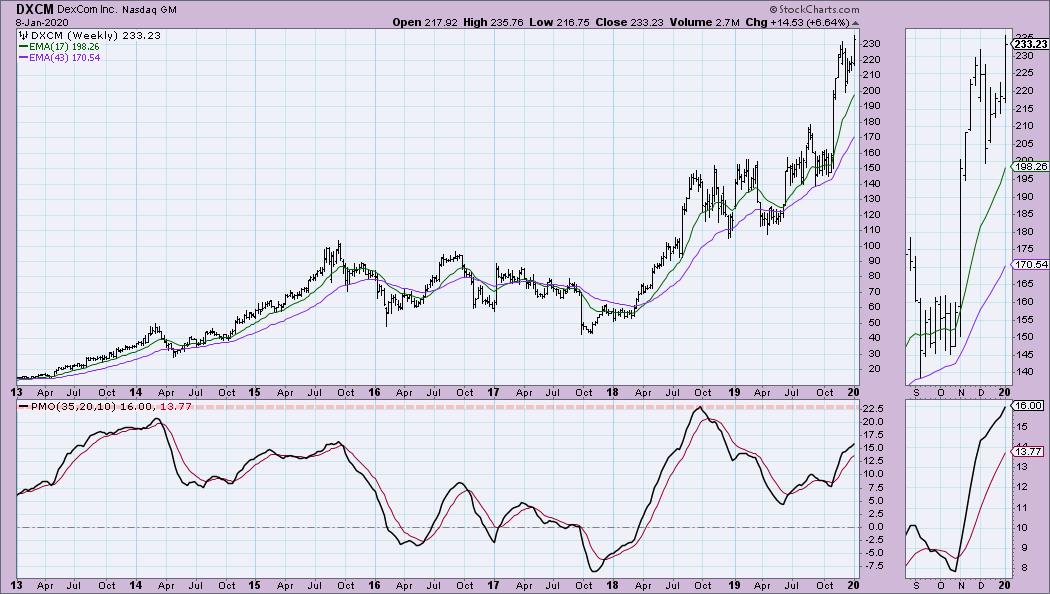
The weekly chart looks great. Although price is overbought, the PMO is not and is rising nicely.
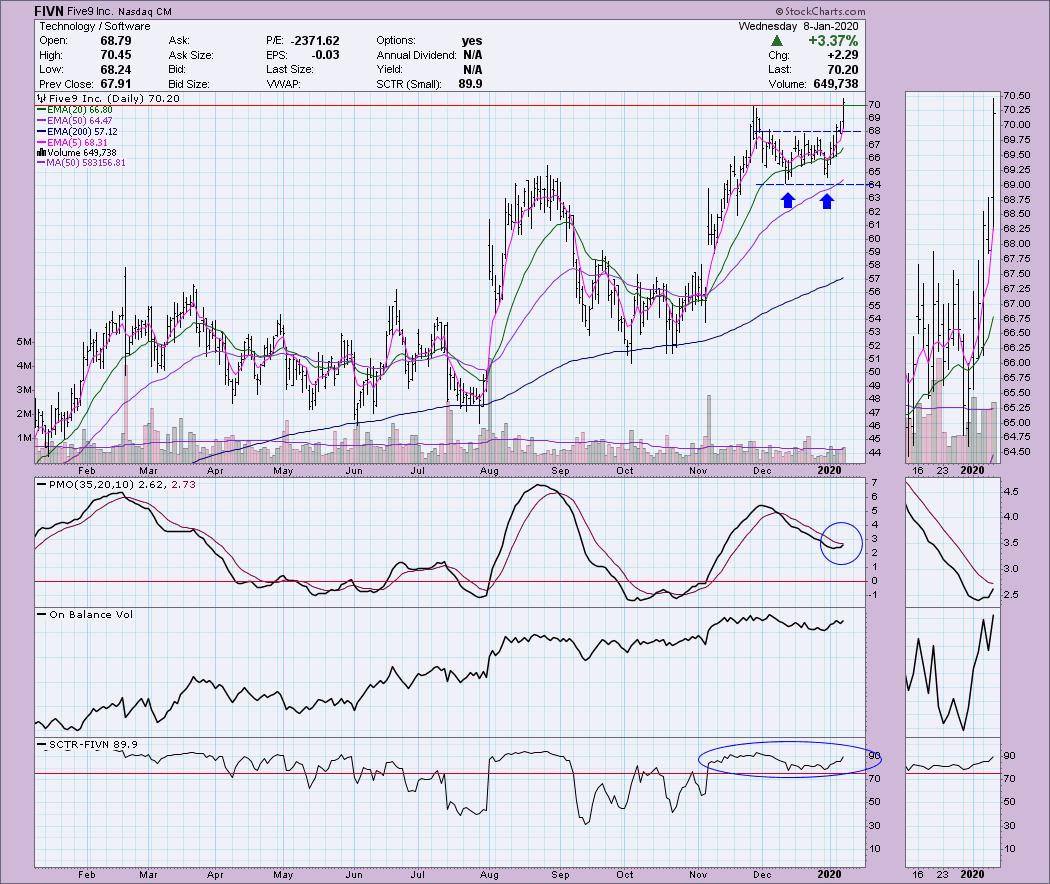
Five9 Inc (FIVN) - Earnings: 2/17 - 2/21/2020
FIVN formed a double-bottom and broke out this week to execute the pattern. Today price broke out and closed above the November top. I might wait for a pullback before entering, but this one could see more run up into earnings. The PMO is rising and nearing a BUY signal. The SCTR remains high in the "hot zone" above 75. The only thing I wish I saw on this would be the OBV making a new high on this breakout.
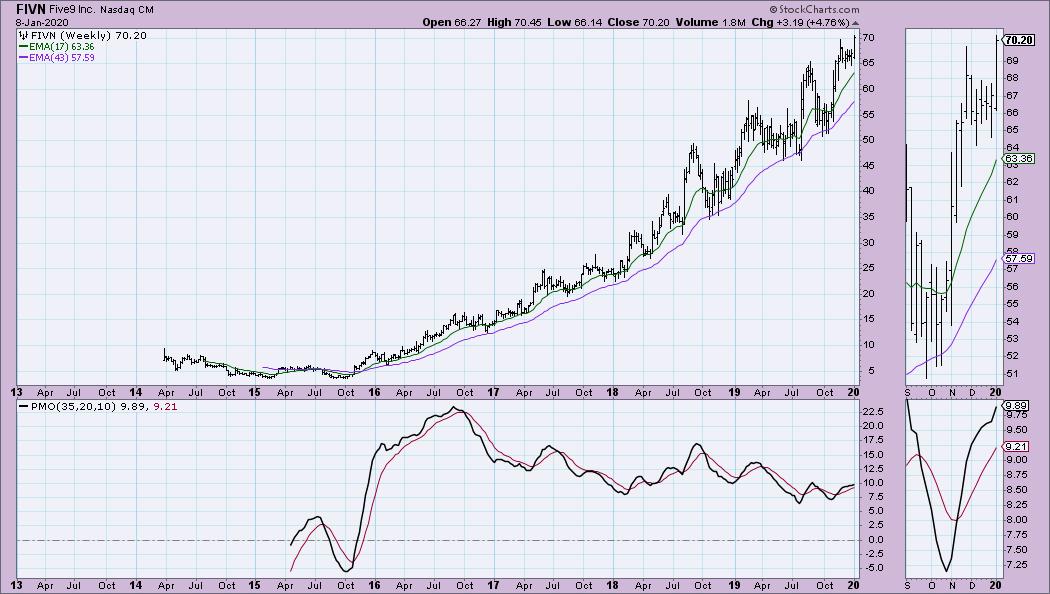
The weekly chart is positive and although price has been in a long-term rising trend, it has experienced some difficult corrections after high-flying moves. The rising trend isn't parabolic and that is good. This one is on my short list as an intermediate-term investment, along with CIGNA.
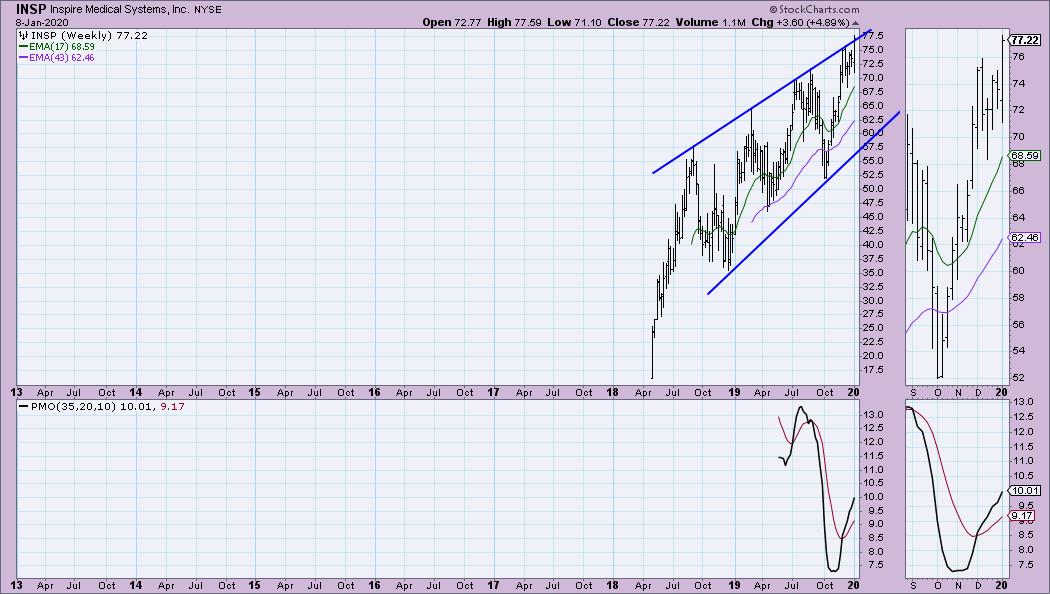
Inspire Medical Systems Inc (INSP) - Earnings: 11/5/2019
This is how the OBV should react on a breakout. Notice it took out the previous top easily. The actual volume pattern suggests a possible exhaustion given the contraction the last two days and a pullback could be useful. The PMO is rising and nearing a BUY signal. The SCTR has been in the hot zone for most of the year.
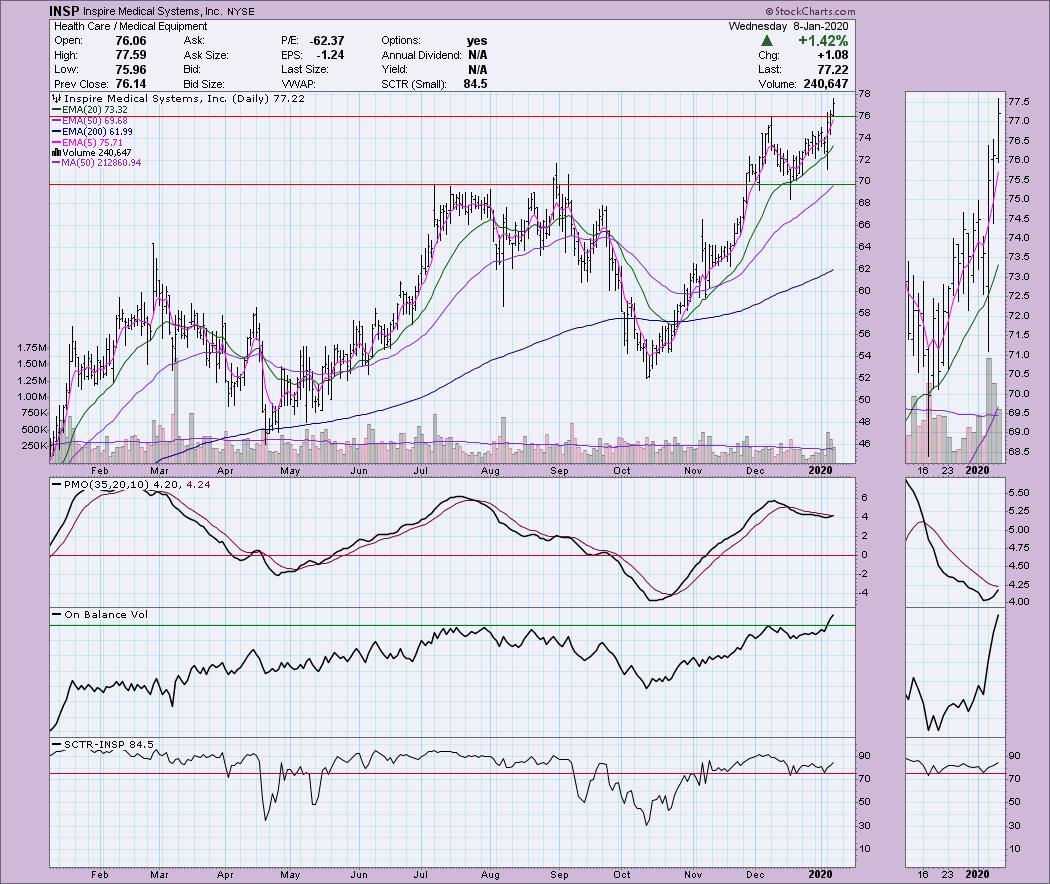
There is a giant rising wedge which is bearish, but notice that we might be seeing a bullish resolution as price is attempting to breakout of the pattern to the upside, not the downside. The PMO is rising nicely but there isn't that much history there.
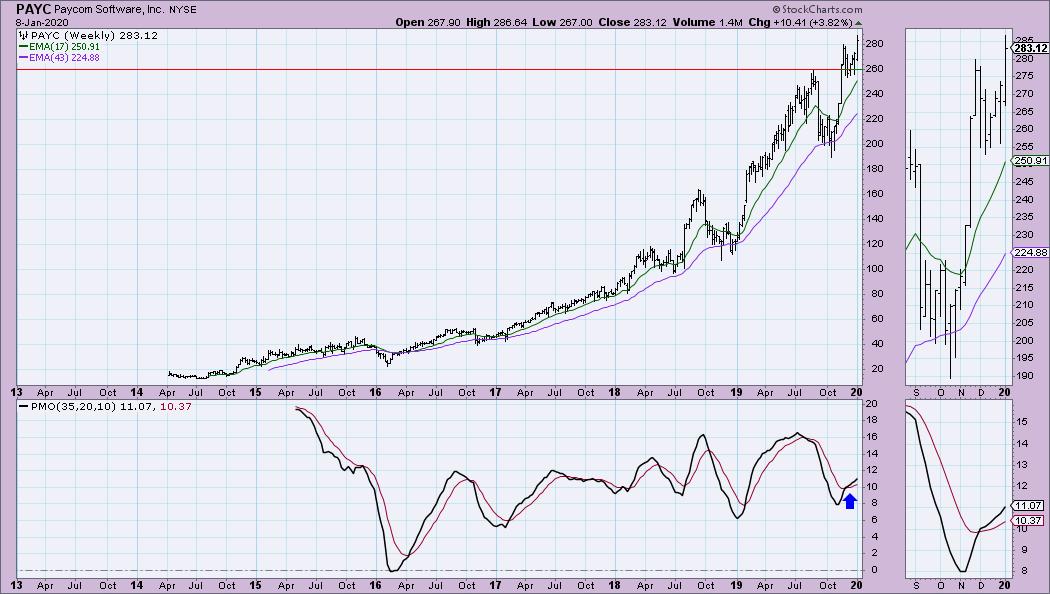
Paycom Software Inc (PAYC) - Earnings: 2/3 - 2/7/2020
Here's my repeat from yesterday. Price continued to breakout today and held onto support (previous resistance) at the November top. The PMO has now triggered a BUY signal. This one is on my very short list.
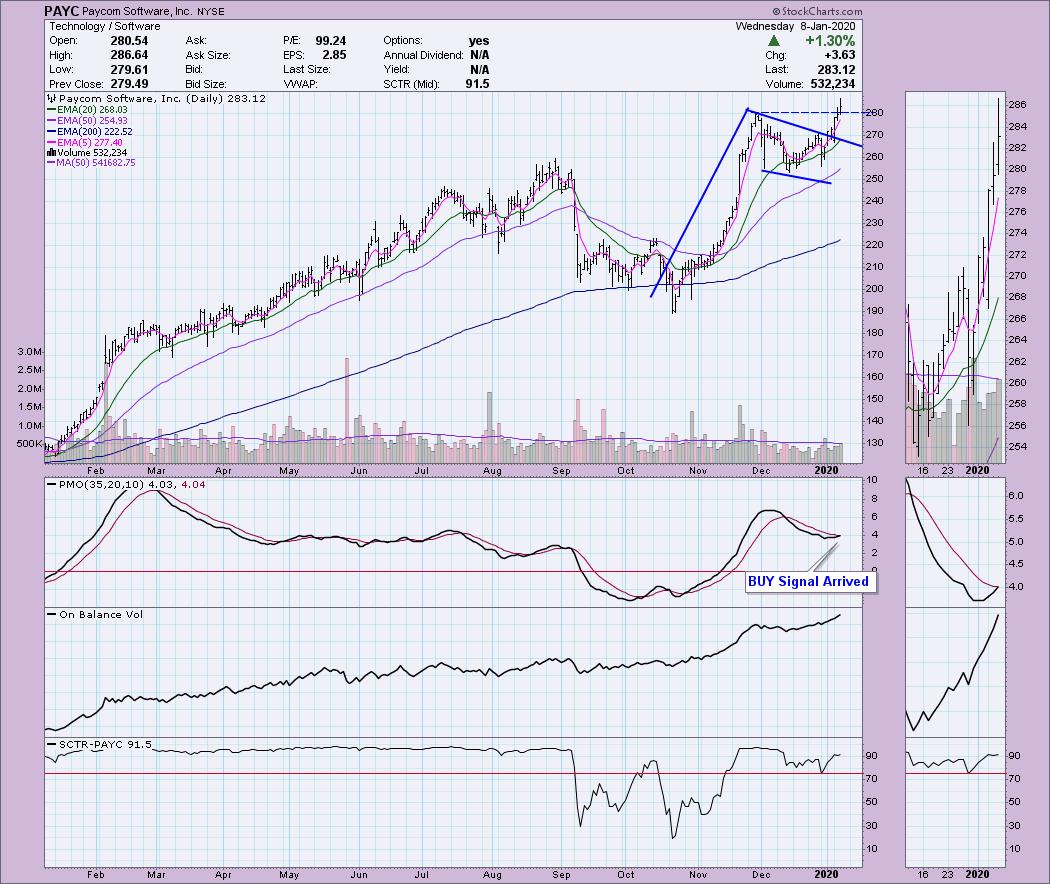
(Comments from yesterday): "The weekly PMO is on a BUY signal and as I noted above PAYC is at all-time highs. Yes, if you look closely you can spot a parabolic ascent, that is why setting a stop will be very important should it run quickly to the upside. I prefer trailing stops when you start to see parabolic moves on the daily chart. $260 could be a possible area for a stop as well depending on your risk appetite."
Full Disclosure: I do not own any of the stocks presented. I would like to see the market resolve the current consolidation and show me it is ready to rally again. I am 60% cash.

Erin Swenlin will be presenting at the The MoneyShow Las Vegas on May 11-13, 2020! You'll have an opportunity to meet Erin and discuss the latest DecisionPoint news and Diamond Scans. The conference is free to attend or view online!
Watch the latest episode of DecisionPoint with Carl & Erin Swenlin LIVE on Mondays 5:00p EST or on the StockCharts TV YouTube channel here!
Technical Analysis is a windsock, not a crystal ball.
Happy Charting!
- Erin
erinh@stockcharts.com
NOTE: The stocks reported herein are from mechanical trading model scans that are based upon moving average relationships, momentum and volume. DecisionPoint analysis is then applied to get five selections from the scans. The selections given should prompt readers to do a chart review using their own analysis process. This letter is not a call for a specific action to buy, sell or short any of the stocks provided. There are NO sure things or guaranteed returns on the daily selection of "diamonds in the rough."
Helpful DecisionPoint Links:
DecisionPoint Shared ChartList and DecisionPoint Chart Gallery
Price Momentum Oscillator (PMO)
Swenlin Trading Oscillators (STO-B and STO-V)
**Don't miss DecisionPoint Commentary! Add your email below to be notified of new updates"**f