
Today was a continuation of yesterday's decline. The hits keep coming and one of the punches appears to be the coronavirus. I've had quite a few of my friends ask me about whether it's time to start investing in the pharma and biotech space, as well as medical supplies. Remember the phrase, "We will drink no wine until it is time"? It's definitely NOT the time to expand your positions. In fact, I've been stopped out on this decline and I'm now 35% cash with zero interest in adding positions so I will not write about buying when I am not. However, these stocks in the biotech and pharma groups are worth keeping on your radar. Developments in combatting the coronavirus will take months from what I understand, so an immediate payoff isn't necessarily likely, it is best to make sure the technicals are lining up before wading into this or any other investment arena (unless you like options and short positions, which I do not).
SPDR S&P Pharmaceuticals ETF (XPH) - Earnings: N/A
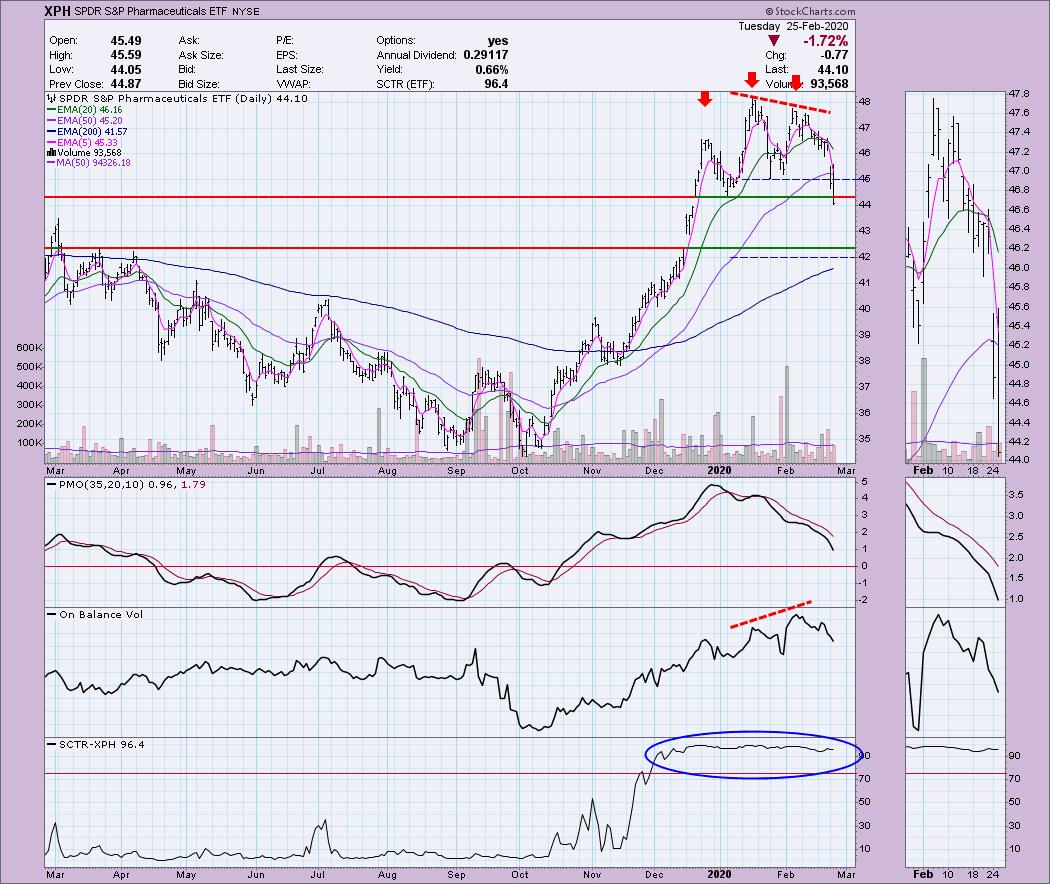
One way to possibly take advantage of any innovation in this industry group is to look at the SPDR ETF for Pharmaceuticals. It isn't a pretty chart with a double or triple top and a huge breakdown. The PMO is moving quickly into neutral territory. This is an excellent example of a 'reverse divergence' that could've given us some warning. Notice that the OBV made a new high when price made a lower high. This tells us that despite high volume that pushed the OBV to a higher top, price couldn't do the same. Remember that price usually follows volume, so when it doesn't that is a warning. The SCTR remains high for this ETF which is why I would expect to see it rebound nicely when a market bottom is finally put in. The next level of interest is at $42.25 which matches fairly closely to the minimum downside target of the double-top (blue dotted lines).
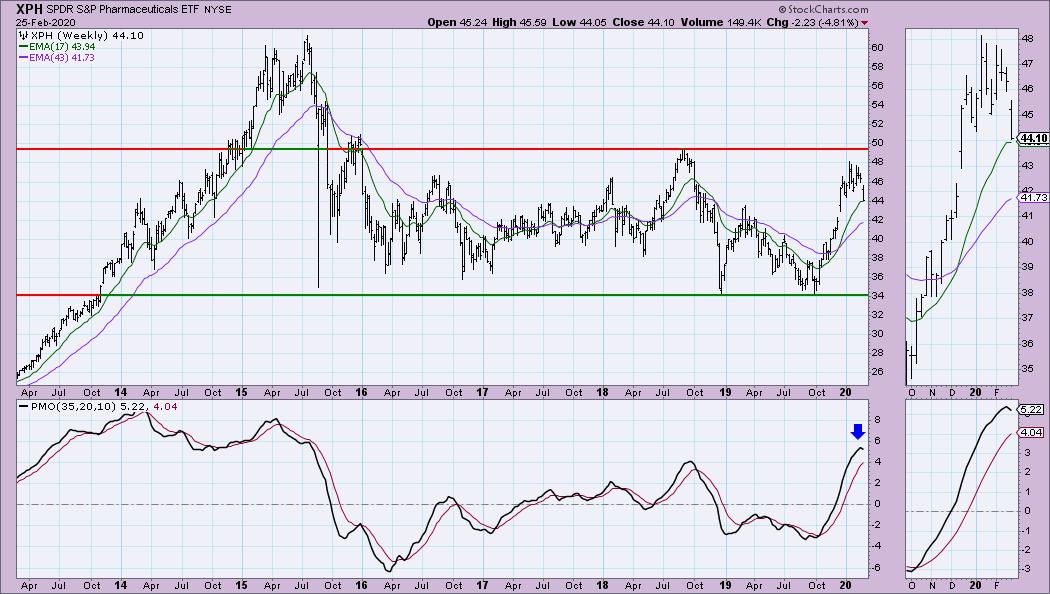
The weekly chart was already seeing signs of deterioration as the PMO had begun to decelerate. The top is due to this week's market action. Right now it is holding at the 17-week EMA so it could be an area of support, I just wouldn't be interested yet.
Welcome to DecisionPoint Daily Diamonds, wherein I highlight five "diamonds in the rough." These are selected from the results of my DecisionPoint scans, which search for stocks that could benefit from the trend and condition of the market. Remember, these are not recommendations to buy or sell, but are the most interesting of the stocks that surfaced in my scans. My objective is to save you the work of the initial, tedious culling process, but you need to apply your own analysis to see if these stocks pique your interest as well. There are no guaranteed winners here!
Bristol Myers Squibb Co (BMY) - Earnings: 4/23/2020 (BMO)
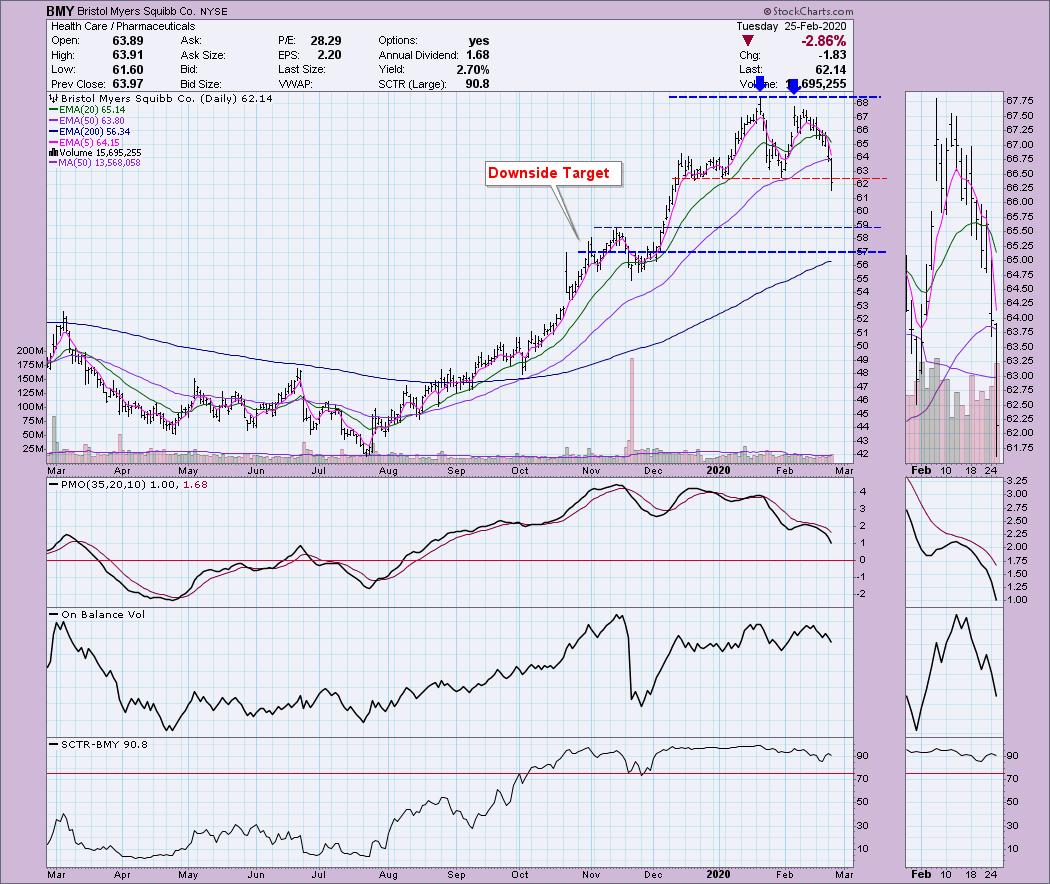
While Bristol Myers is not actually associated with developing a vaccine for coronavirus, I believe they will still benefit if this area of the market improves. BMY was at the top of the Goldman Sachs list of companies that reported the highest amount of sales growth of ALL stocks in the broad market. This is a solid company with great earnings. I highly down they will be left behind if this group turns it around. Right now I would look for a test around $57 - $59. This stock could become a bargain with its excellent SCTR ranking.
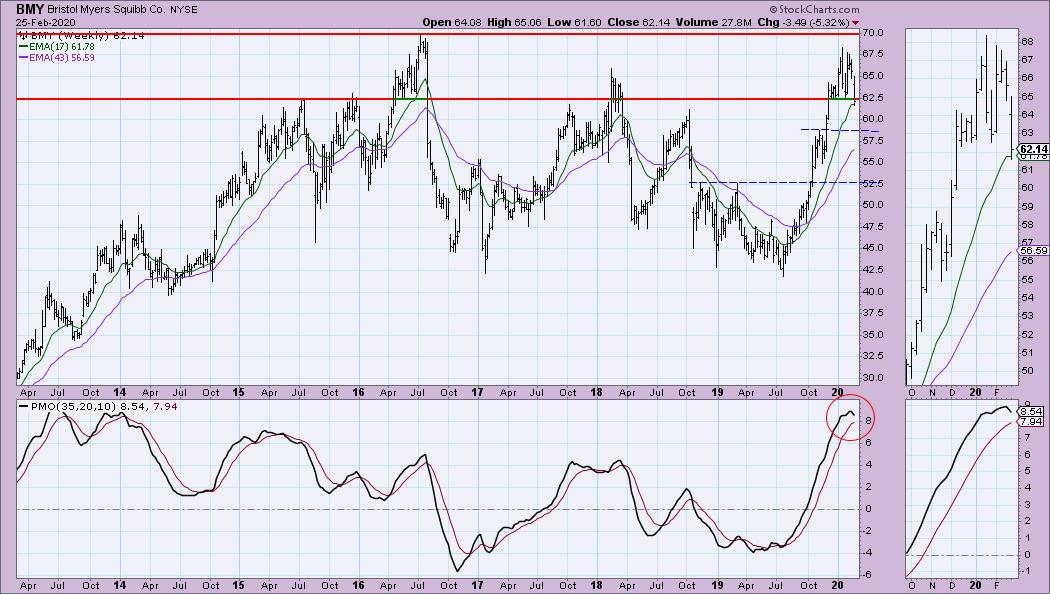
The importance of this lost support level is serious based on the weekly chart. The PMO has turned down (and was already doing last week) and with this loss of support, it's not looking good yet.
Don't forget, on Thursdays I look at reader-requested symbols, so shoot me an email at erin@decisionpoint.com. I read every email I receive and try to answer them all!
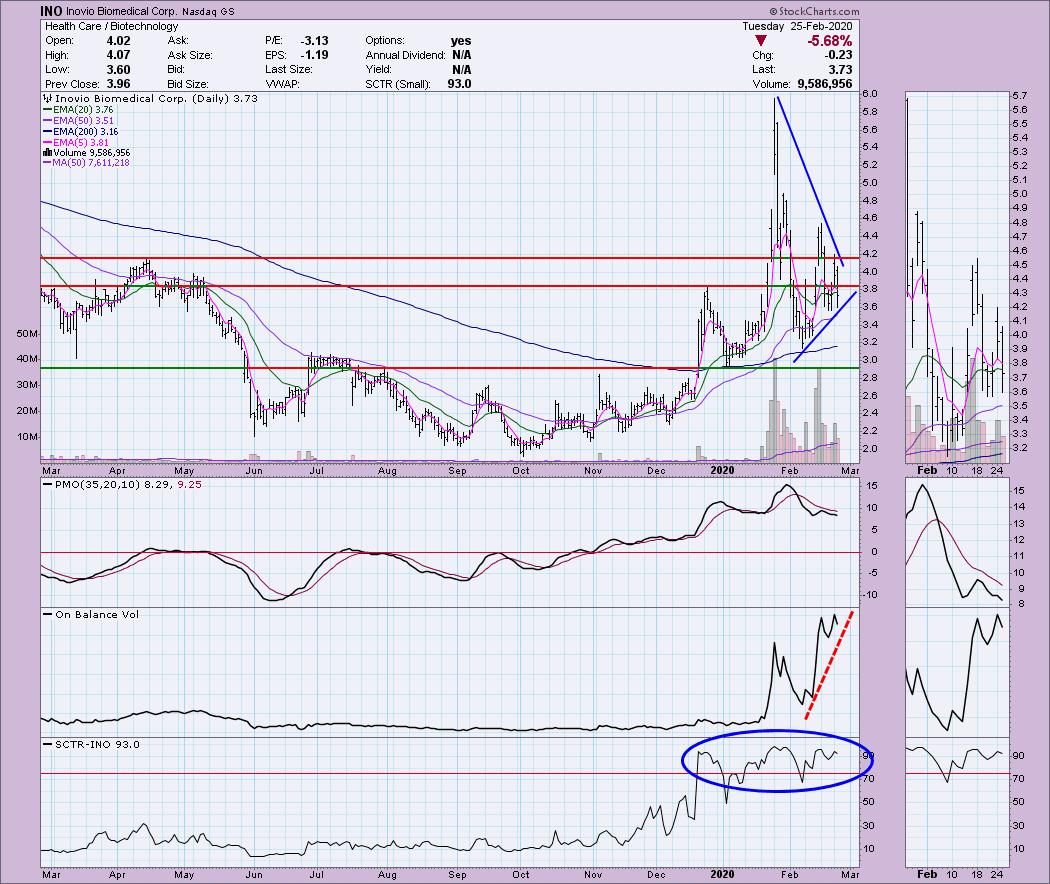
Inovio Biomedical Corp (INO) - Earnings: 3/12/2020 (AMC)
I hesitated to even include this stock as it is very low priced and highly volatile. Yet with huge volume numbers right now and it's involvement in coronavirus vaccine research, it was worth a gander. Obviously the PMO topping below its signal is terrible. Yet, we have a symmetrical triangle (although a little wonky) which is a continuation pattern with an expectation of an upside breakout. The OBV tells us different information. On the one hand rising bottoms are confirming the rising trend. However, the reverse divergence on the OBV tops with price isn't great. I think you could chalk that up to odd volume numbers coming in due to the virus, but it is something to be aware of. Large volume hasn't pushed price to higher highs, instead it moved to much lower highs. The SCTR is healthy despite the volatility.
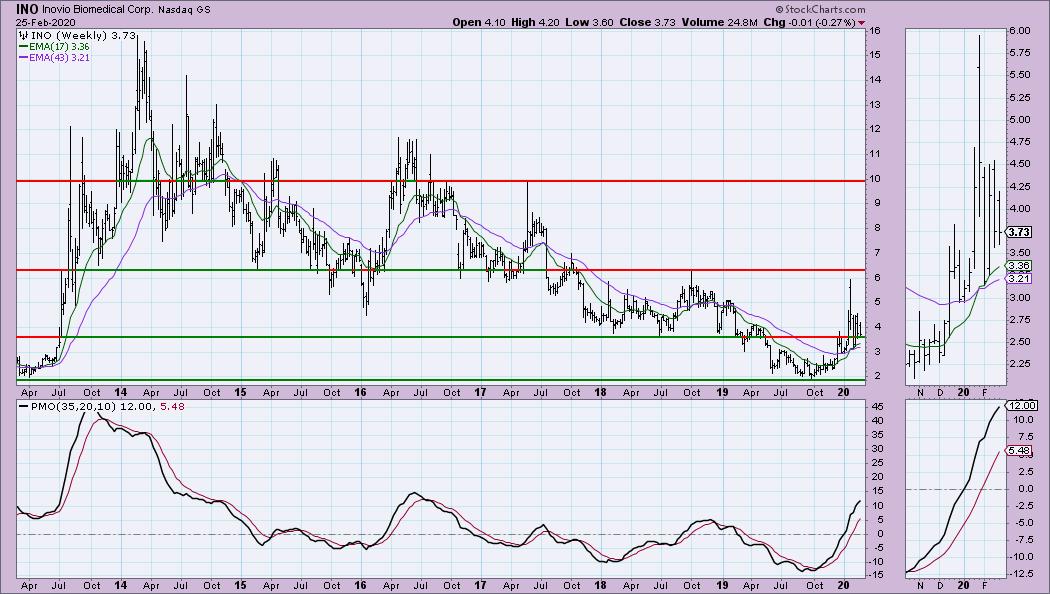
It appears that price may've moved back into a price range we saw in 2018. The PMO looks nice on the weekly chart. Again, this isn't my cup of tea as far as an investment, but this one could be attractive if it can hold above $3.50.
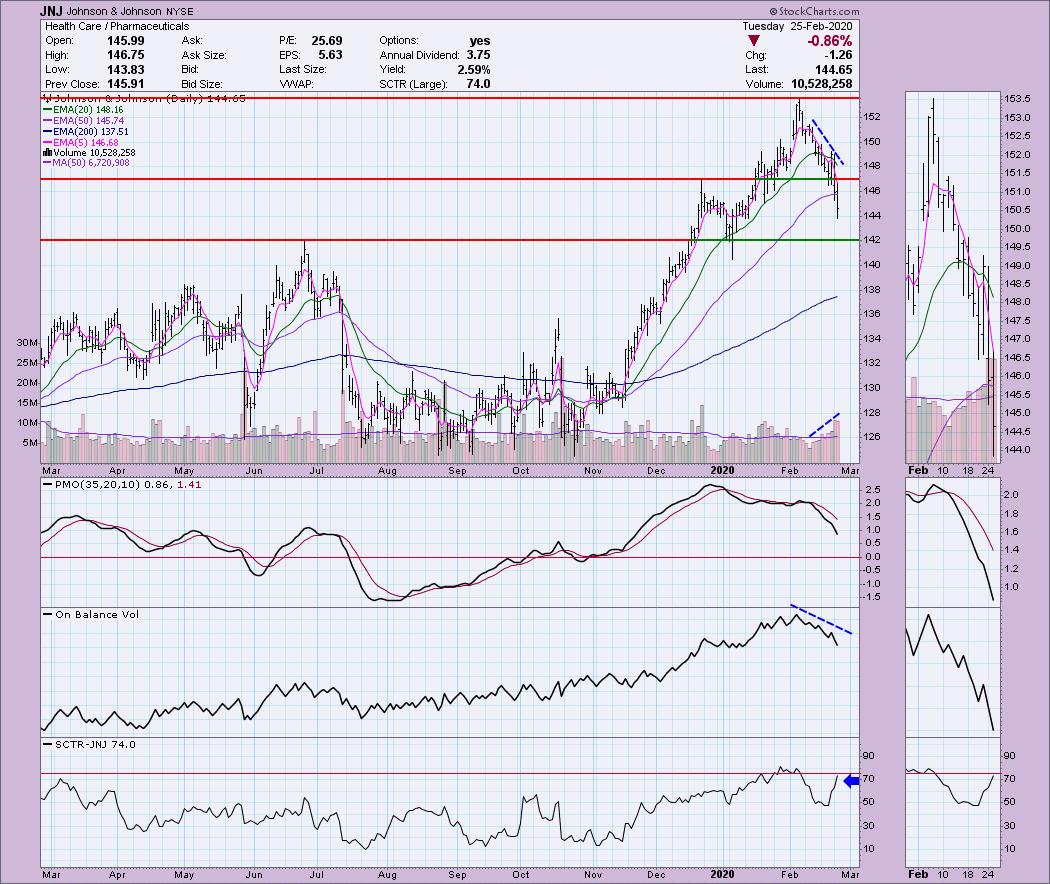
Johnson & Johnson (JNJ) - Earnings: 4/14/2020 (BMO)
Another stalwart pharma company is of course Johnson and Johnson. According to their website, they will be working directly with the US government on combatting coronavirus. The stock, like others, has been suffering from the market decline, but it was already in free fall. "V" tops work like "V" bottoms. If it cannot hold support at $142, a "V" top could imply a drop all the way down the basing pattern between August and October. Notice that volume has been increasing on this big decline. A positive is the SCTR on the chart but it doesn't help to be ranked high among your peers simply because you aren't the biggest loser. With a healthy dividend and yield, this one like BMY should be on your watchlist.
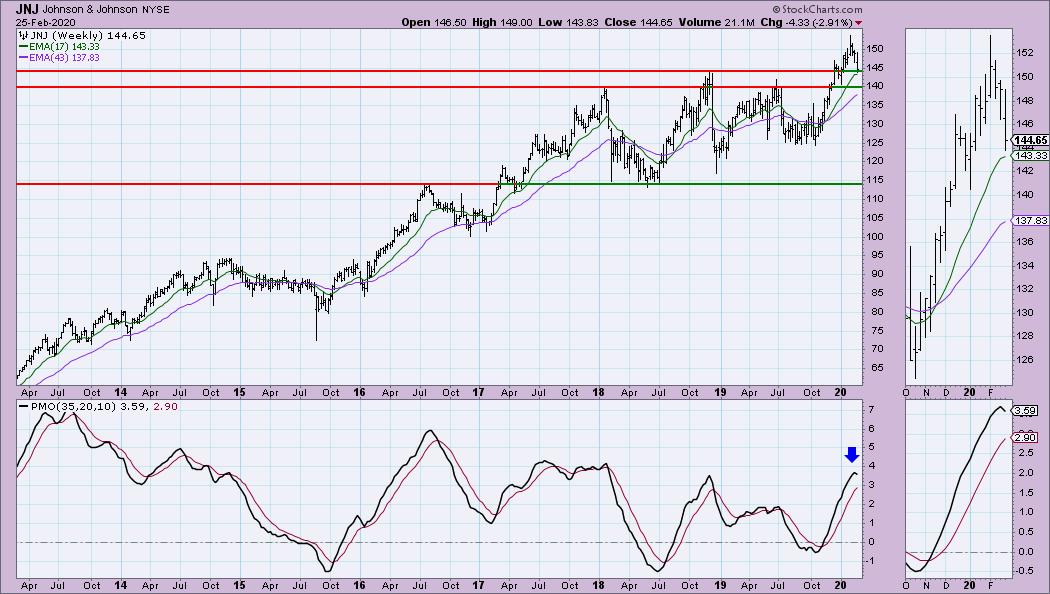
The weekly chart shows the PMO topping along with price. The importance of the support levels on the daily chart are even more clear on this chart. $140 is the line in the sand.
Sanofi SA (SNY) - Earnings: 4/24/2020 (BMO)
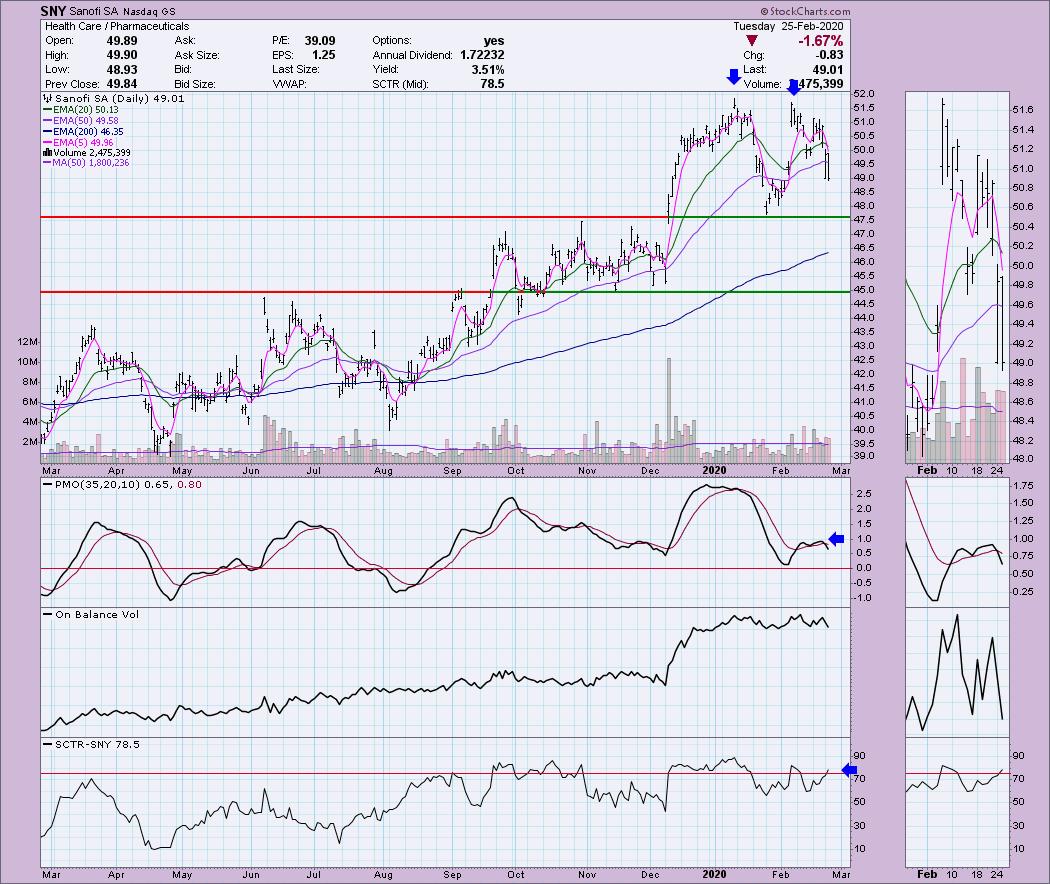
This is one of the companies that the US government will be working with on the coronavirus based on this news story directly from their website. This will go on my watchlist with JNJ. Right now there is a bearish double-top in play. We do not want to see this one execute as the minimum downside target would be well past the $45 support area I'm focused on. The PMO was on its way up twice but it failed to hold the BUY signal this time around. The SCTR did enter the 'hot zone' above 75, but my comments above hold true...a stock that is outperforming its brethren in a bear market could just be looked at as the best of the losers. This one needs time to mature, but it could get interesting if they are successful with providing a vaccine with others.
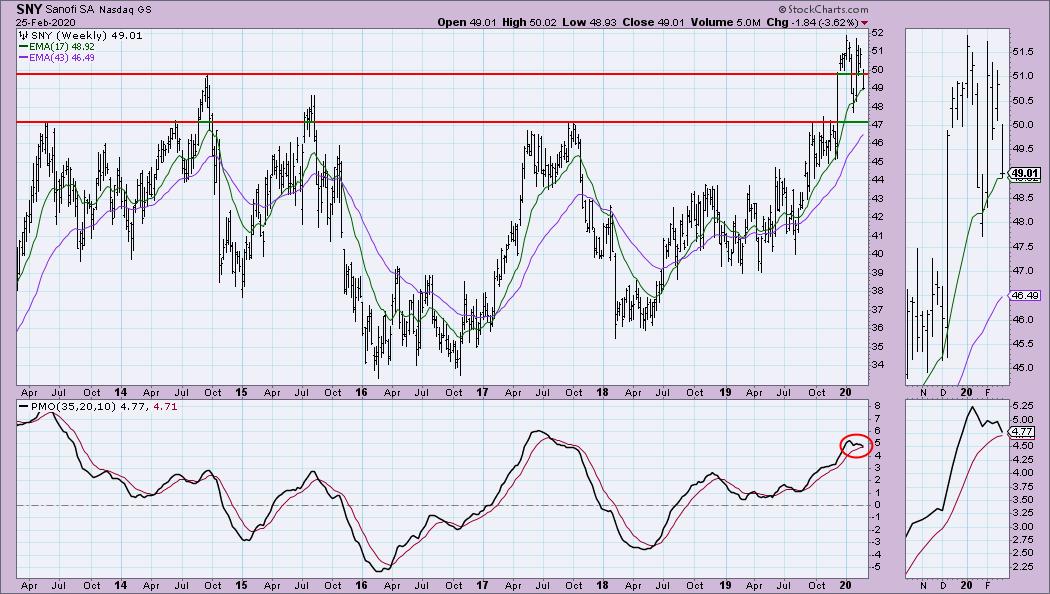
The weekly PMO is headed for a SELL signal. It just isn't time for this one. I would be much more interested at the $47 level.
Current Market Outlook:
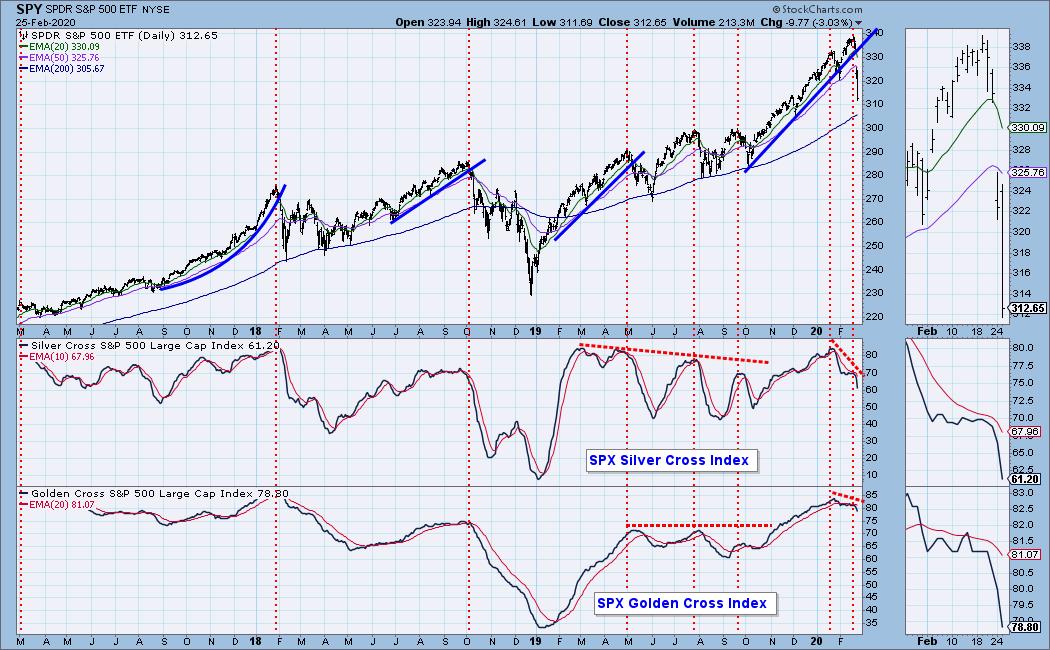
Market Environment: It is important to consider the odds for success. The Silver Cross Index measures the percentage of stocks on IT Trend Model BUY signals (20-EMA > 50-EMA), while the Golden Cross Index measures the percentage of stocks on LT Trend Model BUY signals (50-EMA > 200-EMA). Don't forget that as a "Diamonds" member, you have access to our GCI/SCI curated ChartList on DecisionPoint.com. You'll find it under "Members Only" links on the left side on the Blogs and Links Page. Here are the current percentages on the Silver and Golden Cross Indexes:
Diamond Index:
- Diamond Scan Results: 1
- Diamond Dog Scan Results: 30
- Diamond Bull/Bear Ratio: 0.03
For a more comprehensive review of current market conditions as well as analysis of Dollar, Gold, Oil and Bonds, subscribe to the DecisionPoint Alert! For a LIMITED TIME you can get a coupon code that will give you a discount for bundling your Diamonds subscription with the DecisionPoint Alert! Contact support@decisionpoint.com for more details.
Full Disclosure: I do not own any of the stocks above. I'm currently 35% in cash.

Erin Swenlin will be presenting at the The MoneyShow Las Vegas on May 11-13, 2020! You'll have an opportunity to meet Erin and discuss the latest DecisionPoint news and Diamond Scans. The conference is free to attend or view online!
Watch the latest episode of DecisionPoint with Carl & Erin Swenlin LIVE on Mondays 5:00p EST or on the StockCharts TV YouTube channel here!
Technical Analysis is a windsock, not a crystal ball.
Happy Charting!
- Erin
erinh@stockcharts.com
NOTE: The stocks reported herein are from mechanical trading model scans that are based upon moving average relationships, momentum and volume. DecisionPoint analysis is then applied to get five selections from the scans. The selections given should prompt readers to do a chart review using their own analysis process. This letter is not a call for a specific action to buy, sell or short any of the stocks provided. There are NO sure things or guaranteed returns on the daily selection of "diamonds in the rough."
Helpful DecisionPoint Links:
DecisionPoint Shared ChartList and DecisionPoint Chart Gallery
Price Momentum Oscillator (PMO)
Swenlin Trading Oscillators (STO-B and STO-V)
For more links, go to DecisionPoint.com!