
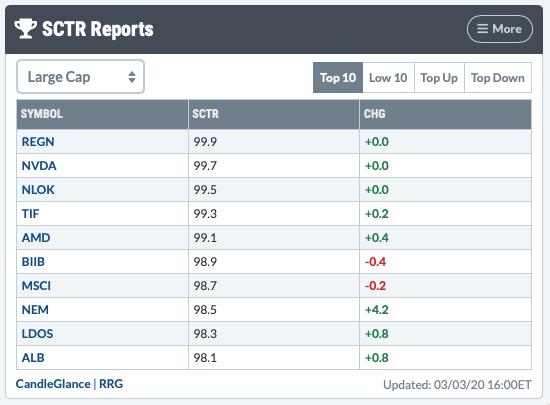
While the market and indicators are flashing "oversold", my sense is that it isn't a strong foundation for a rally...more like thin ice. We should be either compiling a strong watch list or seeking pockets of strength. Today I decided to look at a few stocks that are still outperforming based on their StockCharts Technical Rank (SCTR). My scans are not returning the results I want. I don't even feel comfortable recommending short positions right now. We are experiencing a roller coaster of a market that is fueled by fear. A short position could be a quick loser when we get the irregular snap back rallies. I've moved mostly into cash (60%) but am holding the Dollar (UUP), Gold (GLD) and Silver (SLV). Part of our mission statement is to determine the trend and condition of the market and find stocks that will ride that tide. The market is trendless right now, consequently, I don't see many stocks impervious to the market in general. Take a look at these highly ranked stocks. When we do see a rally, these stocks are poised to do better than their brethren. Below is a current table of the top ten ranked stocks by SCTR:
Apple Inc (AAPL) - Earnings: 4/28/2020 (AMC)
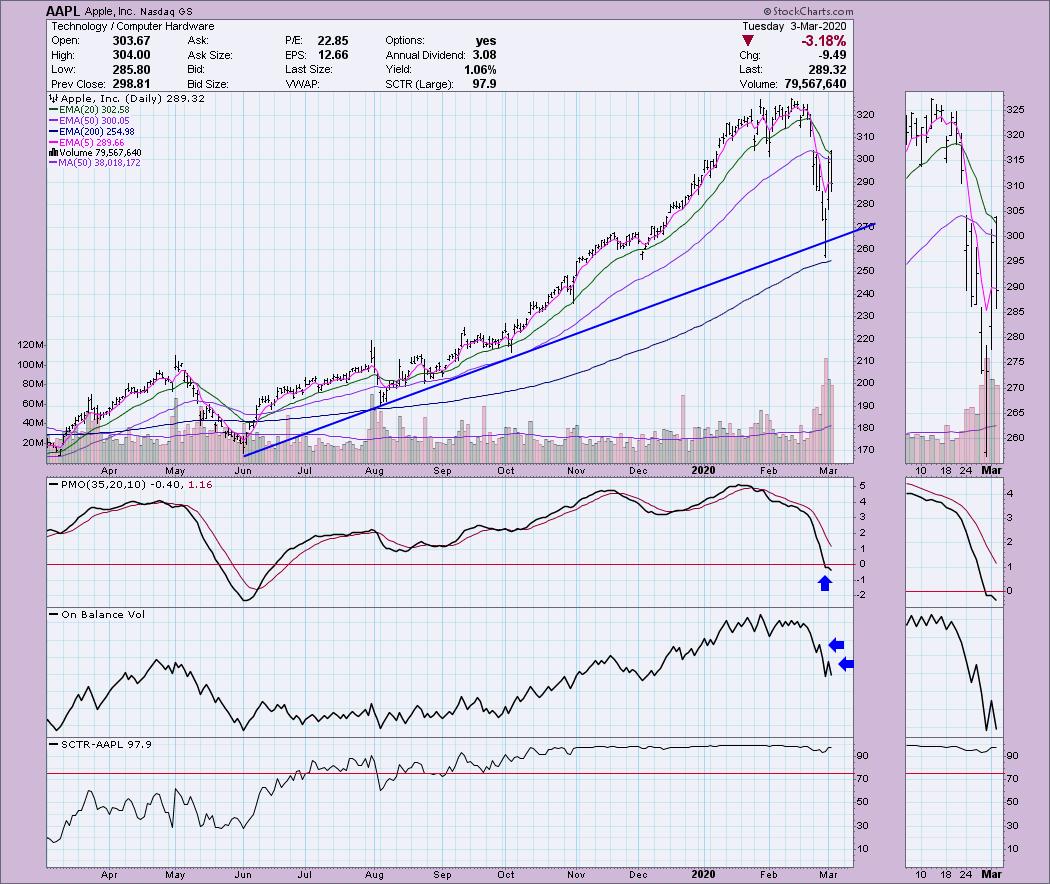
Apple wasn't on the list above, but let's face it, it drives the markets like no other. With a SCTR rank of 97.9, it isn't languishing. Monday was bad. It dropped below the intermediate-term rising trend. It didn't lose the 200-EMA as support and we did see it close near the top of the range that day. Now we are seeing the bounce produced yesterday and the pullback today. Price is not closing above the 20/50-EMAs yet so we could still see an IT Trend Model Neutral signal very soon. The PMO had been extremely overbought. It is now in neutral. It could move lower, but at least we are seeing some deceleration. The two OBV tops fell as price tops rose those days.
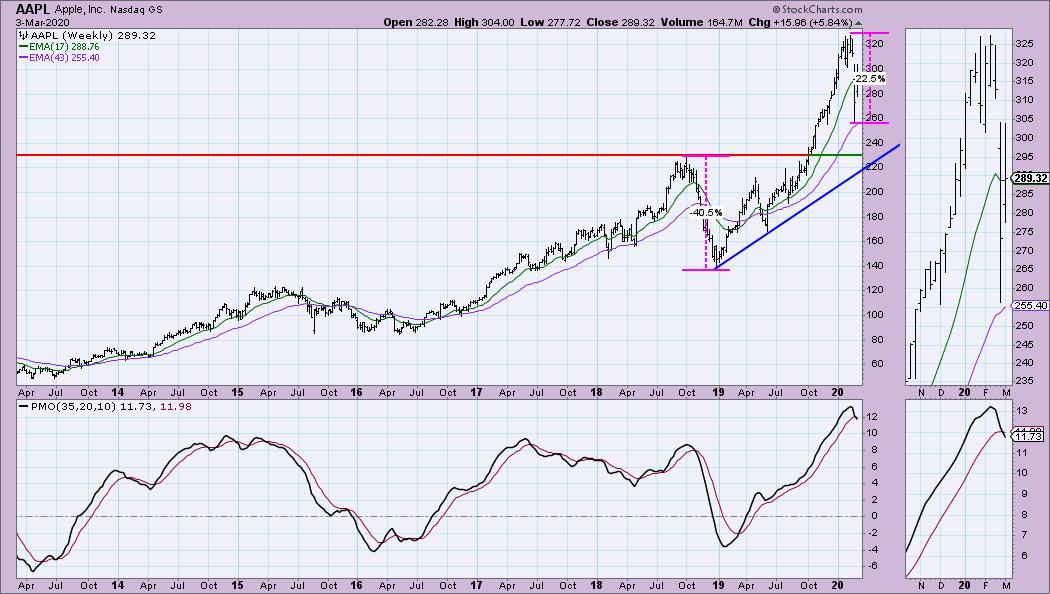
The weekly chart is a good news, bad news situation. Only piece of good news is that the long-term rising trend is still intact. However, note that the last correction on Apple was much deeper that the current one. I am looking for that rising trend to be tested. The PMO is triggering a SELL signal so far this week.
Welcome to DecisionPoint Daily Diamonds, wherein I highlight five "diamonds in the rough." These are selected from the results of my DecisionPoint scans, which search for stocks that could benefit from the trend and condition of the market. Remember, these are not recommendations to buy or sell, but are the most interesting of the stocks that surfaced in my scans. My objective is to save you the work of the initial, tedious culling process, but you need to apply your own analysis to see if these stocks pique your interest as well. There are no guaranteed winners here!
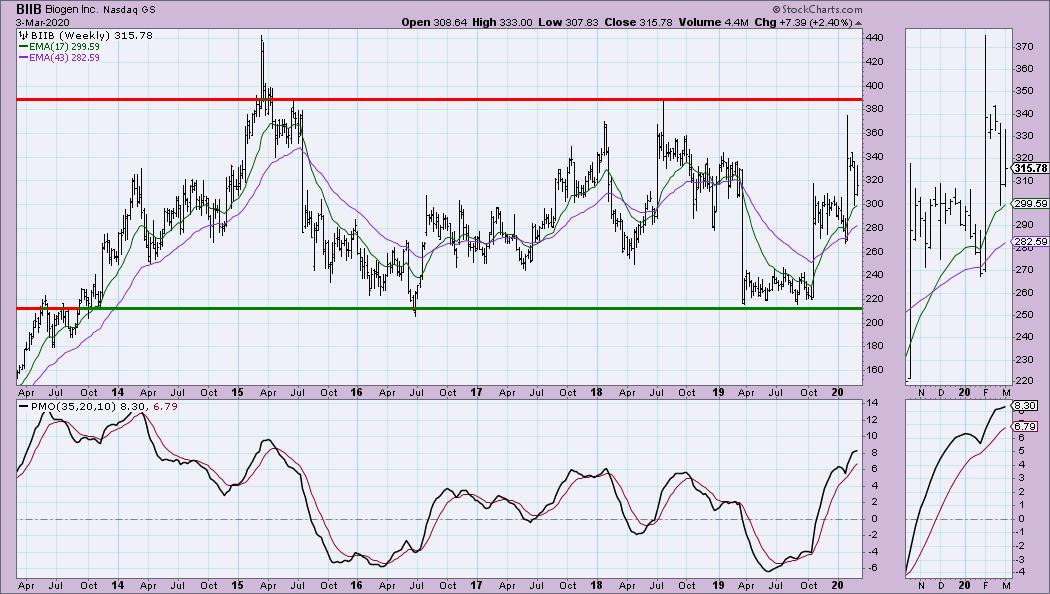
Biogen Inc (BIIB) - Earnings: 4/22/2020 (BMO)
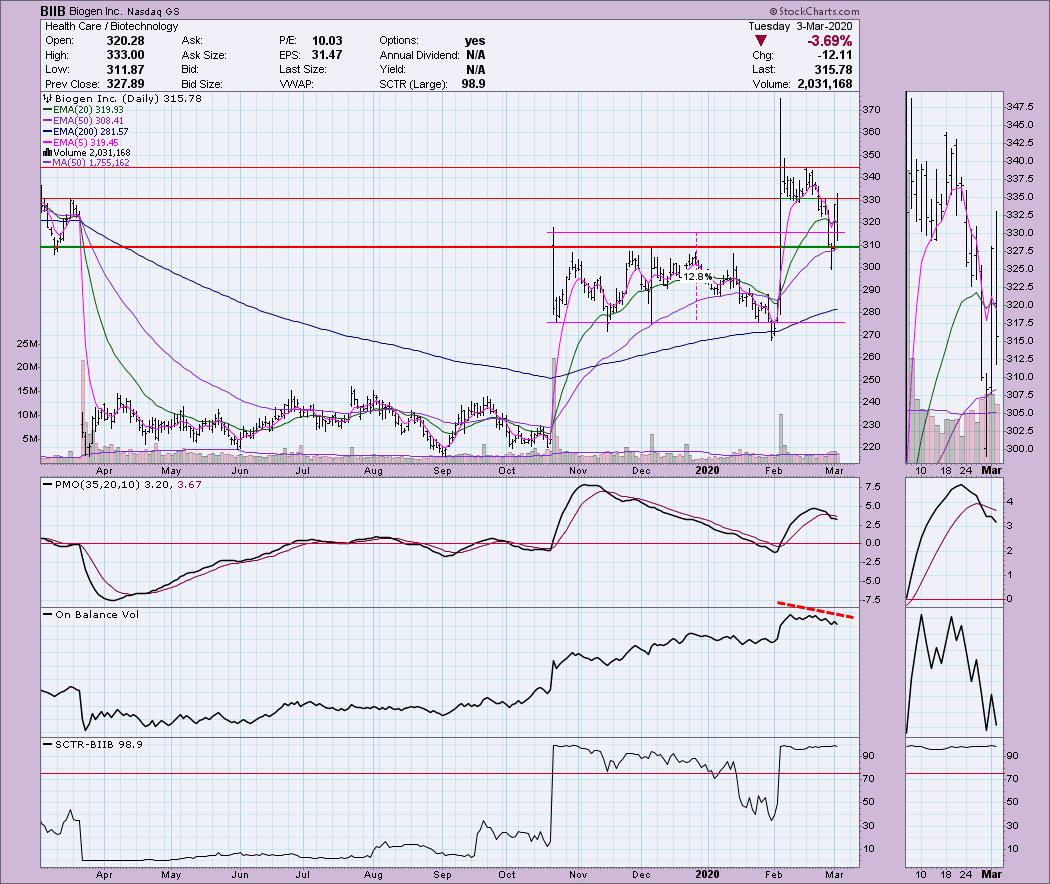
I am in favor of Healthcare stocks right now, although I'm not ready to put my money there until this begins to shake out. I believe this area of the market will lead the way in another 3 months or so and this is one of the large-caps I find interesting. While it did suffer on this correction, it has still really held support at $310. The PMO is on a SELL and the OBV is confirming the current decline so I'd add this to your watch list.
On the other hand, the weekly PMO is still quite favorable. We can see that price has been moving in a broad trading range since 2015-2018. Price is about midway in this range which leaves you open to a lot of risk if you enter this too early.
Don't forget, on Thursdays I look at reader-requested symbols, so shoot me an email at erin@decisionpoint.com. I read every email I receive and try to answer them all!
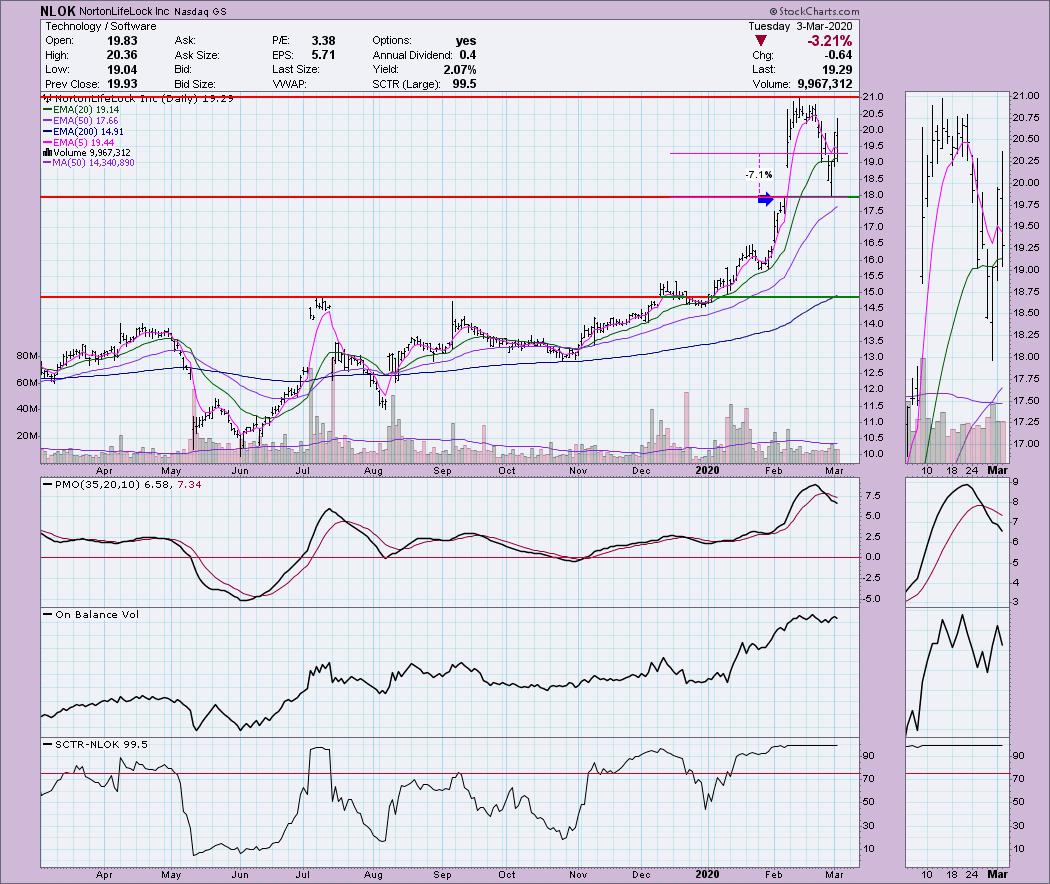
NortonLifeLock Inc (NLOK) - Earnings: 5/7/2020 (AMC)
The daily chart shows that strong SCTR. We saw price avoid closing the gap by pennies. Usually I find that bullish, but again the market is likely moving toward a bear market and very few stocks will be unaffected. The OBV tops are declining, but the good news is that negative volume hasn't been above average.
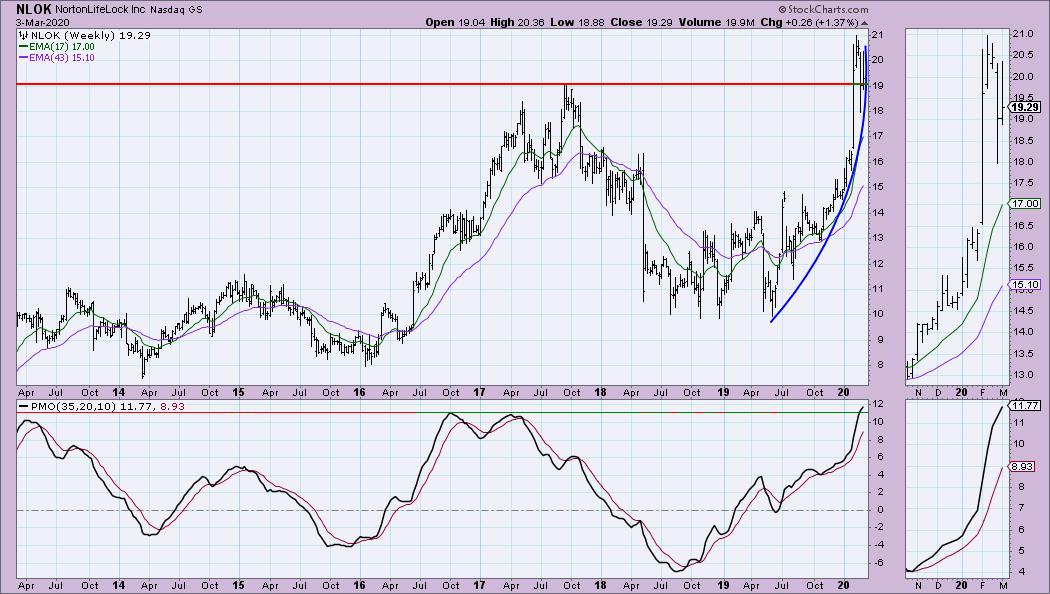
The PMO is very overbought, but it is rising. The price pattern is a parabola. These generally don't end well. This one is still too overbought right now.
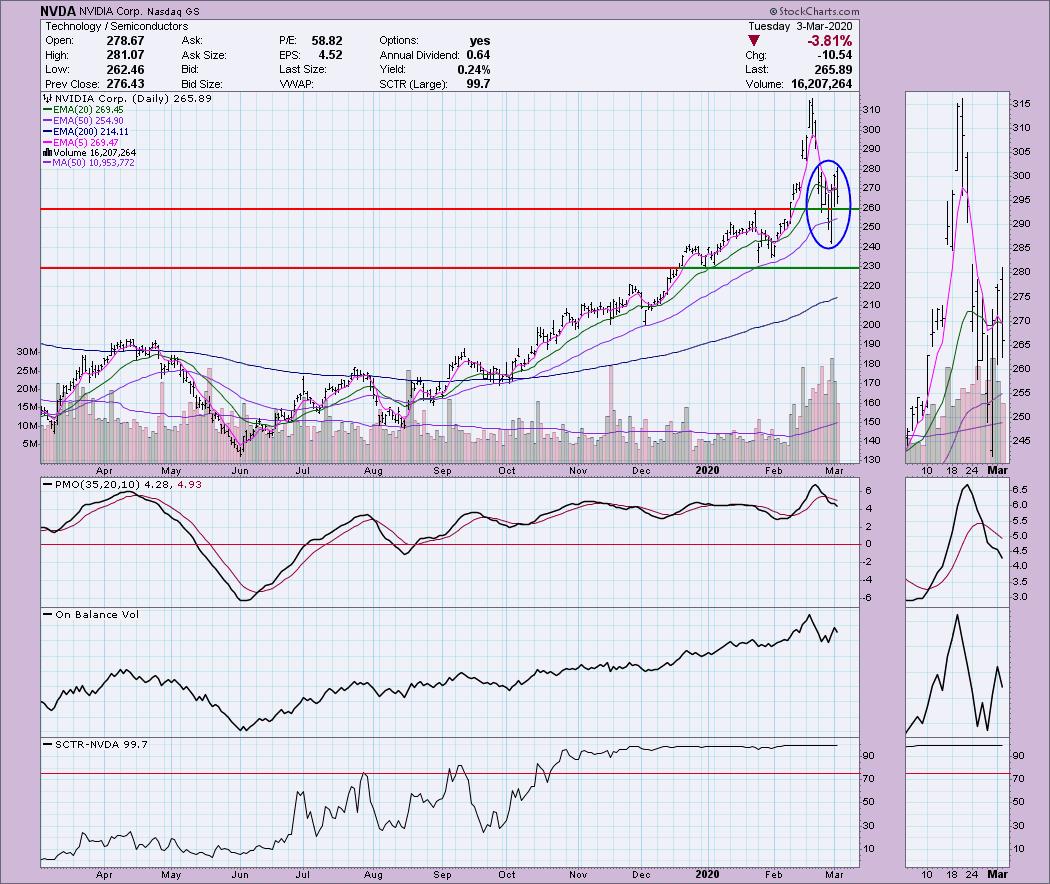
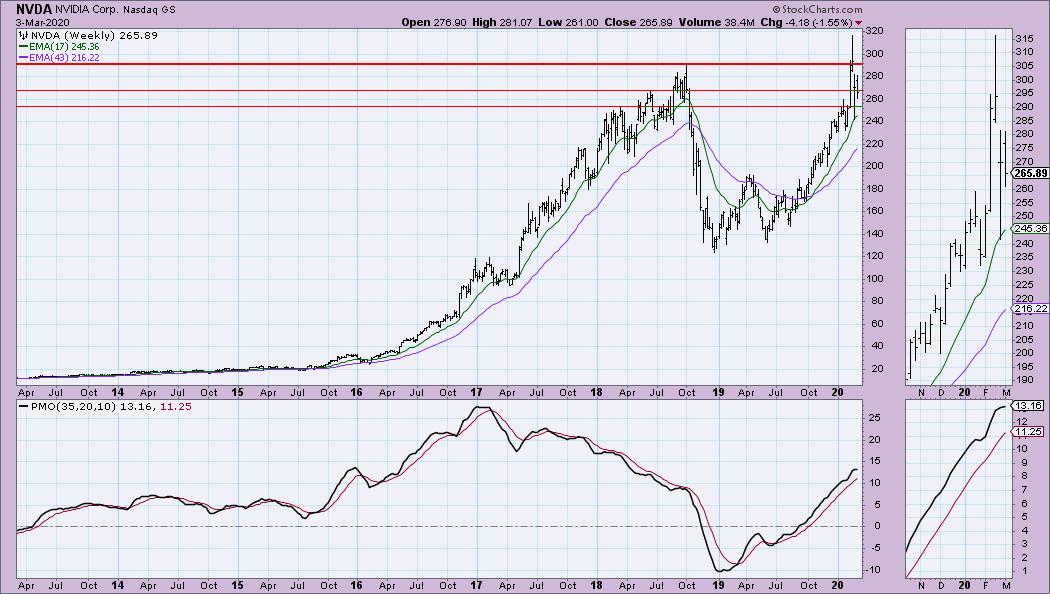
NVIDIA Corp (NVDA) - Earnings: 5/14/2020 (AMC)
I'm not a fan of this area of the market, but I have to admit these charts aren't as ugly as they could be. The PMO SELL signal isn't good and certainly declining tops on the OBV isn't good. However, there is a glimmer of hope here. Price didn't need to test the $230 level before bouncing and it hasn't even come close to its 200-EMA, unlike Apple. I've circled what could be a reverse island or even a "V" bottom. They are both bullish patterns.
I like the weekly chart given the rising but not overbought PMO and the recent breakout. Price remains above the 17-week EMA.
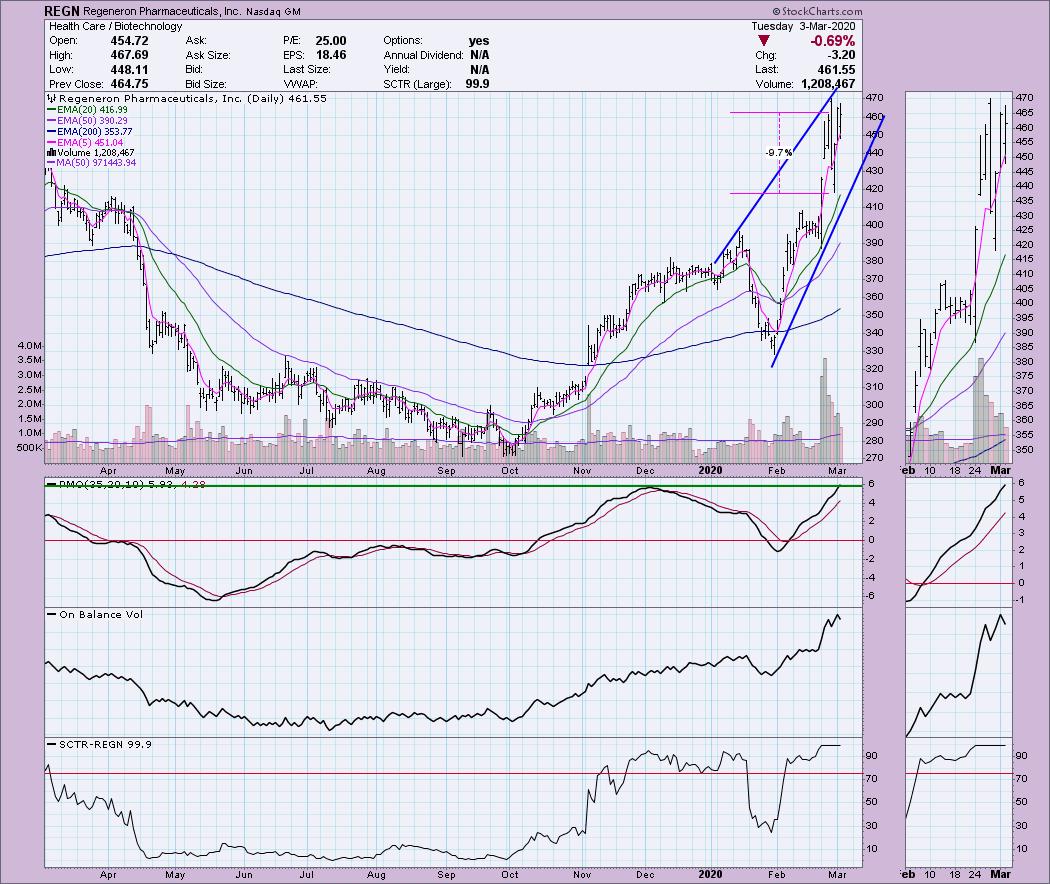
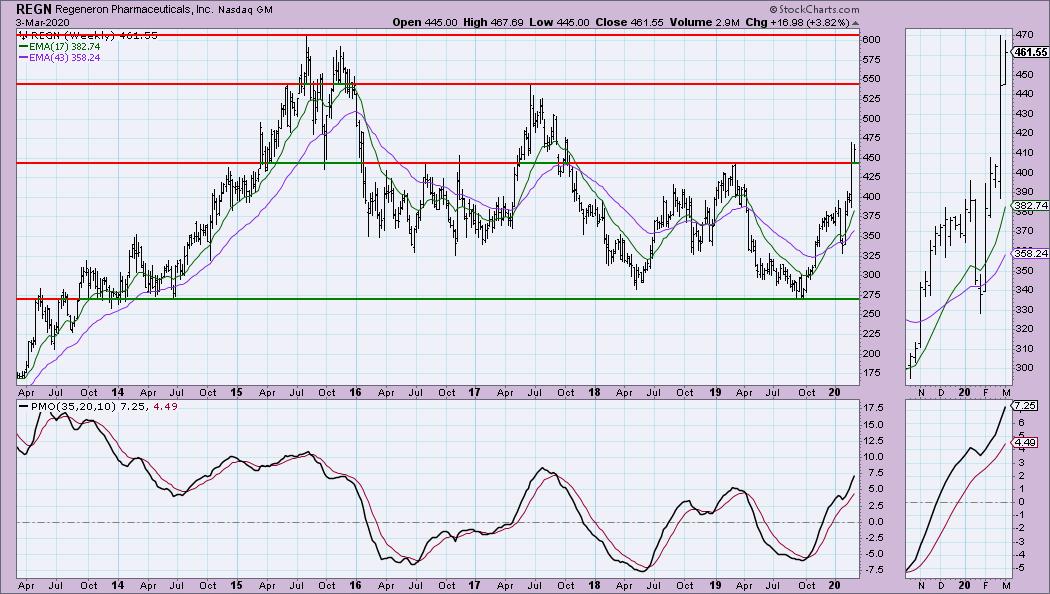
Regeneron Pharmaceuticals Inc (REGN) - Earnings: 5/5/2020 (BMO)
This is one I might take a chance on now. I still think it would be better to wait to see how this bearish rising wedge resolves. The PMO is rising nicely but it is very overbought and could use some more pullback.
If I only saw the weekly chart, I would be very bullish about REGN. But given the crazy-making market, I am holding off. Very nice breakout so far this week and if it holds $450, this could be one of those 'pockets of strength' stocks that will recover or maybe even buck the trend.
Current Market Outlook:
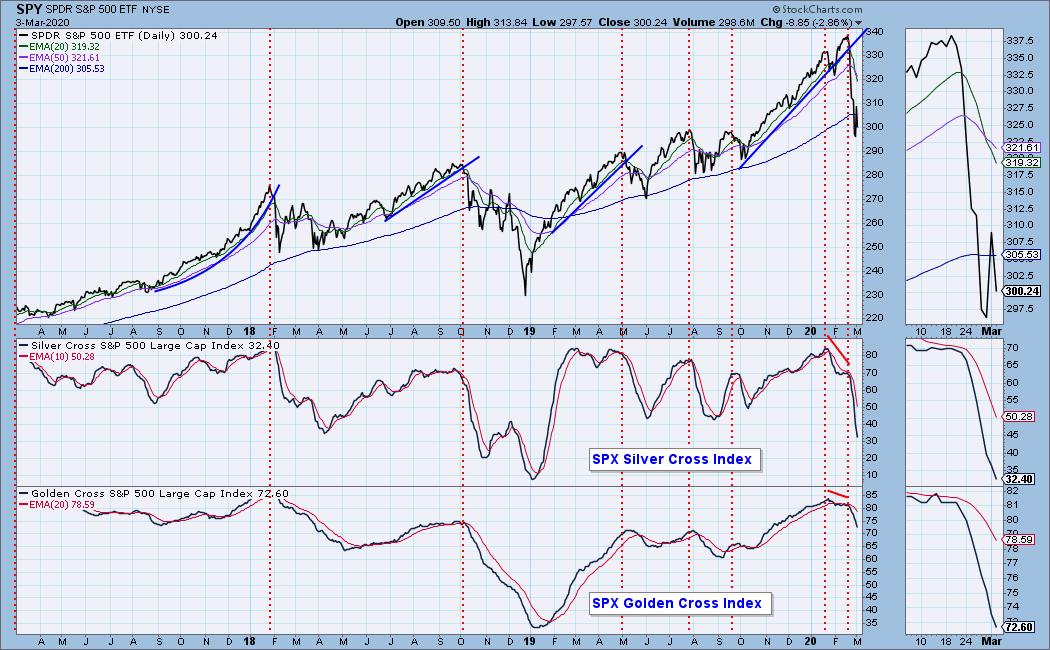
Market Environment: It is important to consider the odds for success. The Silver Cross Index measures the percentage of stocks on IT Trend Model BUY signals (20-EMA > 50-EMA), while the Golden Cross Index measures the percentage of stocks on LT Trend Model BUY signals (50-EMA > 200-EMA). Don't forget that as a "Diamonds" member, you have access to our GCI/SCI curated ChartList on DecisionPoint.com. You'll find it under "Members Only" links on the left side on the Blogs and Links Page. Here are the current percentages on the Silver and Golden Cross Indexes:
Diamond Index:
- Diamond Scan Results: 2
- Diamond Dog Scan Results: 2
- Diamond Bull/Bear Ratio: 1.00
For a more comprehensive review of current market conditions as well as analysis of Dollar, Gold, Oil and Bonds, subscribe to the DecisionPoint Alert! For a LIMITED TIME you can get a coupon code that will give you a discount for bundling your Diamonds subscription with the DecisionPoint Alert! Contact support@decisionpoint.com for more details.
Full Disclosure: I do not own any of the stocks above. I'm currently 60% in cash.

Erin Swenlin will be presenting at the The MoneyShow Las Vegas on May 11-13, 2020! You'll have an opportunity to meet Erin and discuss the latest DecisionPoint news and Diamond Scans. The conference is free to attend or view online!
Watch the latest episode of DecisionPoint with Carl & Erin Swenlin LIVE on Mondays 5:00p EST or on the StockCharts TV YouTube channel here!
Technical Analysis is a windsock, not a crystal ball.
Happy Charting!
- Erin
erinh@stockcharts.com
NOTE: The stocks reported herein are from mechanical trading model scans that are based upon moving average relationships, momentum and volume. DecisionPoint analysis is then applied to get five selections from the scans. The selections given should prompt readers to do a chart review using their own analysis process. This letter is not a call for a specific action to buy, sell or short any of the stocks provided. There are NO sure things or guaranteed returns on the daily selection of "diamonds in the rough."
Helpful DecisionPoint Links:
DecisionPoint Shared ChartList and DecisionPoint Chart Gallery
Price Momentum Oscillator (PMO)
Swenlin Trading Oscillators (STO-B and STO-V)
For more links, go to DecisionPoint.com!