
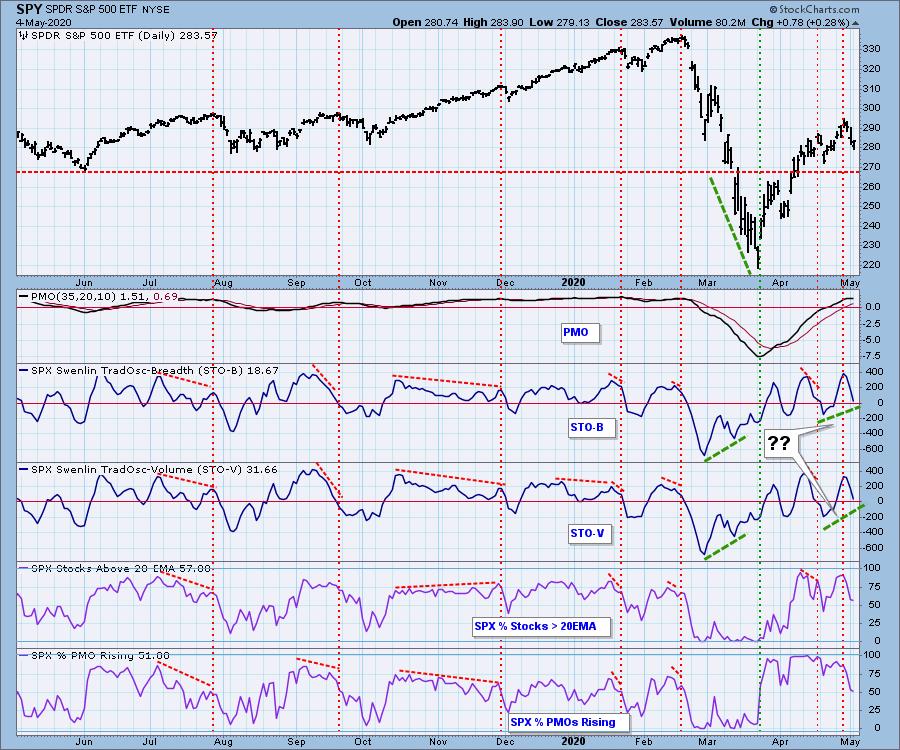
I decided it would be a good idea to open up today's Diamonds with the DP Short-Term Swenlin Trading Oscillator chart. It's bearish right now and suggests weak price movement or decline until it makes a turn. The question is whether they will set higher lows when they do turn back up. If so, we'd have a bullish bias with rising bottoms on them. You can see that previously, these rising bottoms could suggest protection from a deep drop or crash. For now, I remain cautious going forward with my investments. I'm not yet tightening stops, but I'm watching carefully.
Free Live Trading Room - Tuesdays/Thursdays
Do you miss MarketWatchers LIVE? You should definitely come visit the free trading room to get your fix. We give you a quick market update followed by your symbol requests and questions! I'm teaming up with Mary Ellen McGonagle (MEMInvestmentResearch.com) to do the regular "LIVE Trading Room" sessions for FREE at 11:00a EST - 12:15p EST Tuesdays/Thursdays.
** Here is the link to register for the live trading room.**
Apple Inc (AAPL) - Earnings: 7/28/2020 (AMC)
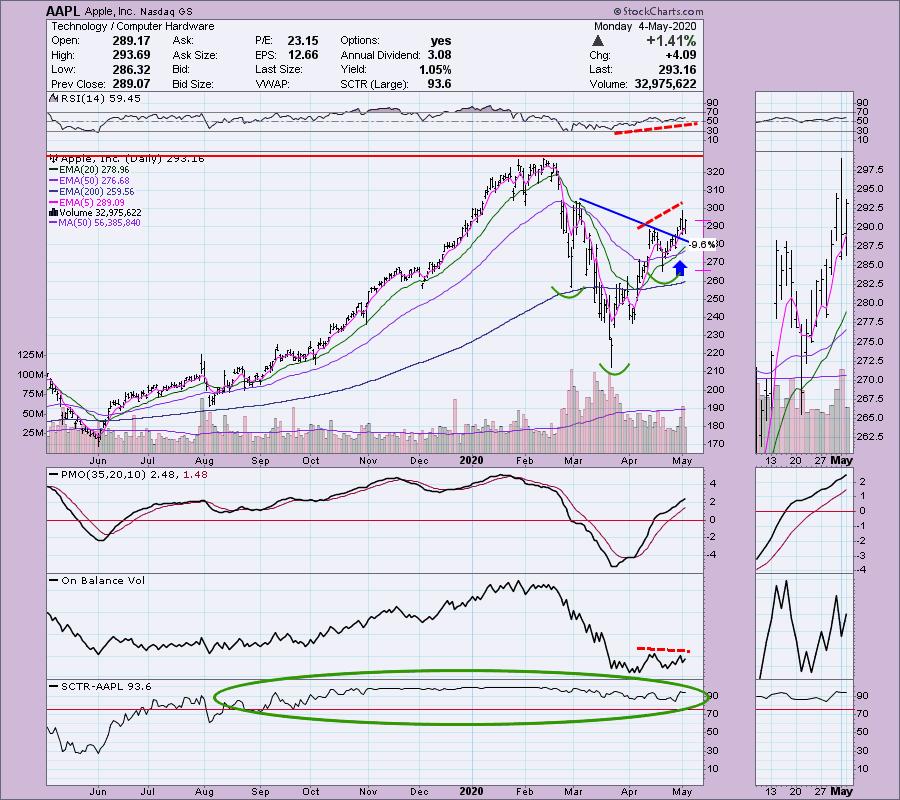
Yes! I think it is time to buy AAPL. It currently is down in after hours trading, so this one you should "stalk" by watching the 30 min and 5 min charts in the morning. You may be able to get it at a better discount. Price is not overbought based on the RSI. The PMO is also not overbought and is rising. I see a loose reverse head and shoulders pattern that is resolving as expected to the upside. The pattern measures $100 in length which suggests that the minimum upside target is well past the all-time high. The issue I have is the negative divergence with the OBV, but I'll forgive that given the bullish aspects to this chart.
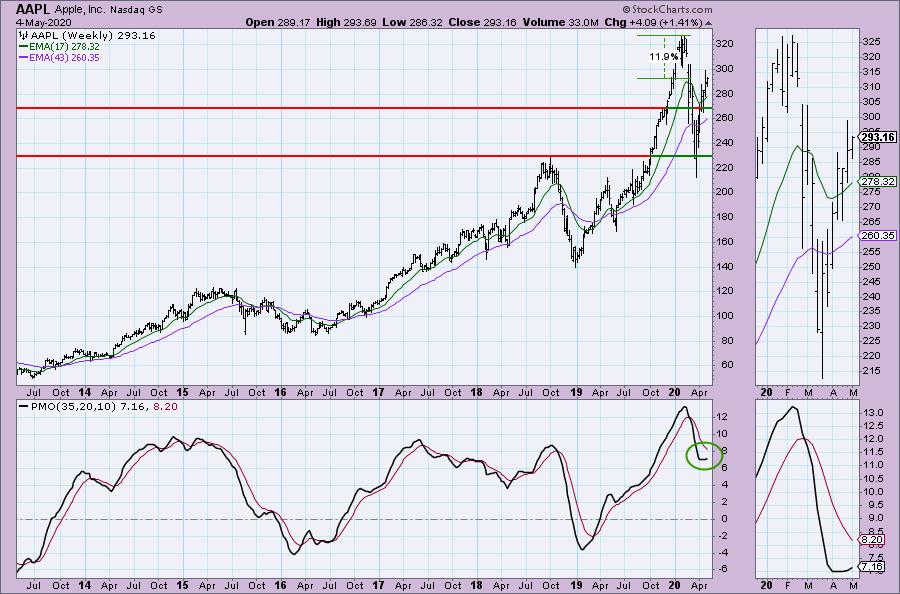
Granted upside potential to the all-time high isn't as appealing, but based on the reverse head and shoulders above, I suspect it has much greater potential. The weekly PMO is turning up.
Welcome to DecisionPoint Daily Diamonds, wherein I highlight five "diamonds in the rough." These are selected from the results of my DecisionPoint scans, which search for stocks that could benefit from the trend and condition of the market. Remember, these are not recommendations to buy or sell, but are the most interesting of the stocks that surfaced in my scans. My objective is to save you the work of the initial, tedious culling process, but you need to apply your own analysis to see if these stocks pique your interest as well. There are no guaranteed winners here!
Avalara Inc (AVLR) - Earnings: 5/7/2020 (AMC)
Avalara, Inc. engages in the provision of cloud-based solutions. It focuses on taxability, identifying applicable tax rates, determining and collecting taxes; preparing and filing returns; remitting taxes, maintaining tax records, and managing compliance documents. Its products include AvaTax excise, AvaTax communications, returns excise, trustfile, CertCapture, and avalara licensing.
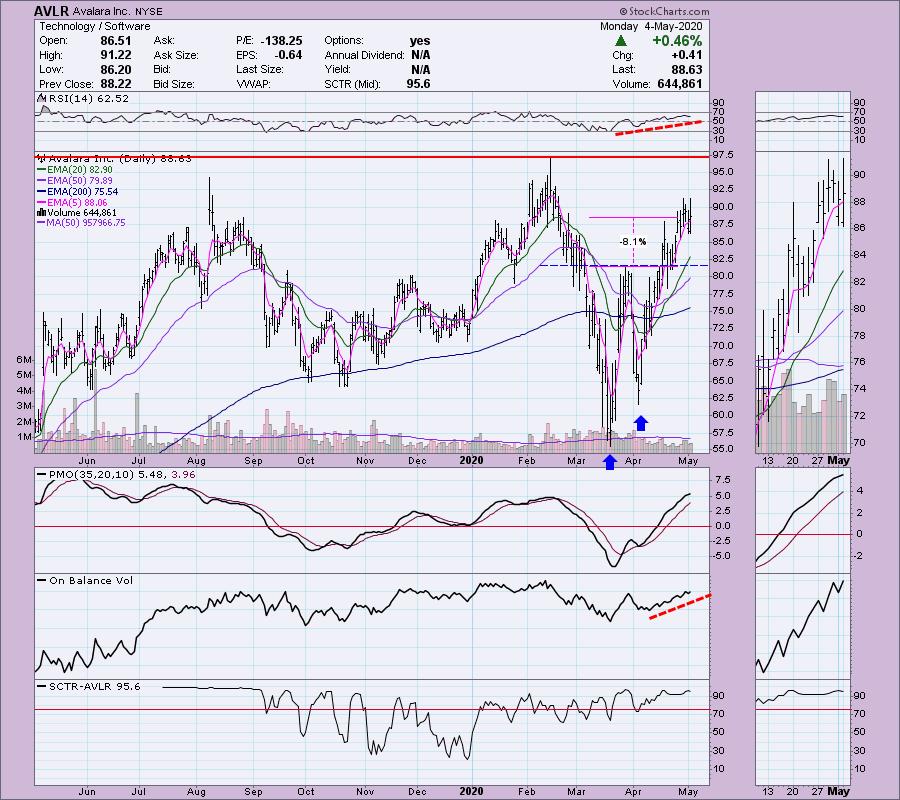
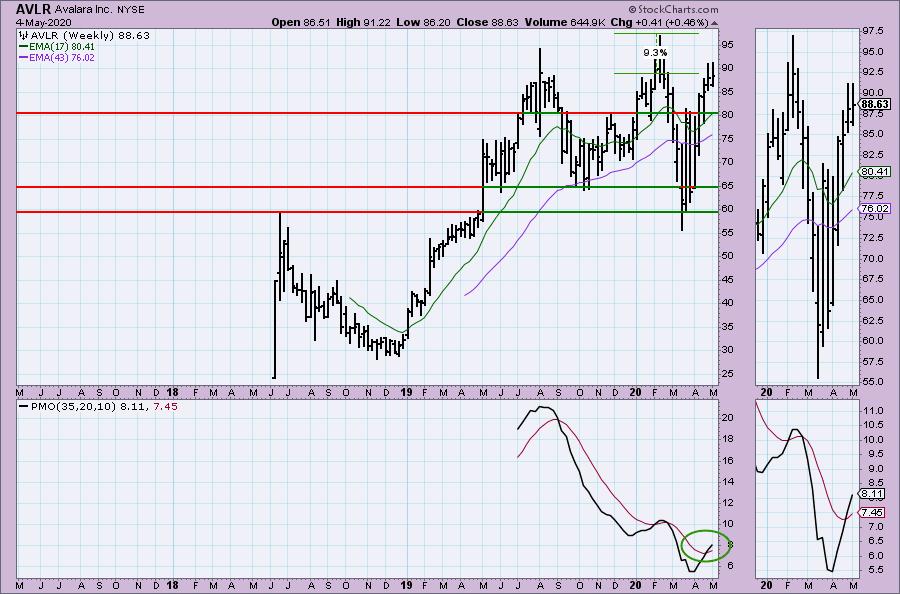
I like the double-bottom on this chart. If you do the pattern measurement, it has a length of around $20 give or take based on the second bottom. That would suggest a move to around $121. The stop is easy to set just below the middle of the "W" or confirmation line. The PMO is not overbought and neither is the RSI. The OBV is confirming and the SCTR is a healthy 95+.
Like Apple, upside potential to the all-time high isn't great, but given the execution of the double-bottom pattern on the daily chart and a new weekly PMO BUY signal, it looks pretty good.
Don't forget, on Thursdays I look at reader-requested symbols, so shoot me an email at erin@decisionpoint.com. I read every email I receive and try to answer them all!
Enphase Energy Inc (ENPH) - Earnings: 5/5/2020 (AMC)
Enphase Energy, Inc. engages in the design, development, manufacture, and sale of microinverter systems for the solar photovoltaic industry. Its products include IQ 7 Microinverter Series, IQ Battery, IQ Envoy, IQ Microinverter Accessories, IQ Envoy Accessories, and Enlighten & Apps.
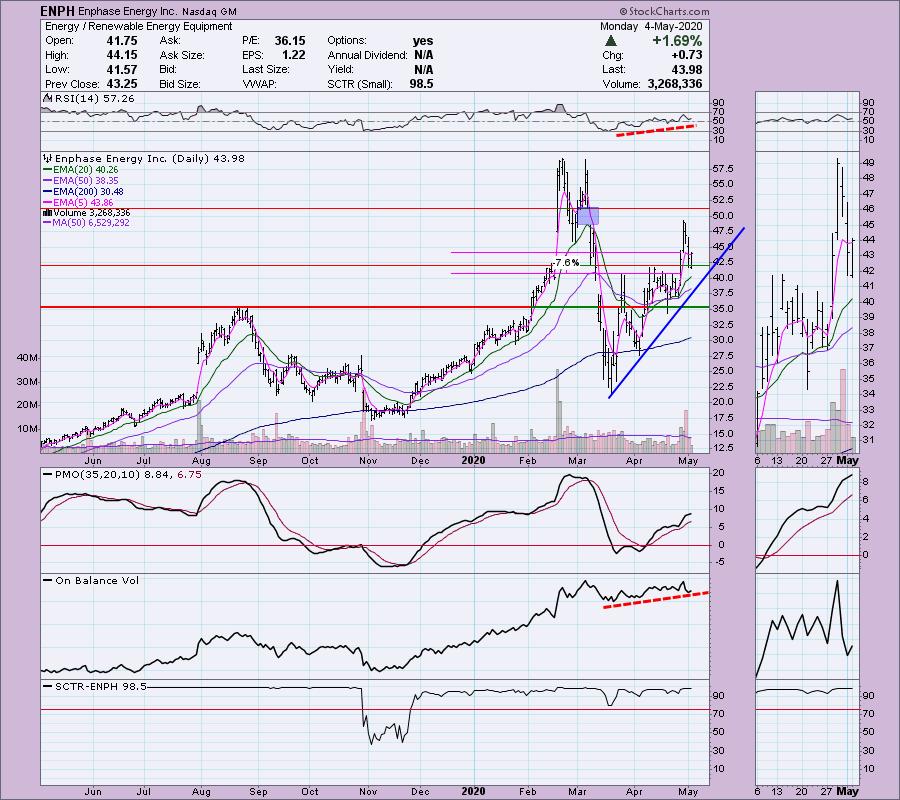
This one had a pullback at the end of last week that made this stock more attractive to me. The pullback settled price in above short-term support at the mid-April top. It is rising again. The PMO and RSI are not overbought and the OBV is confirming the short-term rally. I've set the stop area around 7.5% to match the March top, but I would simply watch that rising bottoms trendline. Should it break, I'd be out or uninterested if I hadn't bought it.
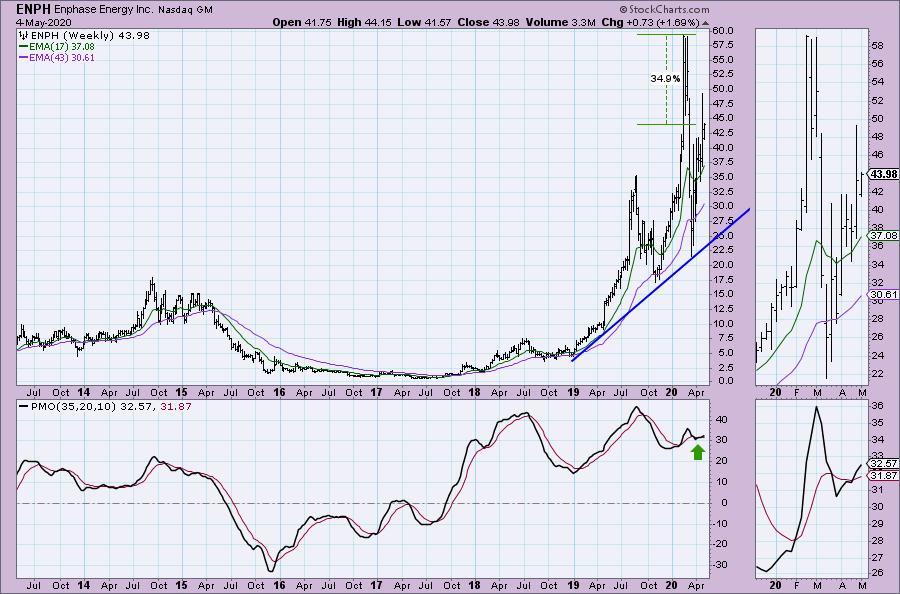
Upside potential on the weekly chart is mouth-watering. The weekly PMO has had a positive crossover and we have a rising trend, not a parabolic move.
MercadoLibre Inc (MELI) - Earnings: 5/5/2020 (AMC)
MercadoLibre, Inc. engages in the provision of online commerce platform with focus on e-commerce and its related services. It operates through the following geographical segments: Brazil, Argentina, Mexico, Venezuela, and Other Countries. The firm provides users a mechanism for buying, selling and paying as well as collecting, generating leads, and comparing lists through e-commerce transactions.
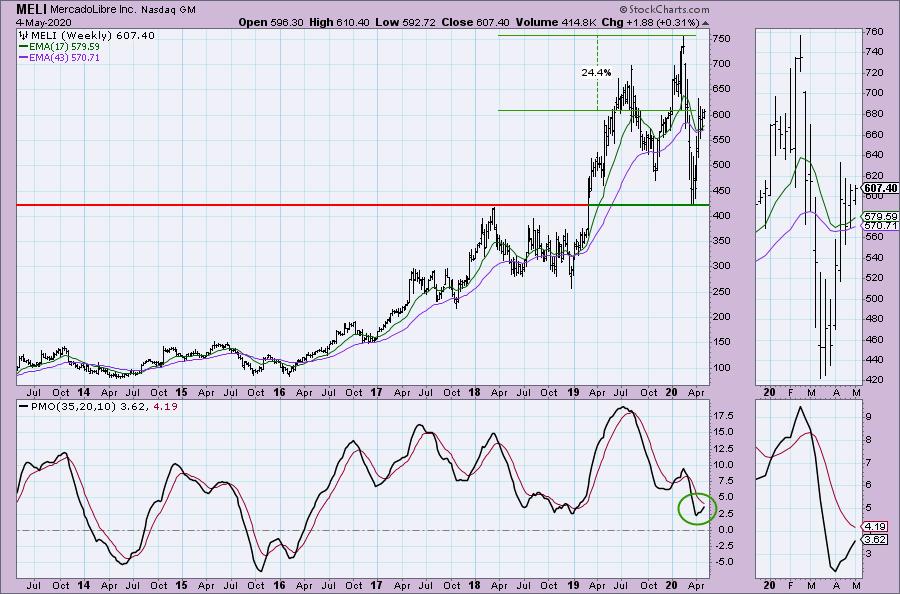
This one may be ready to switch directions. The PMO is trending higher even though price has mainly been consolidating. The OBV is very positive and the RSI is above net neutral (50). I see a possible bull flag. The length of the flagpole is about $220. If price breaks out of the flag, a potential minimum upside target would be around $800+.
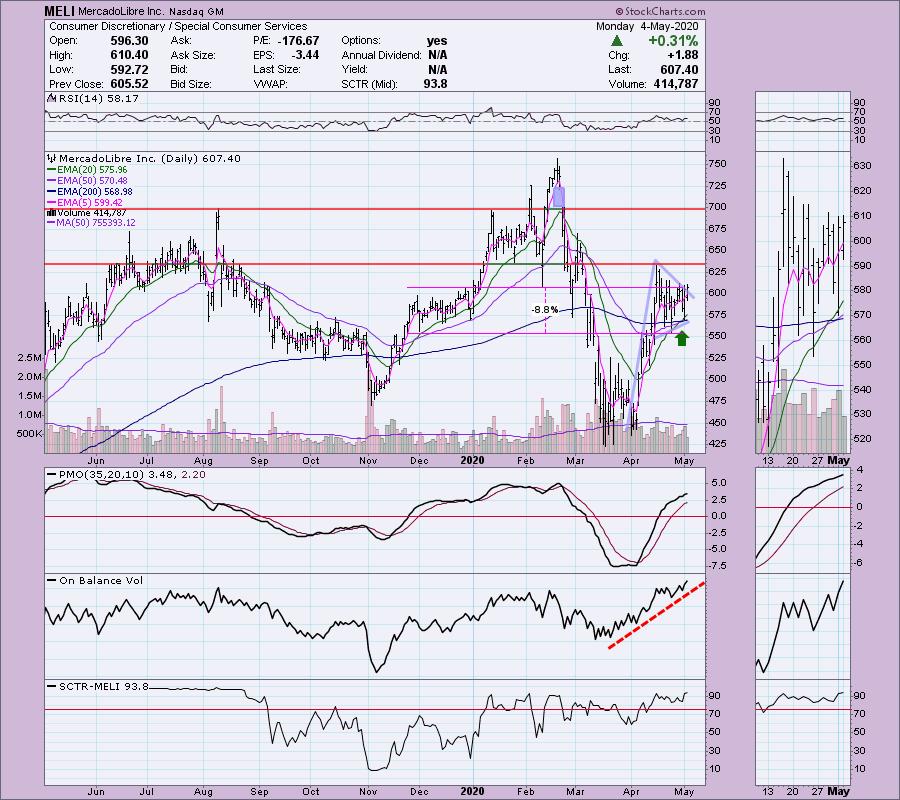
The weekly PMO is rising nicely toward a BUY signal. Upside potential to the all-time high is 24%.
SSR Mining Inc (SSRM) - Earnings: 5/14/2020 (AMC)
SSR Mining, Inc. engages in the operation, development, exploration, and acquisition of precious metal projects. It focuses on the Puna, Marigold Mines, and Seabee Gold Operations. The company was founded on December 11, 1946 is headquartered in Vancouver, Canada.
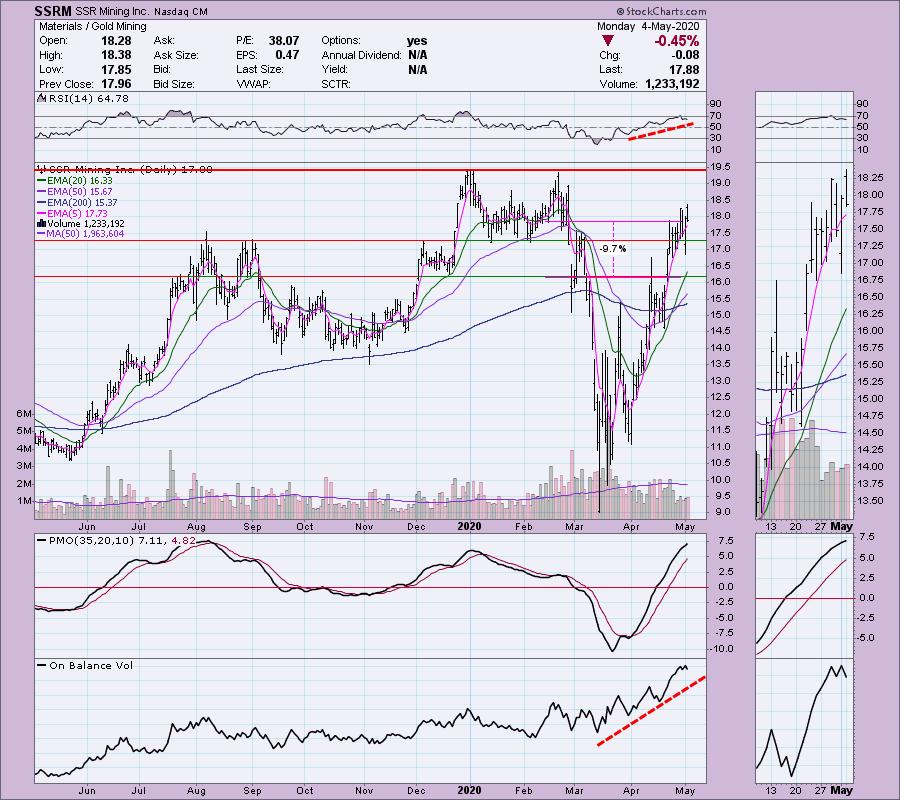
Gold miners have been performing quite well and this one is no exception. The RSI moved out of overbought territory and is settling in above net neutral. The OBV is positive and moving higher. If I had a complaint it would be the overbought PMO, although we see that the recent PMO low was -10 and that suggests the upper range could move to +10.
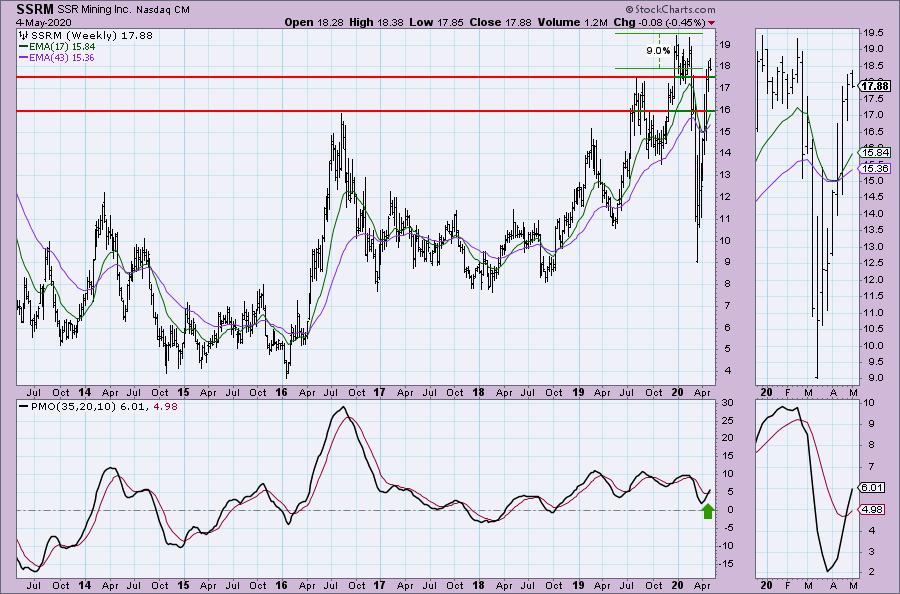
Upside potential to the all-time high is around 9%, but given the new PMO BUY signal, I suspect it will go higher.
Current Market Outlook:
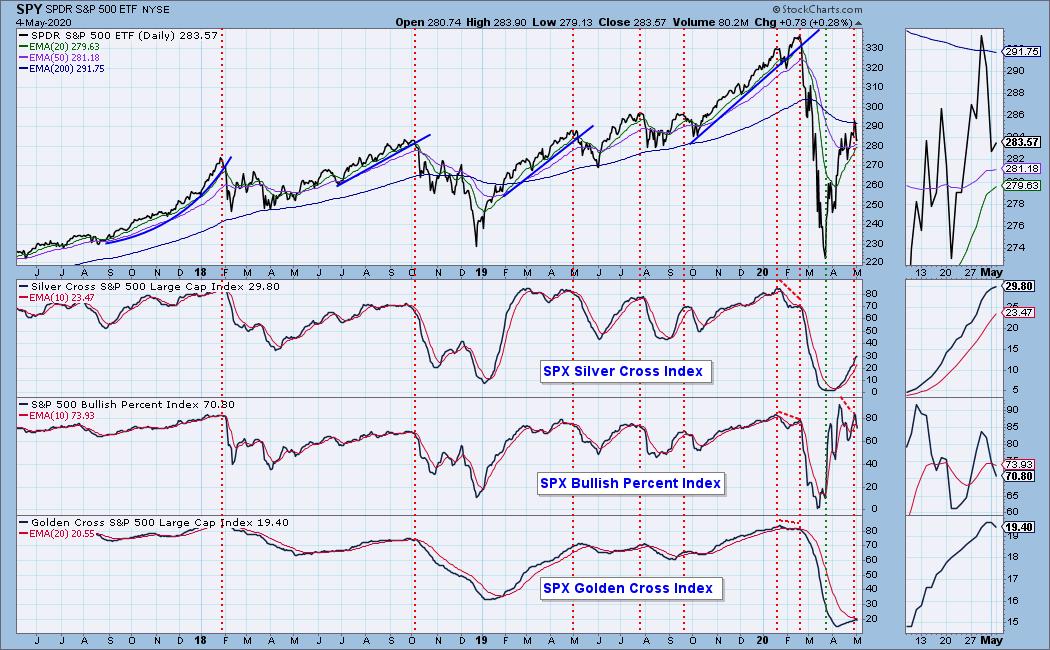
Market Environment: It is important to consider the odds for success. The Silver Cross Index measures the percentage of stocks on IT Trend Model BUY signals (20-EMA > 50-EMA), while the Golden Cross Index measures the percentage of stocks on LT Trend Model BUY signals (50-EMA > 200-EMA). Don't forget that as a "Diamonds" member, you have access to our GCI/SCI curated ChartList on DecisionPoint.com. You'll find it under "Members Only" links on the left side on the Blogs and Links Page. Here are the current percentages on the Silver and Golden Cross Indexes:
Diamond Index:
- Diamond Scan Results: 0
- Diamond Dog Scan Results: 305
- Diamond Bull/Bear Ratio: 0.00
For a more comprehensive review of current market conditions as well as analysis of Dollar, Gold, Oil and Bonds, subscribe to the DecisionPoint Alert! For a LIMITED TIME you can get a coupon code that will give you a discount for bundling your Diamonds subscription with the DecisionPoint Alert! Contact support@decisionpoint.com for more details.
Full Disclosure: I don't own any of the stocks above. I'm currently 20% in cash. My trading timeframe has moved from intermediate-term to short-term and therefore I'm investing more.

Erin Swenlin will be presenting at the The MoneyShow Las Vegas August 16 - 20 at Bally's/Paris Resort! You'll have an opportunity to meet Erin and discuss the latest DecisionPoint news and Diamond Scans. Claim your FREE pass here! You can watch online with this pass too!! There will be online events held in May and when I have more information I'll let you know.
Watch the latest episode of DecisionPoint with Carl & Erin Swenlin on Thursdays 8:00a EST or on the DecisionPoint playlist on the StockCharts TV YouTube channel here!
Technical Analysis is a windsock, not a crystal ball.
Happy Charting!
- Erin
erinh@stockcharts.com
NOTE: The stocks reported herein are from mechanical trading model scans that are based upon moving average relationships, momentum and volume. DecisionPoint analysis is then applied to get five selections from the scans. The selections given should prompt readers to do a chart review using their own analysis process. This letter is not a call for a specific action to buy, sell or short any of the stocks provided. There are NO sure things or guaranteed returns on the daily selection of "diamonds in the rough."
Helpful DecisionPoint Links:
DecisionPoint Shared ChartList and DecisionPoint Chart Gallery
Price Momentum Oscillator (PMO)
Swenlin Trading Oscillators (STO-B and STO-V)
For more links, go to DecisionPoint.com!