
There were some interesting reader requests as usual, but I found an excellent opportunity to show you the difference between two OBV configurations so you can better understand divergences which I know can be confusing. I've been rooting around to find some interesting commodities ETFs and one was brought to my attention by a new reader. I opted to do six today instead of five.
I had a subscriber ask me if I could just post the stocks that I am actually going to invest in. Honestly, that would limit the selections to only a handful and I think it is more important to give you a variety of choices. Know this: 95% of my investments come from Diamonds. I trust my analysis process and that process will provide me with many choices--all of which are good, but I have to make a selection as some point. Some of the Diamonds I have presented but haven't bought, have done better than some of the ones I actually pick to invest in. My hope with Diamonds is not to present 'sure things', my job is to help you uncover your own investments and analysis process by watching me use mine. I hope you enjoy!
** PRICES ARE GOING UP! **
You do NOT need to concern yourself if you're happy with what you have. Your current rate will stay the same as long as your subscription remains in good standing. You can also switch to an annual subscription at anytime where you pay for 10 months and get 12 months.
For our DP Diamond-only subscribers: You should consider our Bundle package. DP Alert Reports will be going up 33% to $40/mo so adding DP Alert later will be more expensive. Bundles currently are $50/mo or $500/yr.
If you add DP Alert after August 16th, it will cost you an additional $40/mo or $400/yr for a Bundle total of $65/mo or $650/yr after August 16th!
To summarize, if you don't have the Bundle, subscribe now before it becomes very expensive!
For my Diamonds subscribers, there will be a new 1-hour trading room, "The DecisionPoint Diamond Mine" on Fridays! It will be an opportunity for us to talk live, review current and past Diamonds for possible entries/exits/stops/targets and take your questions and symbol requests in this intimate trading room. But wait, there's more for Diamonds subscribers! I will be adding a Friday Diamonds Recap where I will look at the performance of that week's Diamonds and their prospects moving forward. Over the weekend we clean the slate and start over again.
There will also be a once a week free trading room, the "DecisionPoint Trading Room" for 1 hour on Tuesdays (we will keep our "diamonds" to ourselves though). I hope you enjoy the new changes that will be underway soon! **
Welcome to DecisionPoint Daily Diamonds, wherein I highlight five "diamonds in the rough." These are selected from the results of my DecisionPoint scans, which search for stocks that could benefit from the trend and condition of the market. Remember, these are not recommendations to buy or sell, but are the most interesting of the stocks that surfaced in my scans. My objective is to save you the work of the initial, tedious culling process, but you need to apply your own analysis to see if these stocks pique your interest as well. There are no guaranteed winners here!
Invesco DB Agriculture Fund (DBA) - Earnings: N/A
DBA tracks an index of 10 agricultural commodity futures contracts. It selects contracts based on the shape of the futures curve to minimize contango.
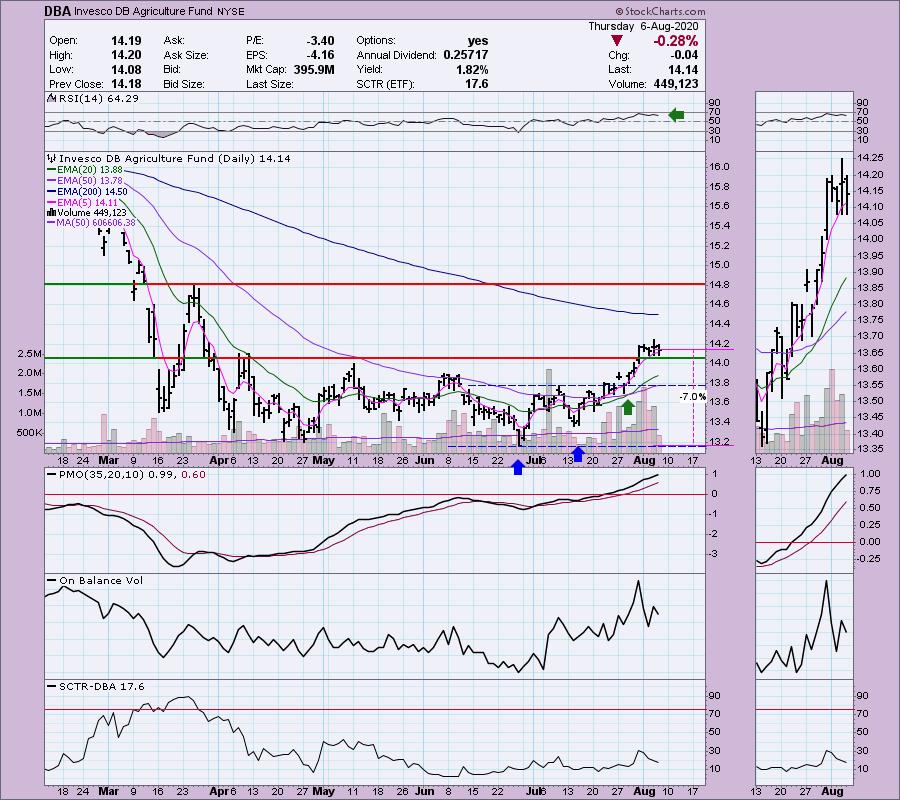
I had been on the hunt for a good looking commodities stock or ETF and a reader emailed this one to me not as a reader request, but to ask when/where I'd presented it before. I did present it before on 2/19...not good timing, but the stop I listed would've had you out after only about a 5.5% loss. NOW, I think has potential. With the Dollar failing, Gold and commodities will benefit. You can see that it has been since mid-July. The RSI and PMO are positive. The breakout occurred and since then it has been pausing, consolidating the move. The 20/50-EMAs had a "silver cross" to trigger an IT Trend Model BUY signal back at the end of July. You don't have to set a very deep stop here either.
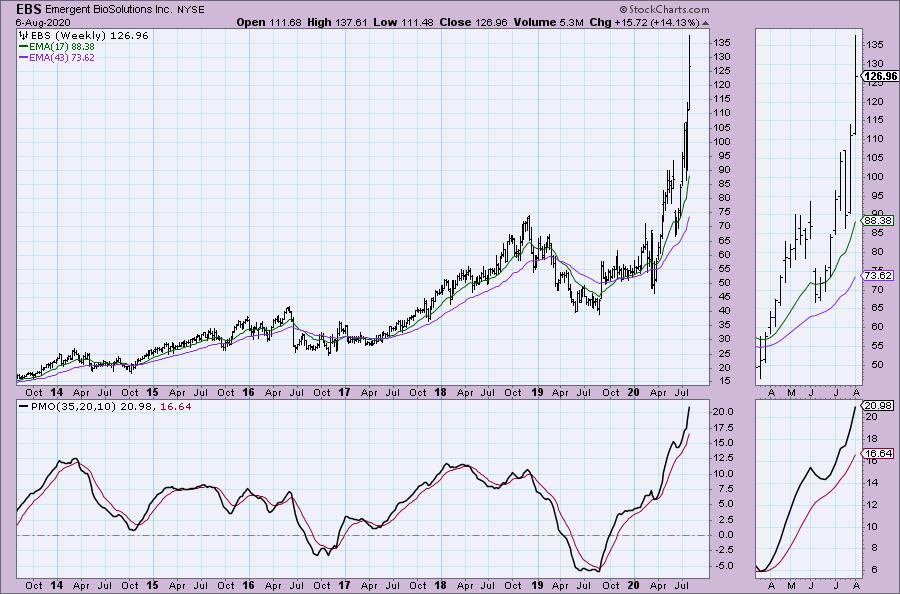
The weekly chart looks great in my opinion. The PMO just triggered a BUY signal in oversold territory and a double-bottom has formed. Last week that pattern was triggered on the breakout above the confirmation line (the middle of the "W"). The minimum upside target of that pattern is to about $15, but I would look for a move to at least $16.50.
Emergent BioSolutions Inc (EBS) - Earnings: 11/4/2020 (AMC)
Emergent BioSolutions Inc. engages in the development, manufacture, and commercialization of medical countermeasures. It offers specialty products for civilian and military populations that address accidental, intentional and naturally occurring public health threats. The firm's products include ACAM2000, BioThrax, Raxibacuma, Vaxchora, and VIGIV. Its business units include Vaccines and Anti-Infectives; Antibody Therapeutics; Devices; and Contract Development and Manufacturing.
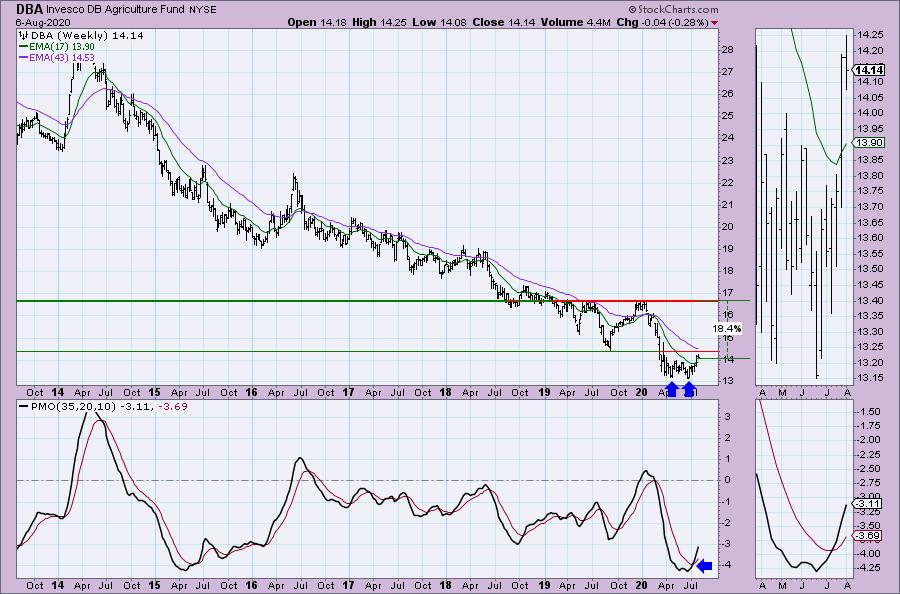
Now to begin the "Tale of Two OBVs". This stock looks pretty good and the other that George sent has a very similar chart. The big difference between the two is the OBV. This chart is positive, the RSI is getting less overbought, the PMO is rising and it has a great SCTR. Here's the problem: We have a negative divergence on the OBV. Price isn't being support by volume. Prices are going higher, but there's no volume coming in to overcome the big volume down day.
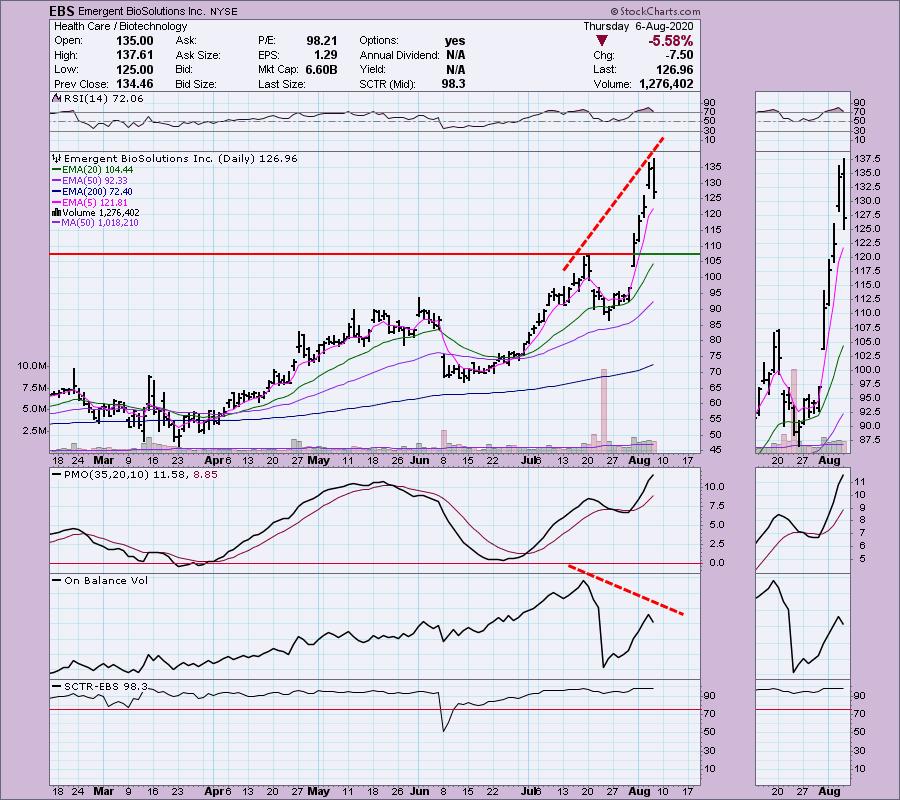
Weekly chart looks good, although the PMO is very overbought and that parabolic move to the upside is a bit concerning.
Don't forget, on Thursdays I look at reader-requested symbols, so shoot me an email at erin@decisionpoint.com. I read every email I receive and try to answer them all!
Generac Holdings Inc (GNRC) - Earnings: 10/29/2020 (BMO)
Generac Holdings, Inc. engages in the design and manufacture of power generation equipment and other power products. It operates through the following segments: Domestic and International. The Domestic segment includes the legacy Generac, and the impact of acquisitions that are based in the United States. The International segment comprises of ottomotors, tower light, pramac, motortech, and selmec businesses.
Here is the second OBV. Notice the chart is very similar to the one above. The RSI is overbought and the PMO is rising nicely. The SCTR is actually smaller than EBS. Notice the difference in the volume pattern. Volume is flying upward with price. The wind is at its back because volume is confirming price.
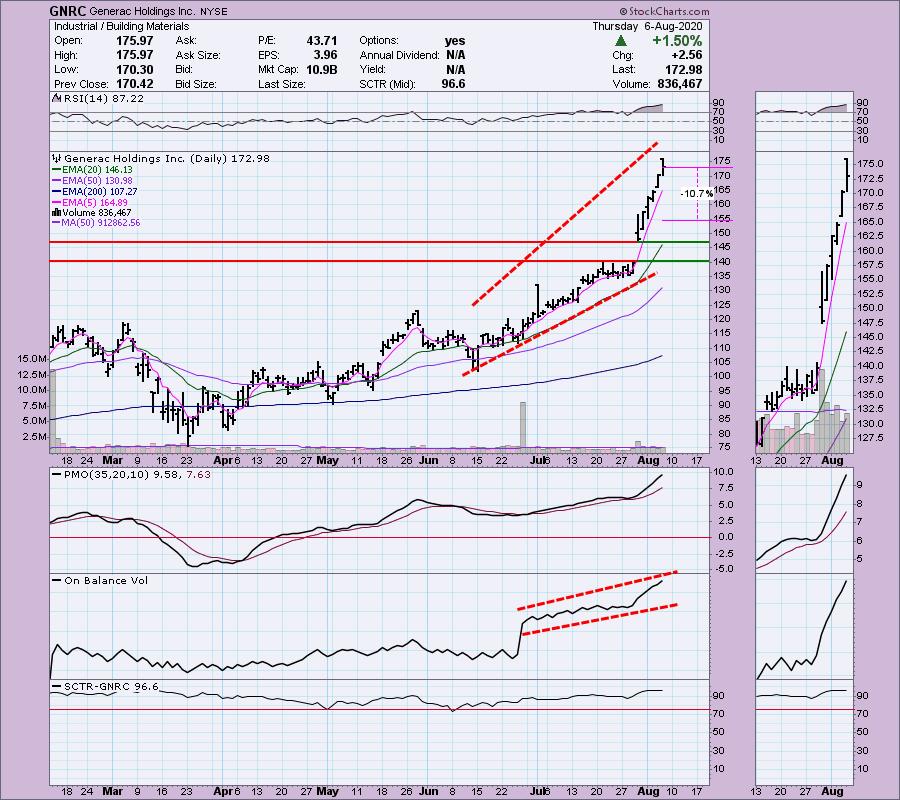
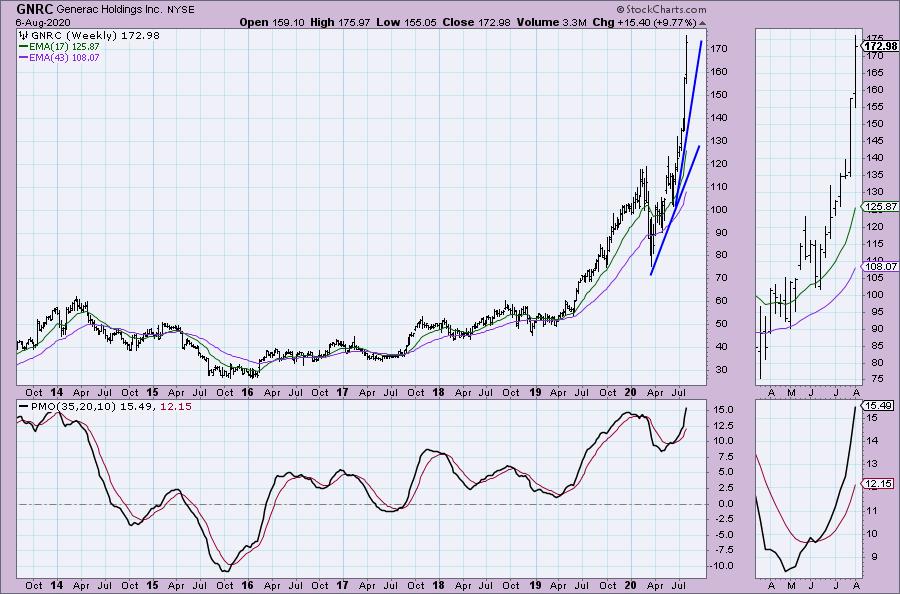
The PMO is very positive and though overbought, it isn't nearly as overbought as EBS's. I think both stocks will keep on running, but I like the underlying technicals on GNRC better.
3M Co (MMM) - Earnings: 10/27/2020
3M Co. is a technology company, which manufactures industrial, safety and consumer products. It operates through the following segments: Safety and Industrial, Transportation and Electronics, Health Care, and Consumer. The Safety and Industrial segment consists of personal safety, industrial adhesives and tapes, abrasives, closure and masking systems, electrical markets, automotive aftermarket, and roofing granules. The Transportation and Electronics segment consists of electronics, automotive and aerospace, commercial solutions, advanced materials, and transportation safety. The Health Care segment includes medical and surgical supplies, skin health and infection prevention products, oral care solutions, separation and purification sciences, health information systems, inhalation and transdermal drug delivery systems, and food safety products. The Electronics & Energy segment involves in the optical films solutions for electronic displays, packaging and interconnection devices; insulating and splicing solutions; touch screens and touch monitors; renewable energy component solutions; and infrastructure protection products. The Consumer segment products includes office supply products, stationery products, home improvement products, home care products, protective material products, certain consumer retail personal safety products, and consumer health care products.
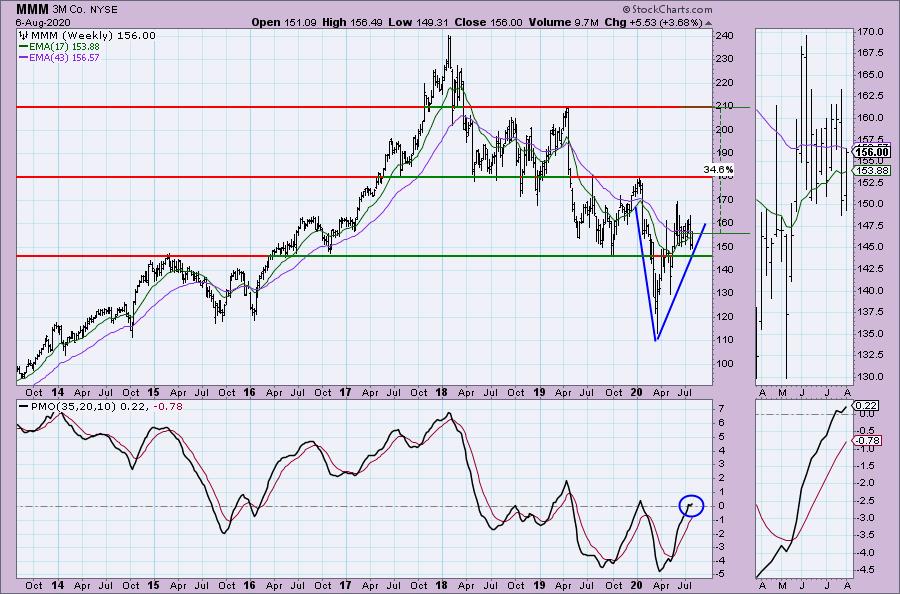
A new subscriber gave me this request. I have to say I really like the Industrials right now. It's a somewhat beaten down sector and I believe there are some interesting picks here. My "Diamond of the Week" for the DecisionPoint Show this morning was TDY which I presented on Tuesday to you. 3M looks very interesting. Most of the "ingredients" are there as far as indicators: RSI is positive, PMO has turned up and a beautiful OBV positive divergences. The main issue I'd watch for is that this trading channel could continue on so our upside potential while good, could be stymied by overhead resistance. A big positive is that we can set a stop that isn't too deep. And...
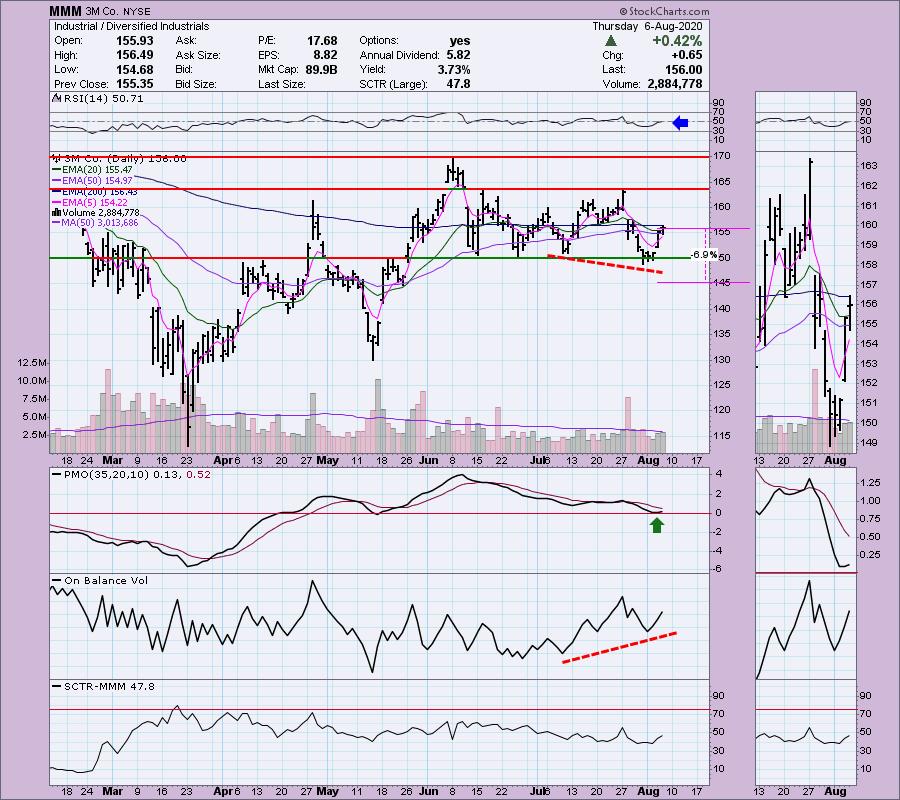
...a stop level at $145 has great support at the 2015 high, the lows in 2016 and the 2019 low. The PMO has turned back up. "V" bottom patterns are considered bullish as well.
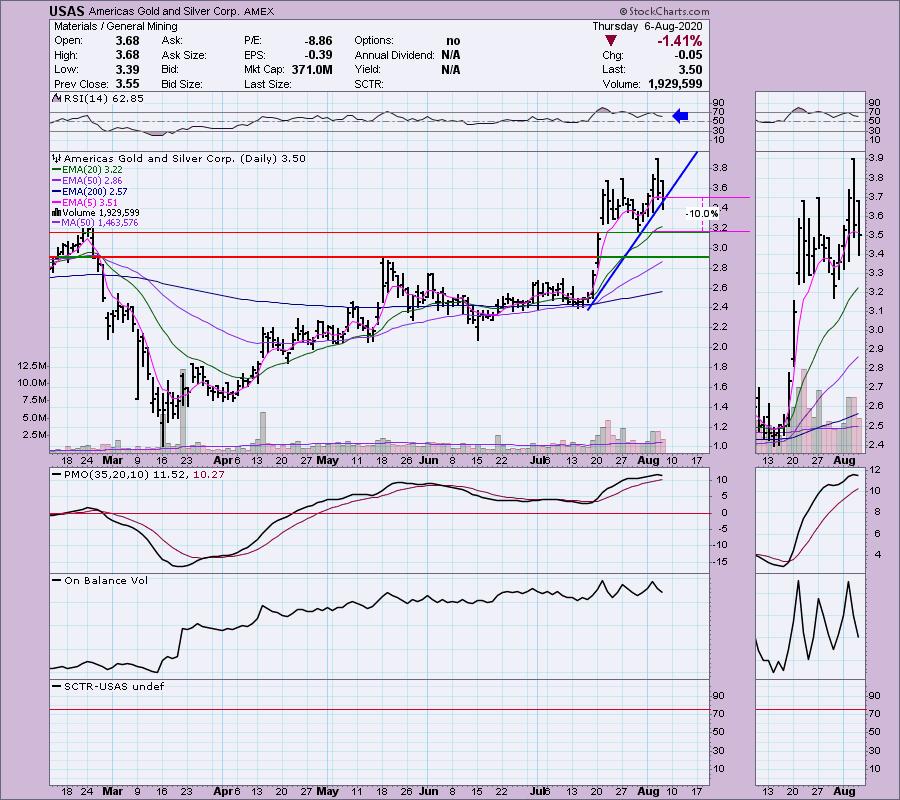
Americas Gold and Silver Corp (USAS) - Earnings: 8/10/2020 (AMC)
Americas Gold and Silver Corporation, formerly Americas Silver Corporation, is engaged in producing silver with assets in Americas and has an operating platform. The Company is engaged in the acquisition, exploration, development and exploration of mineral resource properties in Mexico and the United States.
I would like to get back into a Miner and my preference would be one that includes silver mining given the explosive moves by silver this week. I like this one, but that low price point should be understood and a position size should be mindful of that. We could be looking at a flag formation here. Price is currently holding the rising bottoms trendline and the RSI is positive, along with the EMAs. The PMO is trying to top, but that's the case on most Miners right now as some of them are pulling back. Overall though, the Miners still have potential, a lot of it. I'm biding my time to get back into one.
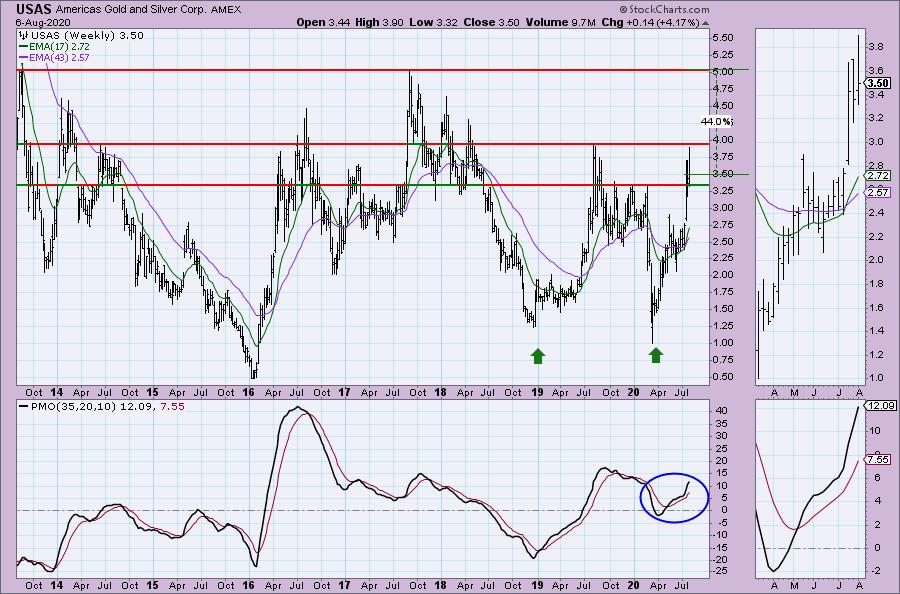
The weekly chart looks great with a strongly rising PMO that is in positive territory and not really overbought. You could also make a case for a big double-bottom. Of concern for me is that $4.00 overhead resistance. However, if it can move above, that would execute that very big double-bottom and lead me to believe a price of $5.00 is perfectly reasonable.
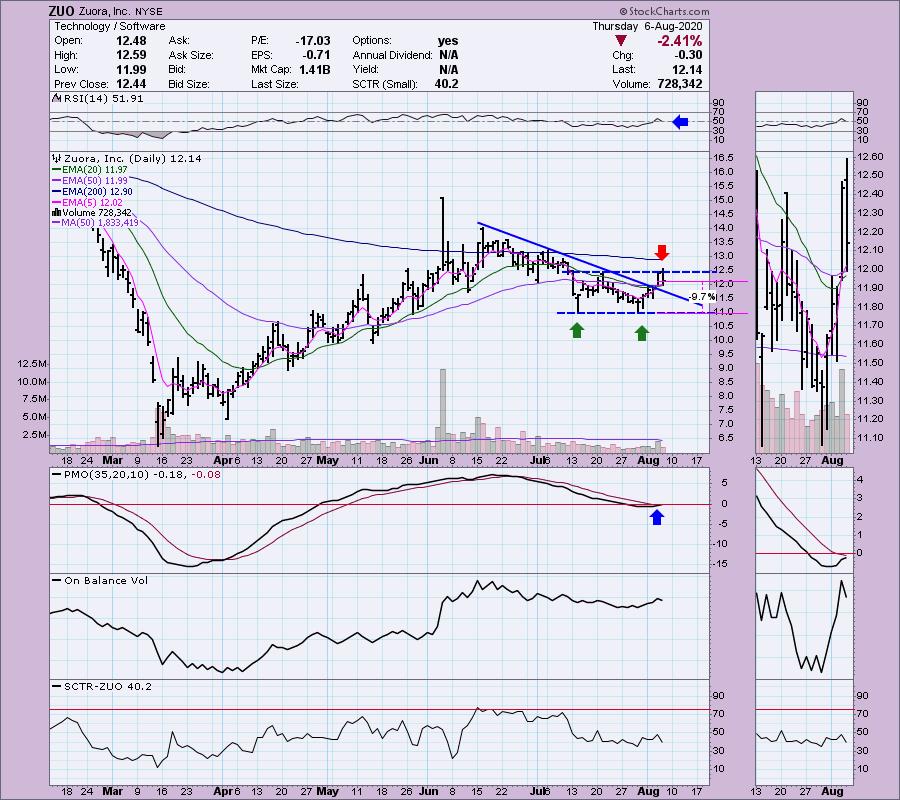
Zuora Inc (ZUO) - Earnings: 8/26/2020 (AMC)
Zuora, Inc. operates as an online subscription billing and management platform. The firm's products include Zuora Billing, Zuora RevPro, Zuora CPQ and Zuora Collect. Its Central Platform is composed of six core engines: Pricing Engine, Subscription Orders Engine, Rating Engine, Global Payments Engine, Subscription Metrics and Subscription Accounting Engine. It also offers traditional ERP software, such as Oracle Corporation and SAP AG.
This one hit my scan results on Monday but I opted to not pick it so I found it interesting that my reader brought it to my attention shortly thereafter. It pulled back today in a big way, but the PMO is still rising and the RSI is positive. I like the recent breakout from the declining trend. We could be looking at another double-bottom as well. The OBV isn't telling us much and the SCTR is telling us that there is certainly room for improvement. The concern right now is that price didn't manage to pass up that July top.
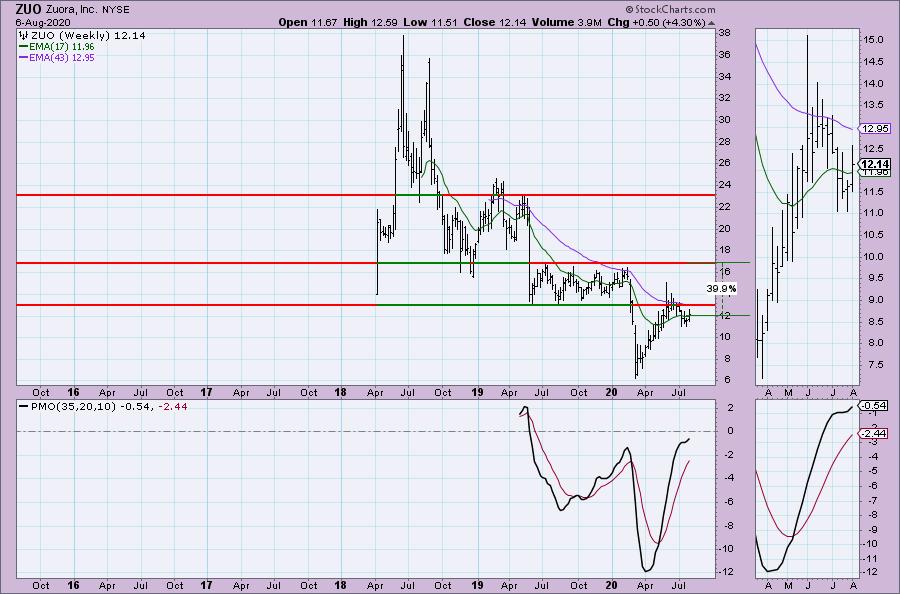
We can see that the $13 level holds some serious overhead resistance. That also happens to be the location of the 200-EMA on the daily chart. I still like this one as we could be looking at a flag formation that is readying to execute (best seen in the thumbnail) and a PMO that is accelerating upward.
Current Market Outlook:
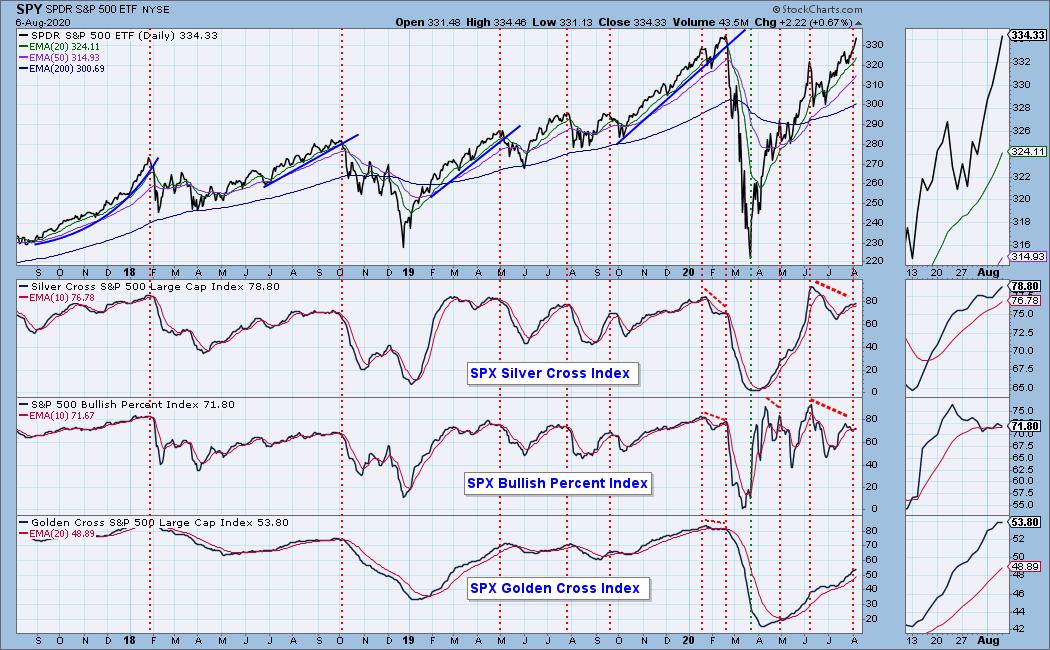
Market Environment: It is important to consider the odds for success by assessing the market tides. The following chart uses different methodologies for objectively showing the depth and trend of participation for intermediate- and long-term time frames.
- The Silver Cross Index (SCI) shows the percentage of SPX stocks on IT Trend Model BUY signals (20-EMA > 50-EMA)
- The Golden Cross Index (GCI) shows the percentage of SPX stocks on LT Trend Model BUY signals (50-EMA > 200-EMA)
- The Bullish Percent Index (BPI) shows the percentage of SPX stocks on Point & Figure BUY signals.
Don't forget that as a "Diamonds" member, you have access to our GCI/SCI curated ChartList on DecisionPoint.com. You'll find it under "Members Only" links on the left side on the Blogs and Links Page.
Here is the current chart:
Diamond Index:
- Diamond Scan Results: 37
- Diamond Dog Scan Results: 11
- Diamond Bull/Bear Ratio: 3.36
Full Disclosure: I'm about 65% invested right now and 25% is in 'cash', meaning in money markets and readily available to trade with. Had another stop trigger...I'm looking for a Miner (WPM is high on my list) and thinking about DBA or another commodity ETF.
Technical Analysis is a windsock, not a crystal ball.
Happy Charting!
- Erin
erin@decisionpoint.com
ANNOUNCEMENT:
I have the information for my VIRTUALpresentation at The Money Show! My presentation will on August 19th at 1:20p EST! Click here for information on how to register to see me!

Watch the latest episode of DecisionPoint with Carl & Erin Swenlin on Thursdays 8:00a EST or on the DecisionPoint playlist on the StockCharts TV YouTube channel here!
NOTE: The stocks reported herein are from mechanical trading model scans that are based upon moving average relationships, momentum and volume. DecisionPoint analysis is then applied to get five selections from the scans. The selections given should prompt readers to do a chart review using their own analysis process. This letter is not a call for a specific action to buy, sell or short any of the stocks provided. There are NO sure things or guaranteed returns on the daily selection of "diamonds in the rough."
Helpful DecisionPoint Links:
DecisionPoint Shared ChartList and DecisionPoint Chart Gallery
Price Momentum Oscillator (PMO)
Swenlin Trading Oscillators (STO-B and STO-V)
For more links, go to DecisionPoint.com!