
Carl pointed out a pattern that I honestly wasn't familiar with called a "pig's ear". They are what we like to call a "fake out, break out" or "bull trap". One of this week's Diamonds apparently showed this hand and resolved in "textbook" fashion. I'll explore this formation in more depth.
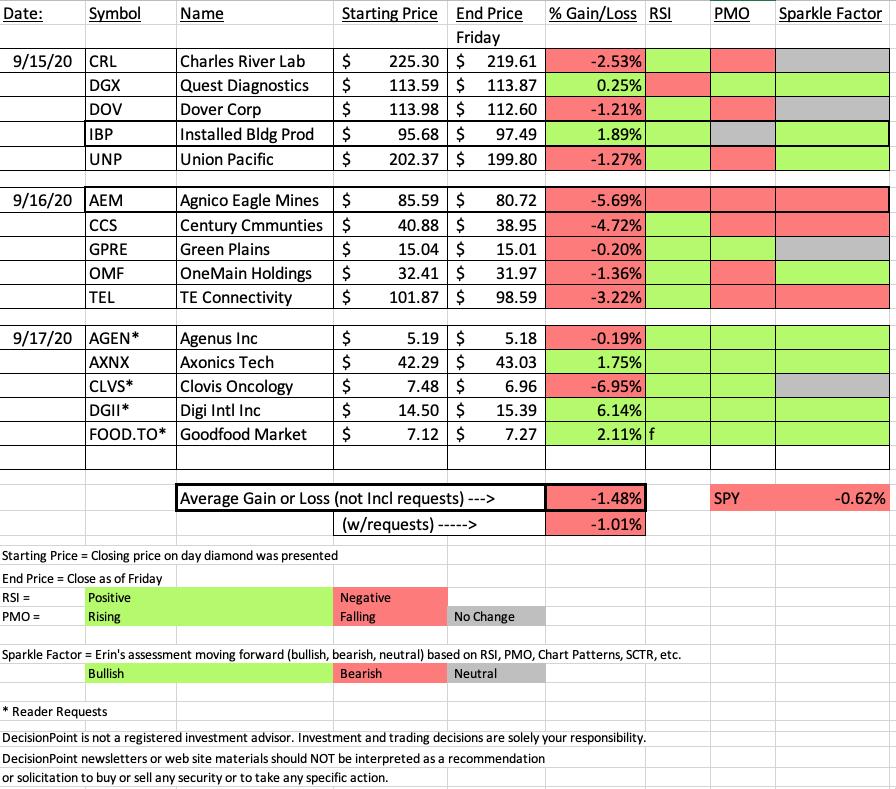
When the market has a rough week, unfortunately many Diamonds do as well. Overall it wasn't a terrible week, but we did come in underperforming the SPY by 0.86%. In all of these cases because of the market dip, better entries were available the next day, but I do not take that into account because it could also be a good week and you wouldn't be able to enter at the closing price from the day before.
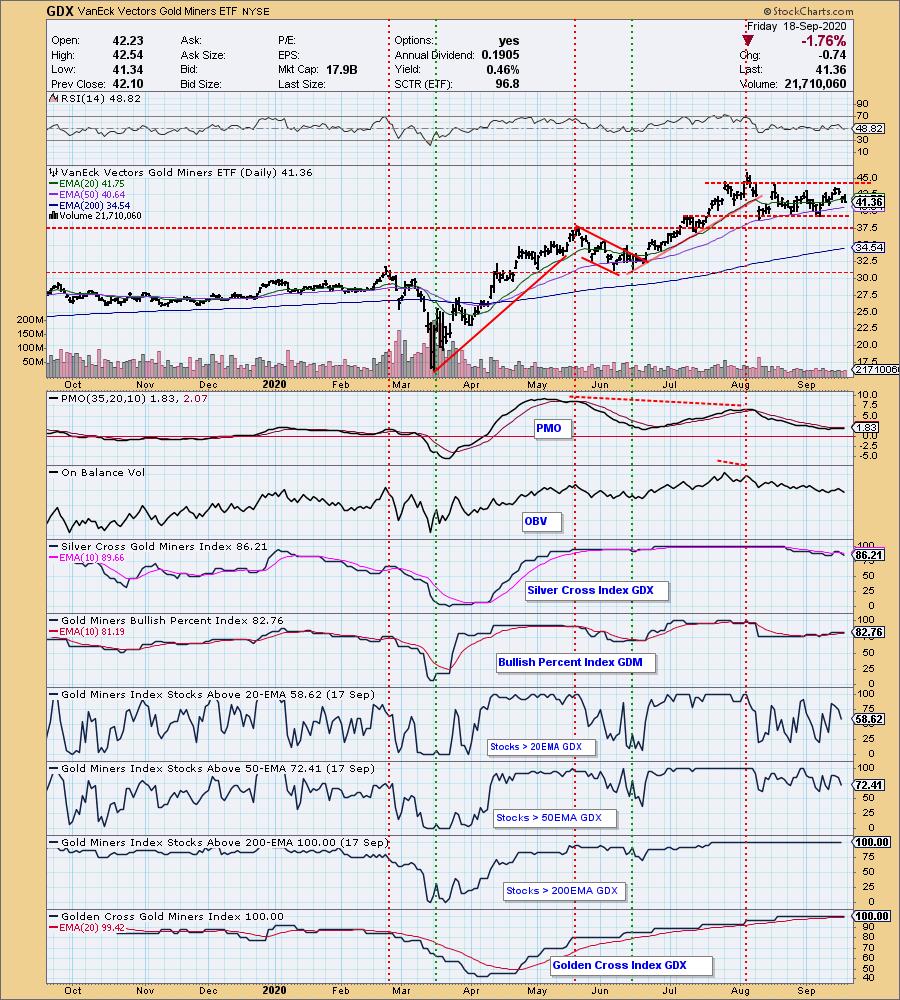
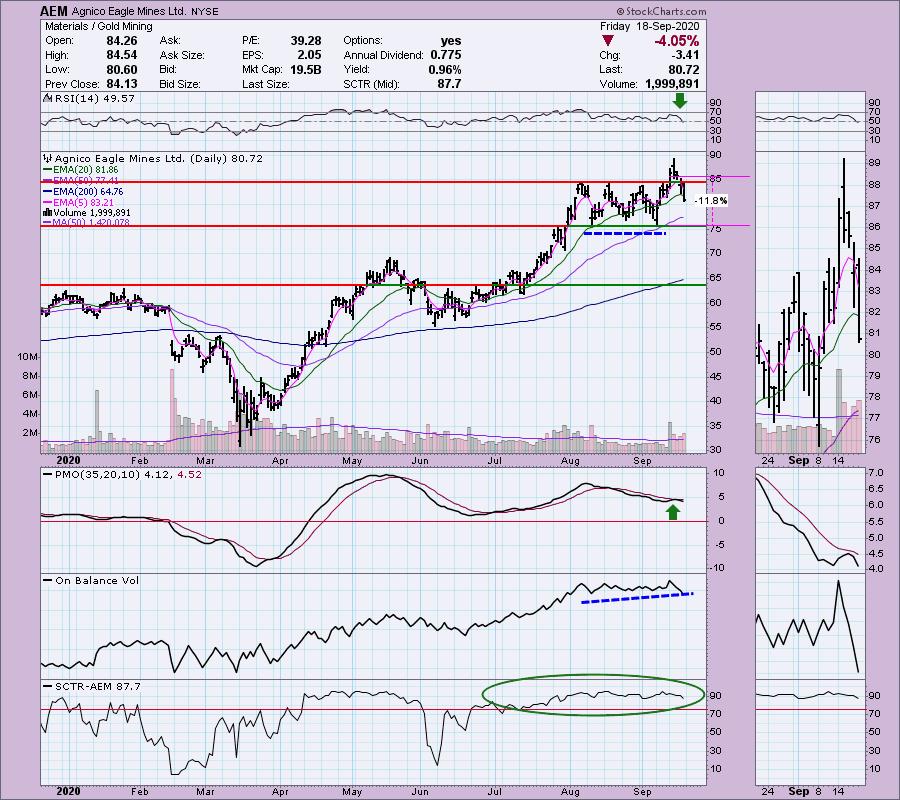
Looking at the spreadsheet, the biggest winner was IBP with a gain of +1.89%. It edged out yesterday's pick of AXNX. I still very much like AXNX, you can find the write up in yesterday's Diamonds Report. The biggest loser was AEM, the one Gold Miner I picked from the eight that came up in my scan. I definitely think that we got in a week too early on the Gold Miners. I still like that group based on the technicals on the chart below. Readings aren't breaking down very much given the decline of the last two days. There appears to be a nice supporting cast in this industry group to keep price from dropping below support.
 Diamond Mine Information:
Recording from Today (9/18/2020) is at this link. Access Passcode: 0CFU!90Q
Register in advance for the next "DecisionPoint Diamond Mine" trading room on Friday (9/18) 12:00p EST:
Here is this week's registration link. Password: diamonds
Please do not share these links! They are for Diamonds subscribers ONLY!
A few items about the spreadsheet: I decided it only fair to denote "reader requests" as I shouldn't get to take credit if they turn out great! I've put on the spreadsheet whether the RSI is positive (green) or negative (red). The PMO column tells you if it is rising (green) or falling (red). Finally I've added my own "Sparkle Factor" that gives you my assessment going forward, bullish (green), bearish (red) or neutral (gray). The Sparkle Factor is basically my thoughts on whether I expect it to rise or fall. A neutral means it could really go either way so it could be added to a watch list. If you're in a stock I consider "neutral" going forward, the ball is in your court.
Register for the Free Trading Room at this link or click above. Our next session is on 9/14/2020!
Installed Building Products Inc (IBP)
EARNINGS: 10/29/2020 (BMO)
Installed Building Products, Inc. engages in the business of installing insulation for the residential new construction market. Its products include garage doors, rain gutters, shower doors, closet shelving, and mirrors. The company was founded in 1977 and is headquartered in Columbus, OH.
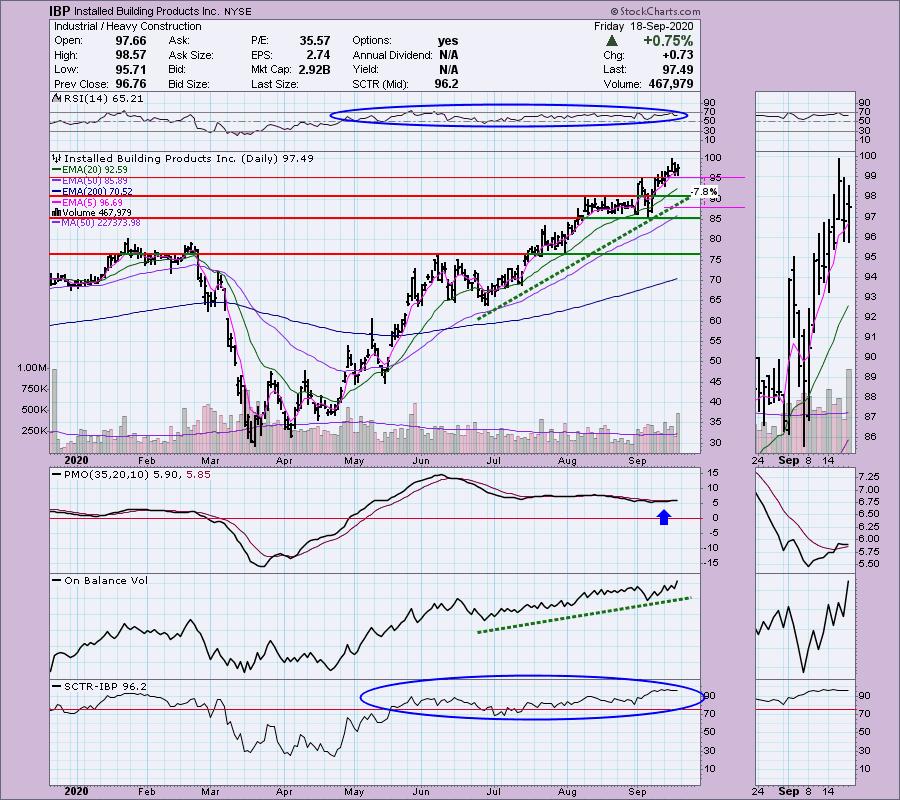
This one was a winner and it looks like it will continue to win. It is in a strong sector right now and construction might be a good group to be in post-hurricane, but I don't invest on the news. The chart is still very bullish as price is in a nice rising trend. The PMO is now on a BUY signal. The PMO did stutter today, but price action is very favorable and the RSI is not overbought.
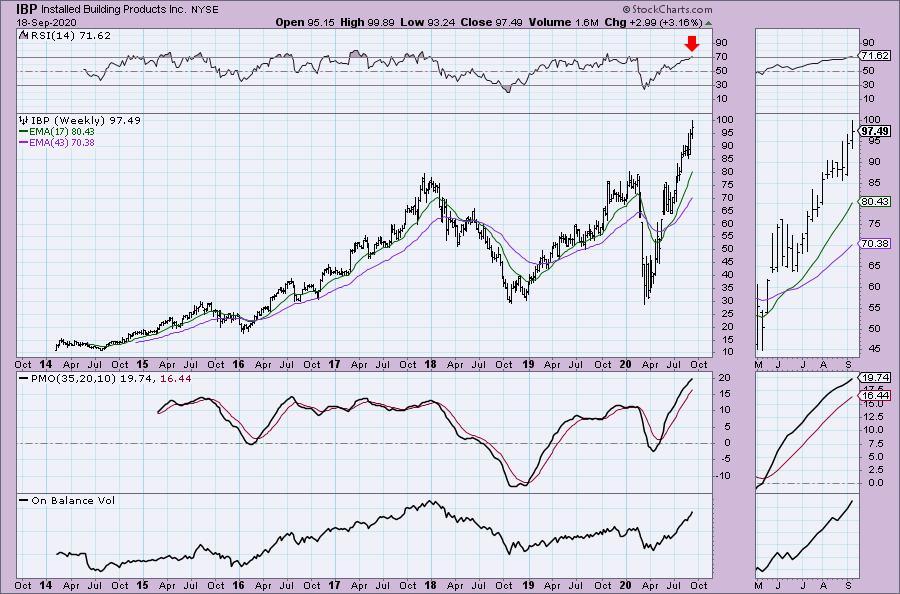
The weekly RSI is overbought, but I'm okay with that. The PMO continues to rise and the OBV is definitely confirming this intermediate-term rally.
Don't forget, on Thursdays I look at reader-requested symbols, so shoot me an email at erin@decisionpoint.com. I read every email I receive and try to answer them all!
Agnico Eagle Mines Ltd. (AEM)
EARNINGS: 10/28/2020 (AMC)
Agnico Eagle Mines Ltd. engages in the exploration and production of gold. It operates through the following segments: Northern Business, Southern Business, and Exploration. The Northern Business segment comprises of LaRonde mine, LaRonde Zone 5 mine, Lapa mine, Goldex mine, Meadowbank mine including the Amaruq deposit, Canadian Malartic joint operation, Meliadine project and Kittila mine. The Southern Business segment consists of Pinos Altos mine, Creston Mascota mine, and La India mine. The Exploration segment represents the exploration offices in the United States, Europe, Canada, and Latin America. The company was founded by Paul Penna in 1957 and is headquartered in Toronto, Canada.
Probably my least favorite thing to write about...the Diamond in the Rough that turned out to be zirconia. Carl named this a "pig's ear" formation which is a fake out or bull trap. It's not in the Encyclopedia of Chart Patterns by Thomas N. Bulkowski, but "rectangle" patterns are...and drum roll...it is a bearish reversal pattern and not a continuation pattern. One may think it resembles a bull flag. I agree, that was why I thought it was a continuation pattern. But let's get "textbook", a bull flag has a downward sloping flag or a pennant (symmetrical triangle) on a flagpole. So, this one actually resolved 'pattern-wise' back to the downside as expected. To be fair, the RSI was positive and at the time, the PMO was rising after a breakout above resistance. Right now, I'm bearish until it finds support at either the 50-EMA or the bottom of the rectangle. Based on Thomas Bulkowski's theory, it should actually break down out of that rectangle.
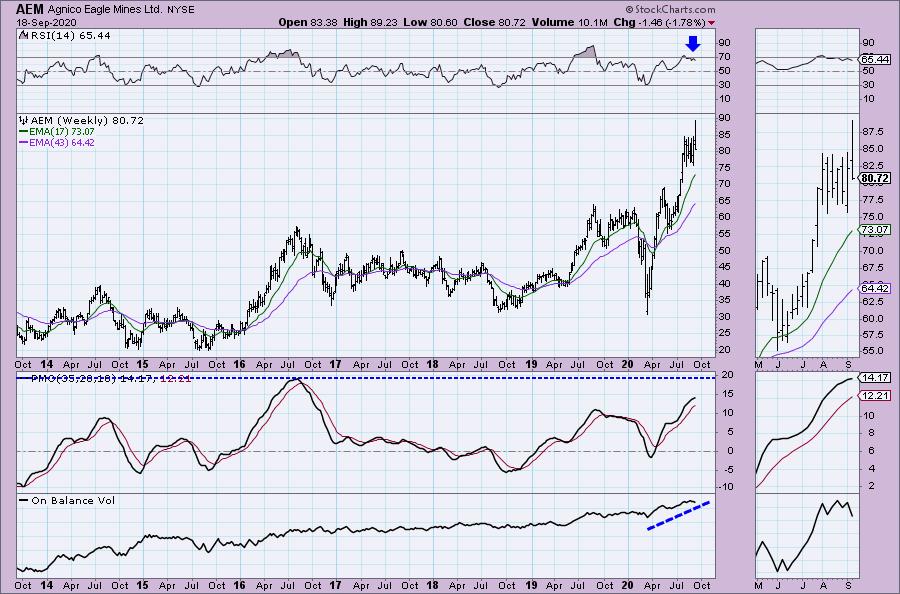
The weekly chart doesn't look that bad, but seeing that breakout and then a close at the bottom of the bar is very bearish.
CONCLUSION:
Sector to Watch: Health Care (XLV) and Industrials (XLI)
Industry Groups to Watch: Health Care Providers ($DJUSHP) and Railroads ($DJUSRR)/Commercial Vehicles & Trucks ($DJUSHR)
I believe Gold Miners may have a bit more pullback, but could be coming back next week. However, the areas I'm seeing as going into next week with strength would be Health Care Providers and within the Industrial sector, Railroads and Commercial Vehicles & Trucks. I had UNP as a Diamond on 9/15 and I'll search next week if my hunch is right in the $DJUSHR industry group. Go to our Sector ChartList on DecisionPoint.com to get an in depth view of all the sectors.
Have a Great Weekend! Happy Charting!
- Erin
erin@decisionpoint.com
Full Disclosure: I do not own any of the stocks on the spreadsheet. I'm about 50% invested right now and 50% is in 'cash', meaning in money markets and readily available to trade with.
Technical Analysis is a windsock, not a crystal ball.
Watch the latest episode of DecisionPoint with Carl & Erin Swenlin on Mondays 7:00p EST or on the DecisionPoint playlist on the StockCharts TV YouTube channel here!
NOTE: The stocks reported herein are from mechanical trading model scans that are based upon moving average relationships, momentum and volume. DecisionPoint analysis is then applied to get five selections from the scans. The selections given should prompt readers to do a chart review using their own analysis process. This letter is not a call for a specific action to buy, sell or short any of the stocks provided. There are NO sure things or guaranteed returns on the daily selection of "diamonds in the rough."
Helpful DecisionPoint Links:
DecisionPoint Shared ChartList and DecisionPoint Chart Gallery
Price Momentum Oscillator (PMO)
Swenlin Trading Oscillators (STO-B and STO-V)
For more links, go to DecisionPoint.com!
