
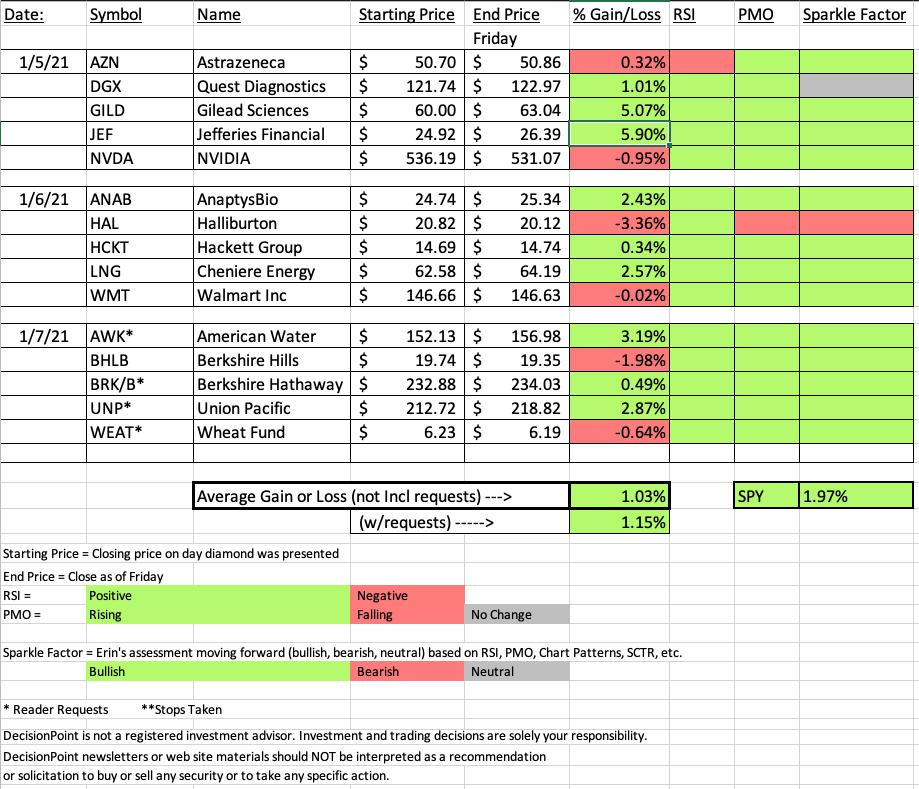
Overall it was a very positive week. Two of our "diamonds in the rough" finished up 5%+ this week. The problem right now is that most stocks are overbought and this week's Diamonds are no exception. This doesn't mean they will tumble lower, it means they need a pause or a small pullback to relieve overbought conditions. I will be looking to expand my portfolio early next week on the likely pauses and pullbacks of our Diamonds.
Today's Darling is Jeffries Financial (JEF) and today's Dud is Halliburton (HAL). Let's see why.
You'll find the recording links for today's Diamond Mine below. I went long today so the recording is 1 1/2 hours. You subscribe so I will cover as many of your symbol requests as possible. The Diamond Mine is a huge subscription perk and I will keep it that way. I still invite you to come to the free Monday trading room. We don't talk specifically about Diamonds, but I will tell you that I will usually pull your symbol requests before I pull others.
IMPORTANT! The new Diamond Mine registration link is available below. I've had subscribers that have missed the Diamond Mine because they didn't register early so do so asap. Remember to save your confirmation email from Zoom. If for some reason you can't find it, try re-registering using the links in the latest Diamond Report and you may be able to enter that way.
 Diamond Mine Information:
Here is today's (1/8/2021) recording link. Access Passcode: a7KA6TS=
===============================================================================
Register in advance for the next "DecisionPoint Diamond Mine" trading room on FRIDAY (1/15/2021) 12:00p ET:
Here is theRegistration Link & Entry Password: yellow
Please do not share these links! They are for Diamonds subscribers ONLY!
Save the registration confirmation email with login instructions in case Zoom doesn't notify you in time.
A few items about the spreadsheet: I decided it only fair to denote "reader requests" as I shouldn't get to take credit if they turn out great! I've put on the spreadsheet whether the RSI is positive (green) or negative (red). The PMO column tells you if it is rising (green) or falling (red). Finally I've added my own "Sparkle Factor" that gives you my assessment going forward, bullish (green), bearish (red) or neutral (gray). The Sparkle Factor is basically my thoughts on whether I expect it to rise or fall. A neutral means it could really go either way so it could be added to a watch list. If you're in a stock I consider "neutral" going forward, the ball is in your court.

It's FREE!
***Click here to register for this recurring free DecisionPoint Trading Room!***
Did you miss the 1/4/2021 DP Trading Room! Here's a link to the recording with Passcode: &z=1pfp2
For best results, copy and paste the password to avoid typos.
Darling:
Jefferies Financial Group Inc. (JEF)
EARNINGS: 3/25/2021 (AMC)
Jefferies Financial Group, Inc. is a holding company, which engages in the provision of financial services. It operates through the following segments: Investment Banking, Capital Markets, and Asset Management; Merchant Banking; and Corporate segments. The Investment Banking, Capital Markets, and Asset Management segment consists of investments in Jefferies Group. The Merchant Banking segment includes various merchant banking businesses and investments, primarily including Linkem, Vitesse Energy Finance and JETX Energy, real estate, Idaho Timber, and FXCM. The Corporate segment pertains to cash and cash equivalents, financial instruments owned, and deferred tax asset of the firm. The company was founded in 1968 and is headquartered in New York, NY.
Below is the chart with commentary from Tuesday 1/5:
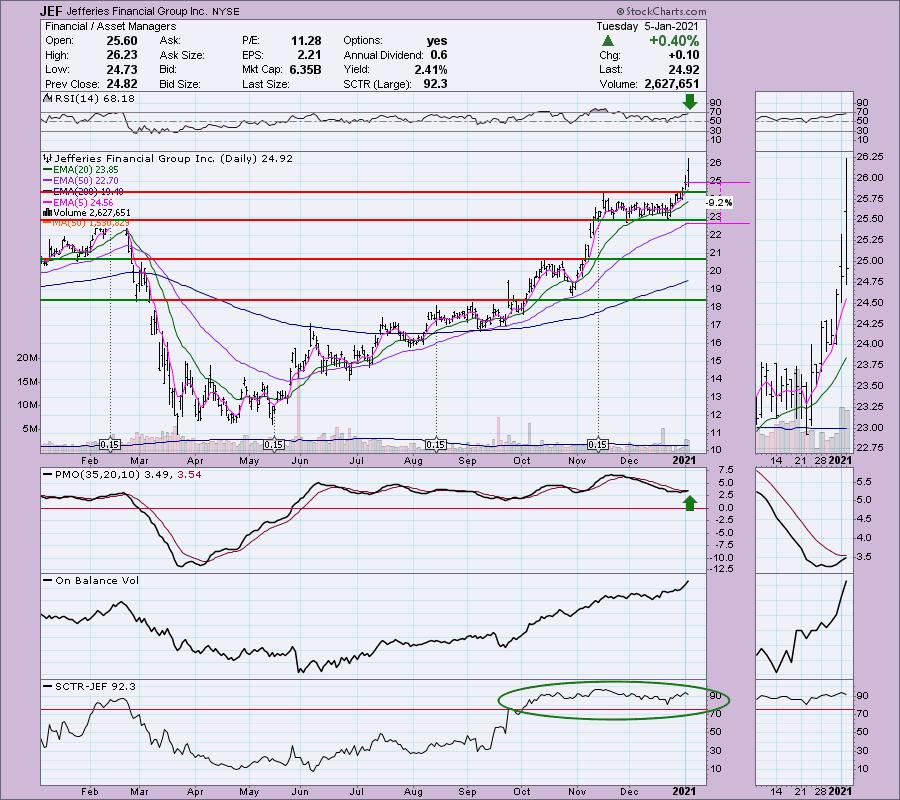
"JEF is up +0.25% in after hours trading. I was specifically watching my scans for Financials. Many of them rallied after the last stimulus bill was passed. It's only one data point, but it made sense that we could see some action in this sector. JEF is not a bank, but I had to present the chart despite a deep 9.2% stop. The strong breakout from the trading range occurred yesterday and today price was up substantially but closed much lower (still at a profit though). Price remains safely above the trading range. The RSI is somewhat overbought but positive nonetheless. The PMO is zeroing in on a crossover BUY signal. The OBV is confirming the breakout. It also helps that it has internal and relative strength based on the high SCTR value."
Here is today's chart:
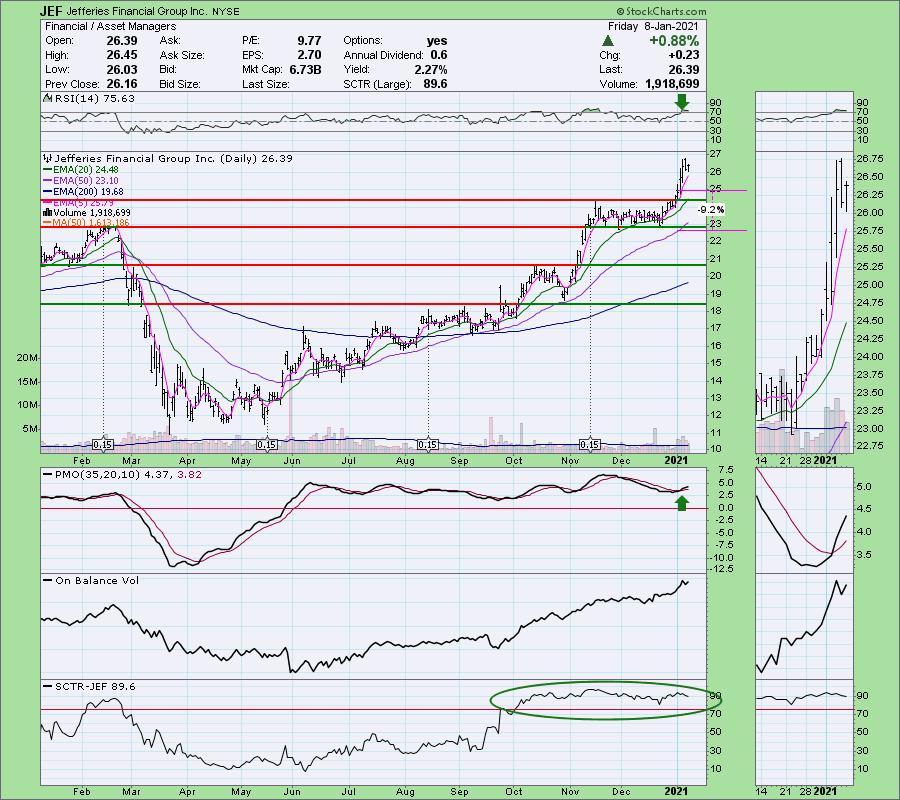
JEF is now very overbought and it does appear to be pulling back slightly or at least pausing. This is what I will be looking for on Monday and Tuesday as I contemplate entries into some of the past Diamonds. I don't want to enter a stock with an RSI that is overbought if I can help it. Other than the pause or pullback, the chart is still very bullish and I expect it to continue to outperform.
Don't forget, on Thursdays I look at reader-requested symbols, so shoot me an email at erin@decisionpoint.com. I read every email I receive and try to answer them all!
Dud:
Halliburton Co. (HAL)
EARNINGS: 1/19/2021 (BMO)
Halliburton Co. engages in the provision of services and products to the energy industry related to the exploration, development, and production of oil and natural gas. It operates through the following segments: Completion and Production, and Drilling and Evaluation. The Completion and Production segment delivers cementing, stimulation, intervention, pressure control, specialty chemicals, artificial lift, and completion services. The Drilling and Evaluation segment provides field and reservoir modeling, drilling, evaluation, and wellbore placement solutions that enable customers to model, measure, and optimize their well construction activities. The company was founded by Erle P. Halliburton in 1919 and is headquartered in Houston, TX.
Below is the chart with commentary from Tuesday 1/6:
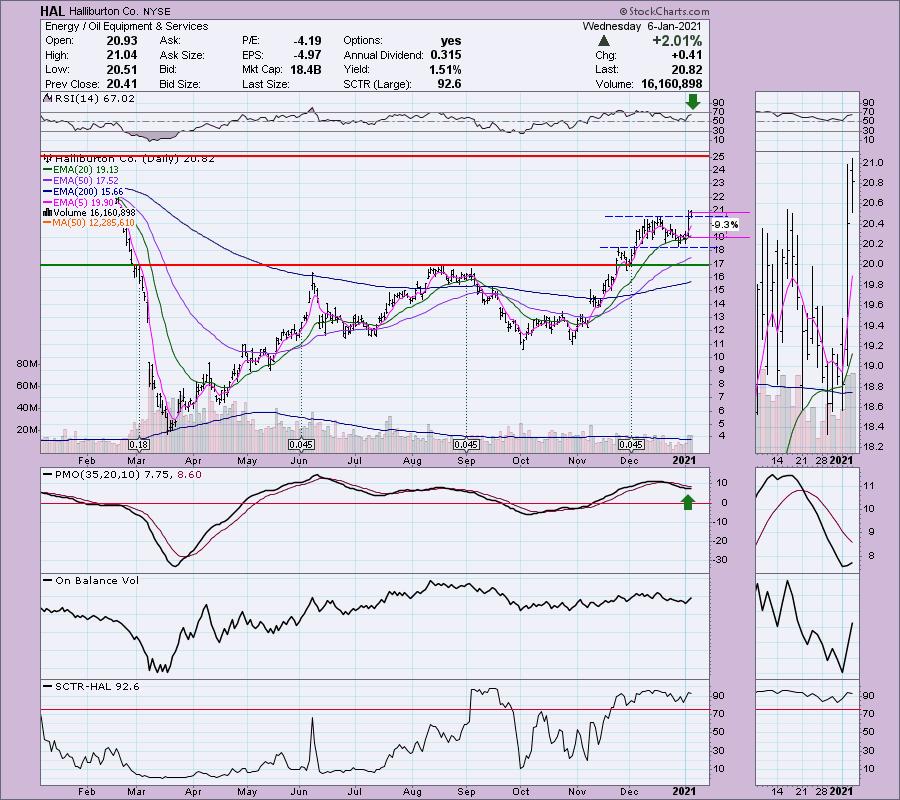
"HAL is unchanged in after hours trading. I was surprised I haven't suggested this as a Diamond previously. It looks good today with a positive RSI and a PMO that has just turned up. Yesterday's breakout didn't hold, but today it did. The SCTR is very positive. The OBV isn't great but we do see heavy accumulation over the last two days. The stop is rather deep. To get below support at $18, that was far too deep for me. I've aligned it with the 20-EMA."
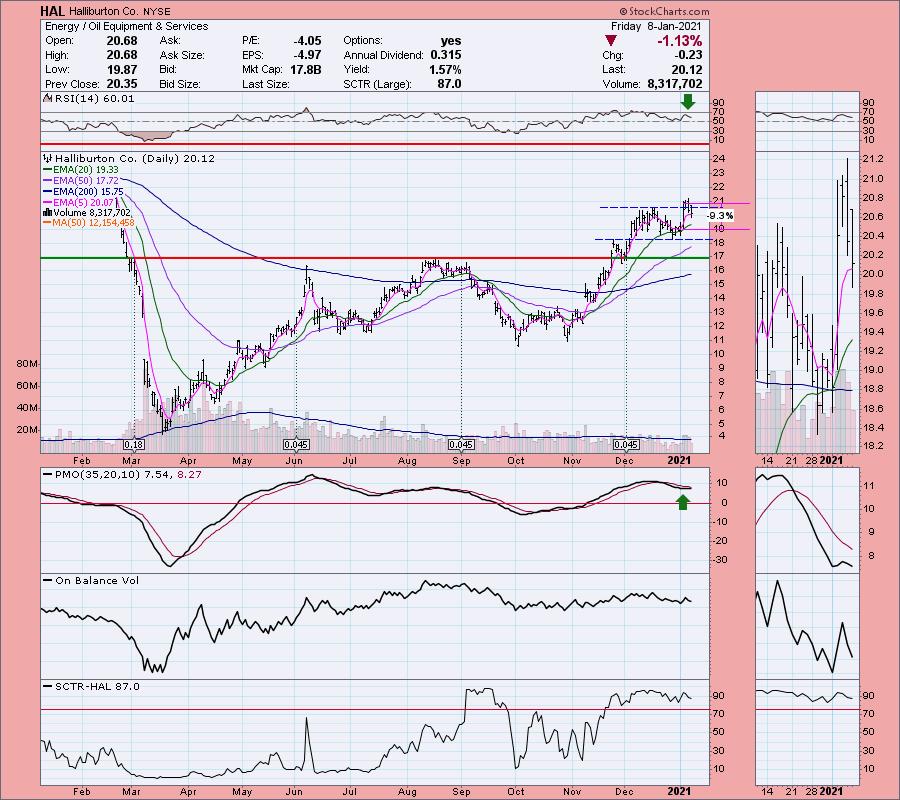
Below is today's chart:
I believe my analysis above was solid, but HAL didn't follow-through. It is the only diamond in the rough this week that has a bearish Sparkle Factor. The RSI is still positive, but I do not like that the breakout failed. The PMO has now topped below its signal line. Now that the OBV has topped, it is in a negative divergence with price tops. I suspect we will see this one test the $18 level before it moves higher. Of course at that point it will have formed a bearish double-top. Probably will be better "diamonds in the rough" to consider next week or you can review the Diamonds from the past month and likely find a better choice than waiting this one out.
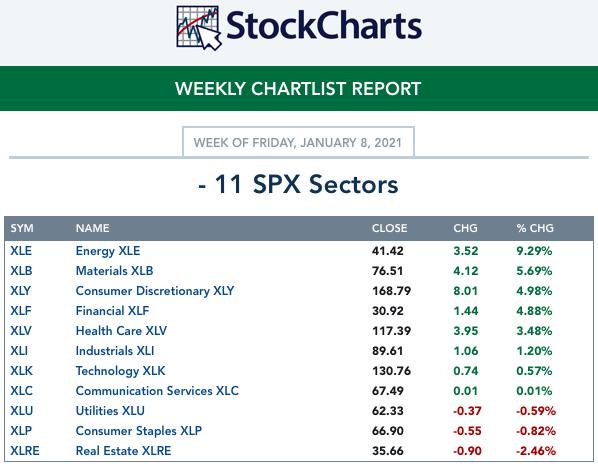
THIS WEEK's Sector Performance:
Click Here to view Carl's annotated Sector ChartList!
CONCLUSION:
Energy was the clear outperformed this week and I suspect it will continue to be a good area to pull from. I presented IEO today in "Your Daily Five" which I will link to in the DecisionPoint Newsletter later tonight. When I pick a "sector to watch", I go over all of the DP Sector charts and review indicators and price action to determine which has the best set-up going into the week. Overall, the sector chart with the most promise is
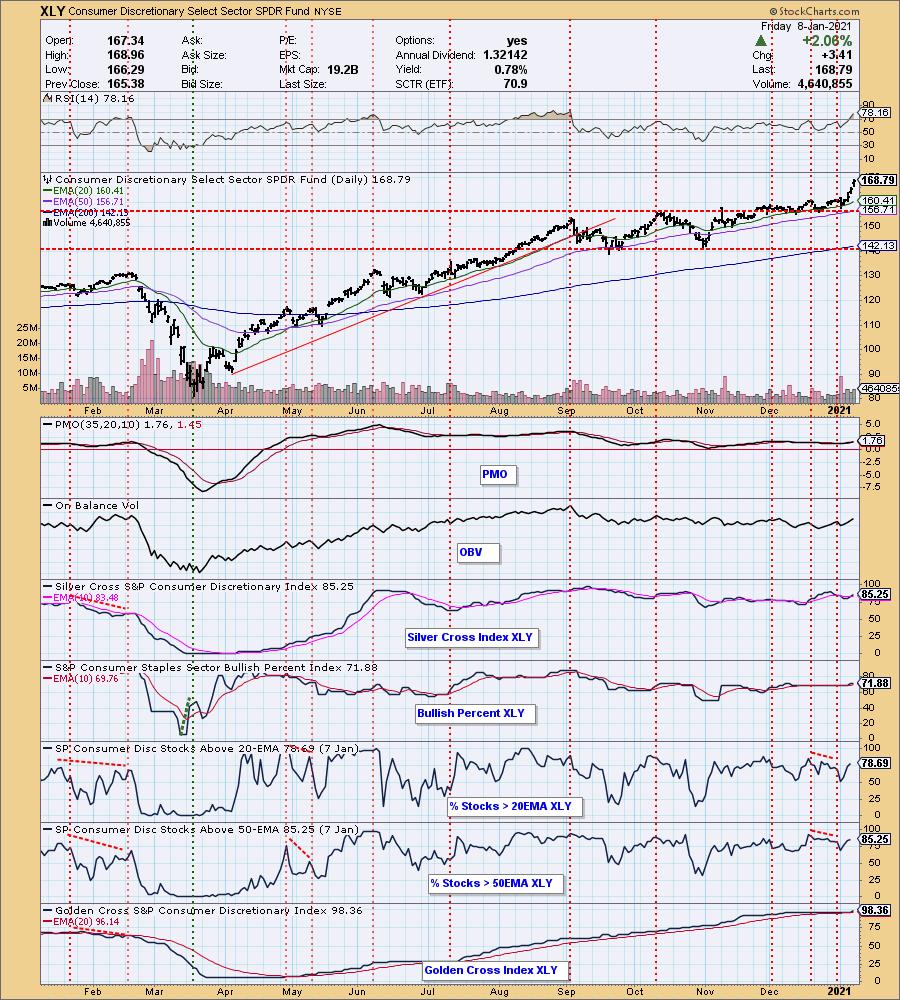
Sector to Watch: Consumer Discretionary (XLY). Unfortunately like most of the sectors, XLY is overbought, but the indicators are rising and aren't particularly overbought.
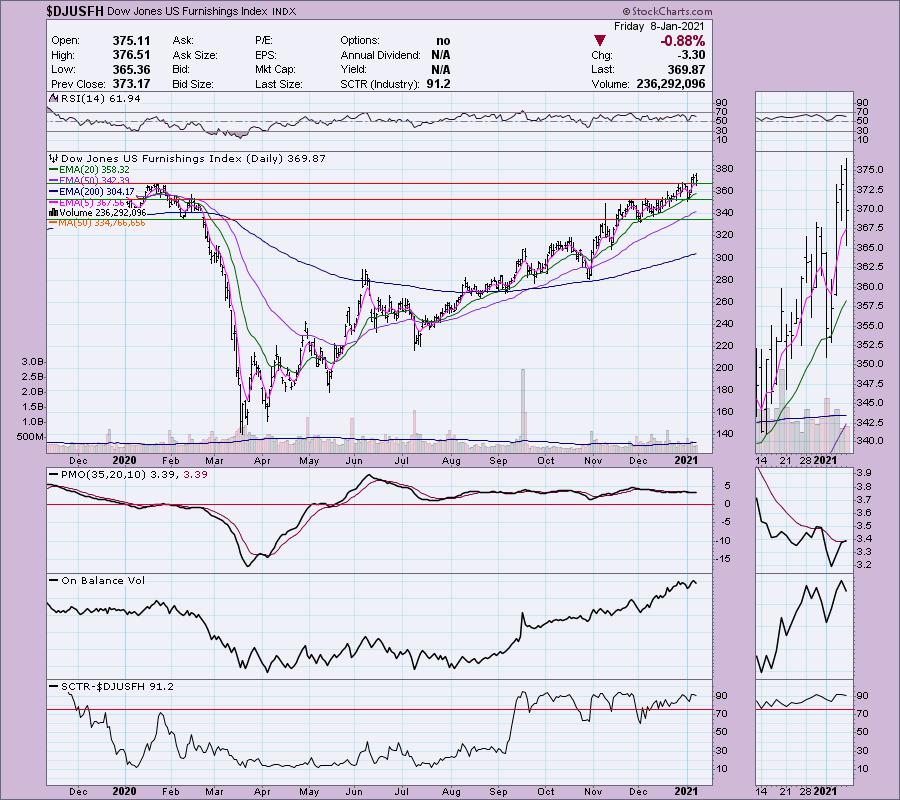
Industry Group to Watch: Furnishings Index ($DJUSFH)
While this doesn't have the highest SCTR in the Consumer Discretionary sector, it did just have a very important breakout and now pullback today. It will be interesting to see if any of these stocks show up in my scans next week.
Go to our Sector ChartList on DecisionPoint.com to get an in depth view of all the sectors.
Happy Charting!
- Erin
erin@decisionpoint.com
Full Disclosure: I'm about 50% invested right now and 50% is in 'cash', meaning in money markets and readily available to trade with. I will expanding my portfolio next week during what I believe will be a pause or small pullback to relieve overbought conditions within most areas of the market.
Technical Analysis is a windsock, not a crystal ball.
Watch the latest episode of DecisionPoint with Carl & Erin Swenlin on Mondays 7:00p EST or on the DecisionPoint playlist on the StockCharts TV YouTube channel here!
NOTE: The stocks reported herein are from mechanical trading model scans that are based upon moving average relationships, momentum and volume. DecisionPoint analysis is then applied to get five selections from the scans. The selections given should prompt readers to do a chart review using their own analysis process. This letter is not a call for a specific action to buy, sell or short any of the stocks provided. There are NO sure things or guaranteed returns on the daily selection of "diamonds in the rough."
Helpful DecisionPoint Links:
DecisionPoint Shared ChartList and DecisionPoint Chart Gallery
Price Momentum Oscillator (PMO)
Swenlin Trading Oscillators (STO-B and STO-V)
For more links, go to DecisionPoint.com!