
Today's "Bullish EMA - MidRange SCTR" scan presented about 125 results. What blew me away was that 25 of those results were Banks. Interestingly, I opted not to present any because nearly all were overbought. If you're holding a Bank stock, I'd continue to hold it simply based on the magnitude of Bank stocks that landed in my scan results. Last Thursday I presented American Express (AXP) and I think it is still a hot property in the Financial sector.
Other hot areas of the market continue to be travel and tourism related. These are now running in overbought territory as well. Industrials are impressing right now. The Dow closed up yesterday when the other broad market indexes closed lower. I found a stocks in this area for you.
Energy and particularly Integrated Oil & Gas industry are outperforming. I found an outperformer within that group.
Finally, I pointed out a week ago that the Insurance industry groups were looking good. I found a stock that had been lagging in that group, but it is coming back to life and isn't overbought like its brethren.
Today's "Diamonds in the Rough" are: CBT, IR, MUR, PGR and ROAD.
FREE UPCOMING APPEARANCES NEXT WEEK!
I'll be presenting at two excellent online conferences next week. I would very much appreciate it if you would register for both events. If you can't go a recording will be sent and every sign up that I receive adds 'gravitas'.

MARCH 2nd, 2021 at 4:00p ET:
"Using Charts To Improve Your Trading Success"
- How To Identify Powerful Chart Patterns
- Ways To Calculate Upside and Downside Targets
- Top Signal To Know It's Time To Exit
- Best Way To Set Stops To Minimize Losses
REGISTER here for the Festival of Traders conference!


3rd Annual Women Teach Trading and Investing (March 1-5) My Presentation on MARCH 3rd at 3:30p ET:
"Building Blocks of Technical Analysis"
- Everything you need to know to start using stock charting to improve your portfolio
- Support and Resistance, Overbought v. Oversold and Volume
- Basic Market and Stock indicators
- Trendlines and Chart Patterns
- Stops, Entries and Exits
REGISTER HERE for the TimingResearch.com and TradeOutLoud.com webinar event.
 Diamond Mine Registration Information:
When: Feb 26, 2021 09:00 AM Pacific Time (US and Canada)
Topic: DecisionPoint Diamond Mine (02/26/2021) LIVE Trading Room
Register in advance for this webinar:
https://zoom.us/webinar/register/WN_MeUlJ9HZRCStunv7yK5-LA
After registering, you will receive a confirmation email containing information about joining the webinar, including the password.
=======================================================================
Recording Link:
Topic: DecisionPoint Diamond Mine (2/19/2021) LIVE Trading Room
Start Time : Feb 19, 2021 08:50 AM
Meeting Recording:
Access Passcode: v^9Yi2.c
David Keller, CMT, Chief Technical Analyst at StockCharts.com will be joining me in the free DP Trading Room on March 1st! Dave will give us his take on the market and share his trading methodologies as both of us discuss your symbol requests.

David Keller, CMT is Chief Market Strategist at StockCharts.com, where he helps investors minimize behavioral biases through technical analysis. He is a frequent host on StockCharts TV, and he relates mindfulness techniques to investor decision making in his blog, The Mindful Investor. David is also President and Chief Strategist at Sierra Alpha Research LLC, a boutique investment research firm focused on managing risk through market awareness. He combines the strengths of technical analysis, behavioral finance, and data visualization to identify investment opportunities and enrich relationships between advisors and clients.
***Click here to register for this recurring free DecisionPoint Trading Room on Mondays at Noon ET!***
+++++++++++++++++++++++++++++++++++++++++++++++++++++++++++++++++++++++++++++++
Here is the information for the Monday 2/22/2021 recording:
Topic: DecisionPoint Trading Room
Start Time : Feb 22, 2021 08:57 AM
Meeting Recording:
Access Passcode: L%tC6D47
For best results, copy and paste the access code to avoid typos.
Welcome to DecisionPoint Daily Diamonds, wherein I highlight five "diamonds in the rough." These are selected from the results of my DecisionPoint scans, which search for stocks that could benefit from the trend and condition of the market. Remember, these are not recommendations to buy or sell, but are the most interesting of the stocks that surfaced in my scans. My objective is to save you the work of the initial, tedious culling process, but you need to apply your own analysis to see if these stocks pique your interest as well. There are no guaranteed winners here!
Cabot Corp. (CBT)
EARNINGS: 5/10/2021 (AMC)
Cabot Corp. is a global specialty chemicals and performance materials company. Its products are rubber and specialty grade carbon blacks, specialty compounds, fumed metal oxides, activated carbons, inkjet colorants, and aerogel. The company operates through the following segments: Reinforcement Materials, Performance Chemicals, and Purification Solutions. The Reinforcement Materials segment involves the rubber blacks and elastomer composites product lines. The Performance Chemicals segment combines the specialty carbons and compounds and inkjet colorants product lines into the specialty carbons and formulations business. The Purification Solutions segment refers to the activated carbon business and the specialty fluids segment. Cabot was founded by Godfrey Lowell Cabot in 1882 and is headquartered in Boston, MA.
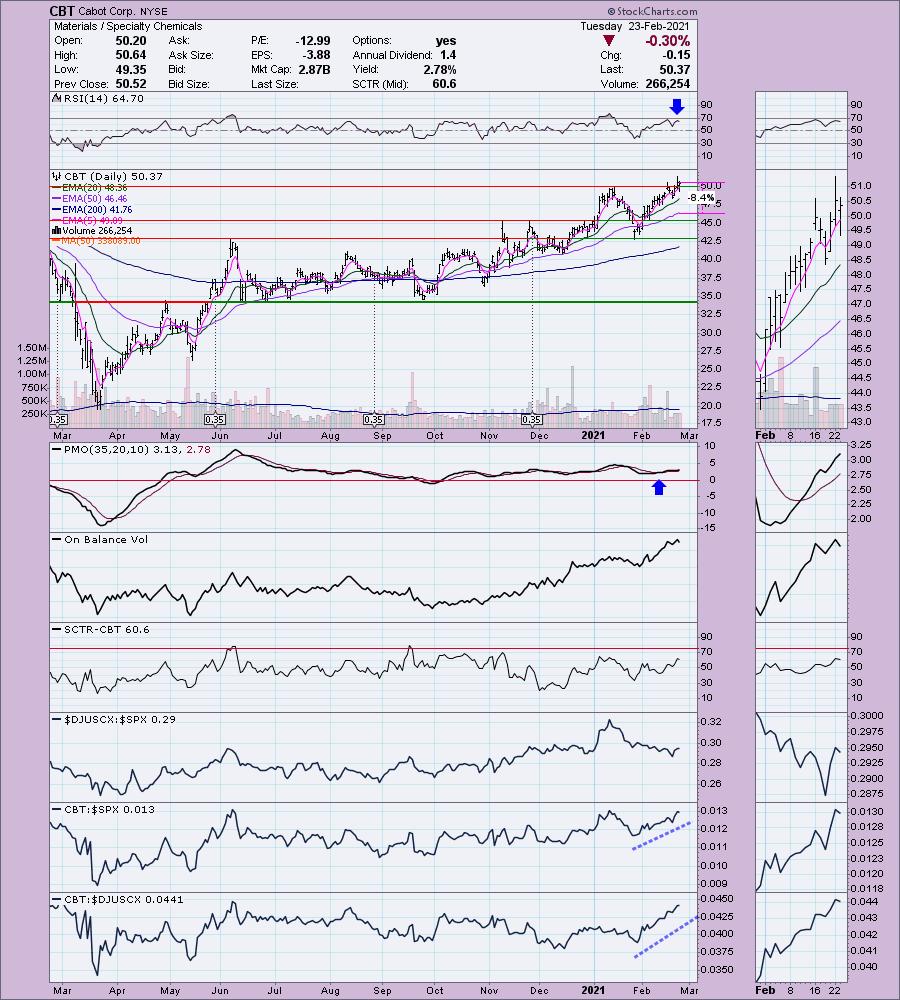
CBT is unchanged in after hours trading. Of course I have another Materials stock for you. Granted this one comes from an industry group that isn't performing very well, but CBT is faring quite well against the SPX and the group. Price broke out yesterday and stayed above overhead resistance today. The RSI is positive and not overbought. The PMO has recently bottomed above its signal line which is very bullish. It isn't overbought either. I set the stop near the 50-EMA.
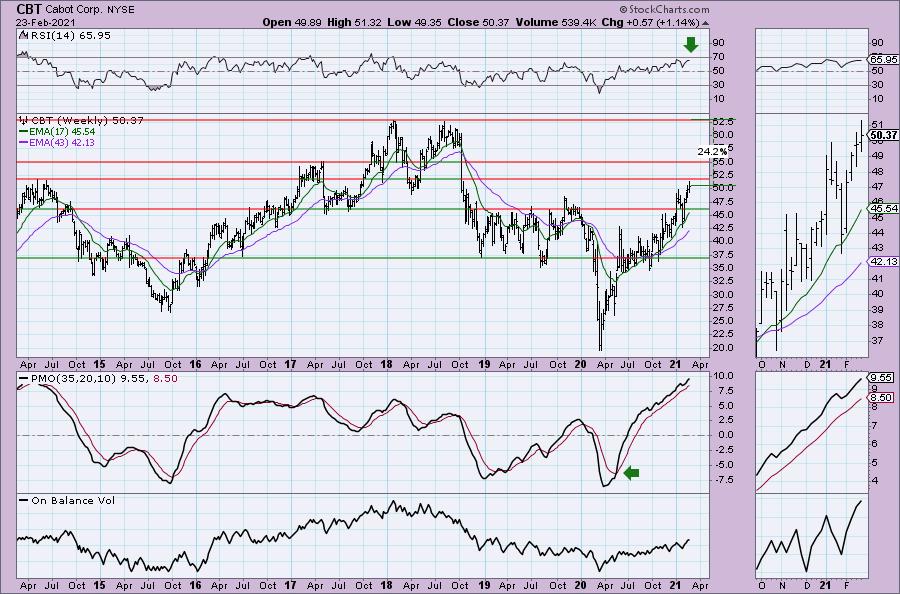
The weekly chart looks good as well. There is overhead resistance at the 2014 top ahead, but the tougher resistance will be past that at $55 or the 2017 high. The PMO is overbought, but rising strongly and the RSI is positive. The OBV is confirming the stock's bull market since the bear market low.
Ingersoll Rand Inc (IR)
EARNINGS: 5/10/2021 (AMC)
Ingersoll Rand, Inc. provides a broad range of mission critical air, fluid, energy, specialty vehicle and medical technologies, providing services and solutions to increase industrial productivity and efficiency. It operates through the following segments: Industrial Technologies and Services, Precision and Science Technologies, High Pressure Solutions, and Specialty Vehicle Technologies. The Industrial Technologies and Services segment designs, manufactures, markets and services a range of compression and vacuum equipment as well as fluid transfer equipment, loading systems, power tools and lifting equipment. The Precision and Science Technologies segment involves in designing, manufacturing and marketing a range of positive displacement pumps, fluid management equipment and aftermarket parts for medical, laboratory, industrial manufacturing, water and wastewater, chemical processing, energy, food and beverage, agriculture and other markets. The High Pressure Solutions segment includes designing, manufacturing and marketing a diverse range of positive displacement pumps, integrated systems and associated aftermarket parts, consumables and services. The Specialty Vehicle Technologies segment focuses in designing, manufacturing and marketing Club Car golf, utility and consumer low-speed vehicles. The company was founded in 1872 and is headquartered in Davidson, NC.
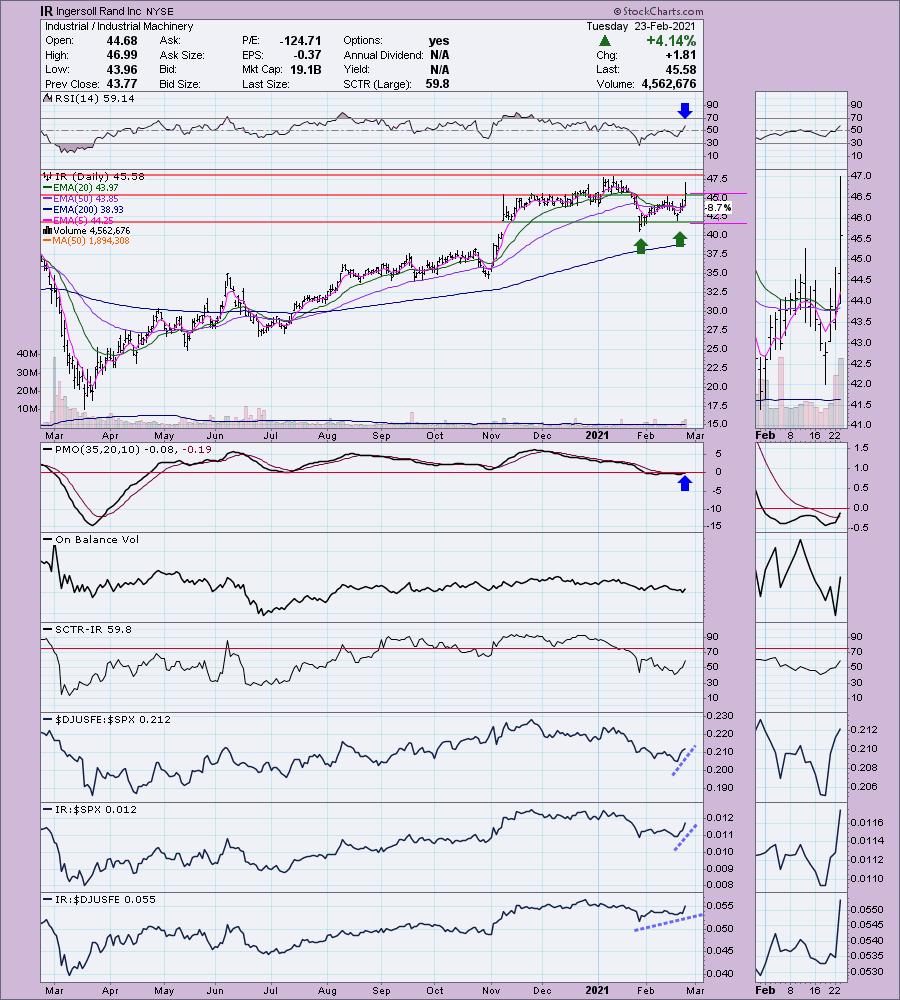
IR is unchanged in after hours trading. Today it popped on earnings. It settled back down above the confirmation line of the double-bottom pattern The PMO just triggered a crossover BUY signal and the RSI has reached positive territory. This group is beginning to outperform and IR seems a strong candidate as its performance is improving against the SPX and its industry group.
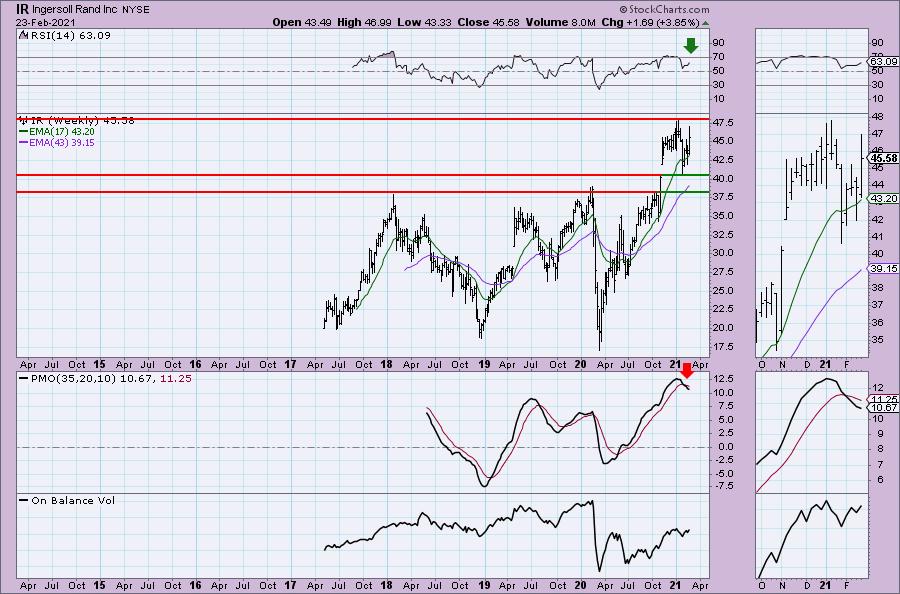
The weekly PMO isn't favorable, but it is decelerating on this week's rally. The RSI is positive and the OBV has rising bottoms.
Murphy Oil Corp. Holding Co. (MUR)
EARNINGS: 5/5/2021 (BMO)
Murphy Oil Corp. is a holding company, which engages in the exploration and production of oil and natural gas. It operates through the Exploration and Production and Corporate and Other segment. The Exploration and Production segment includes the United States, Canada, and all other countries. The Corporate and Other segment focuses on interest income, other gains and losses, interest expense, and unallocated overhead. The company was founded by Charles H. Murphy Jr. in 1950 and is headquartered in Houston, TX.
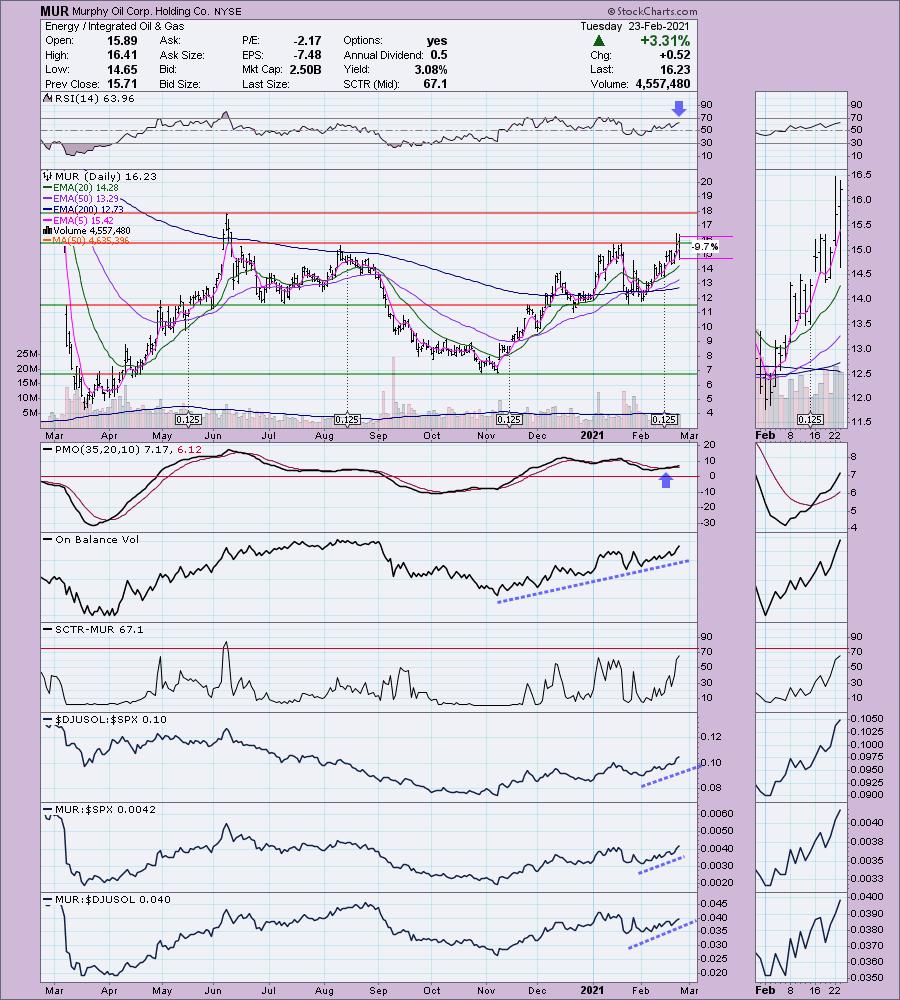
MUR is unchanged in after hours trading. Yesterday price broke out, but wasn't able to close above overhead resistance. Today it did. This is in a strong industry group and its outperformance speaks for itself. The PMO is on a BUY signal and the RSI is positive and not overbought. There is overhead resistance at the June top, but given the strength in the Energy sector and this industry, I don't expect it to struggle against it.
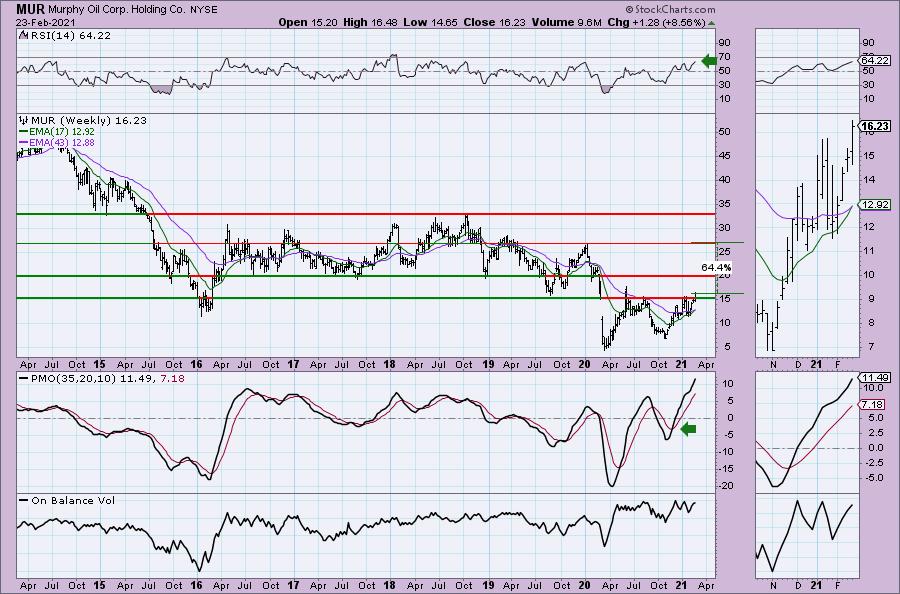
The weekly PMO is rising and the weekly RSI is positive. This one has plenty of upside potential. Even if it just reached the pre-bear market price it is a 64%+ gain.
Don't forget, on Thursdays I look at reader-requested symbols, so shoot me an email at erin@decisionpoint.com. I read every email I receive and try to answer them all!
Progressive Corp. (PGR)
EARNINGS: 4/14/2021 (BMO)
Progressive Corp. is an insurance holding company, which engages in the provision of personal and commercial auto insurance, residential property insurance, and other specialty property-casualty insurance and related services. It operates through the following segments: Personal Lines, Commercial Lines and Property. The Personal Lines segment includes agency and direct businesses. The Commercial Lines segment writes primary liability and physical damage insurance for automobiles and trucks owned and operated predominately by small business in the auto, for-hire transportation, contractor, for-hire specialty, tow, and for-hire livery markets. The Property segment covers residential property insurance for homeowners, other property owners, and renters. The company was founded in 1965 and is headquartered in Mayfield Village, OH.
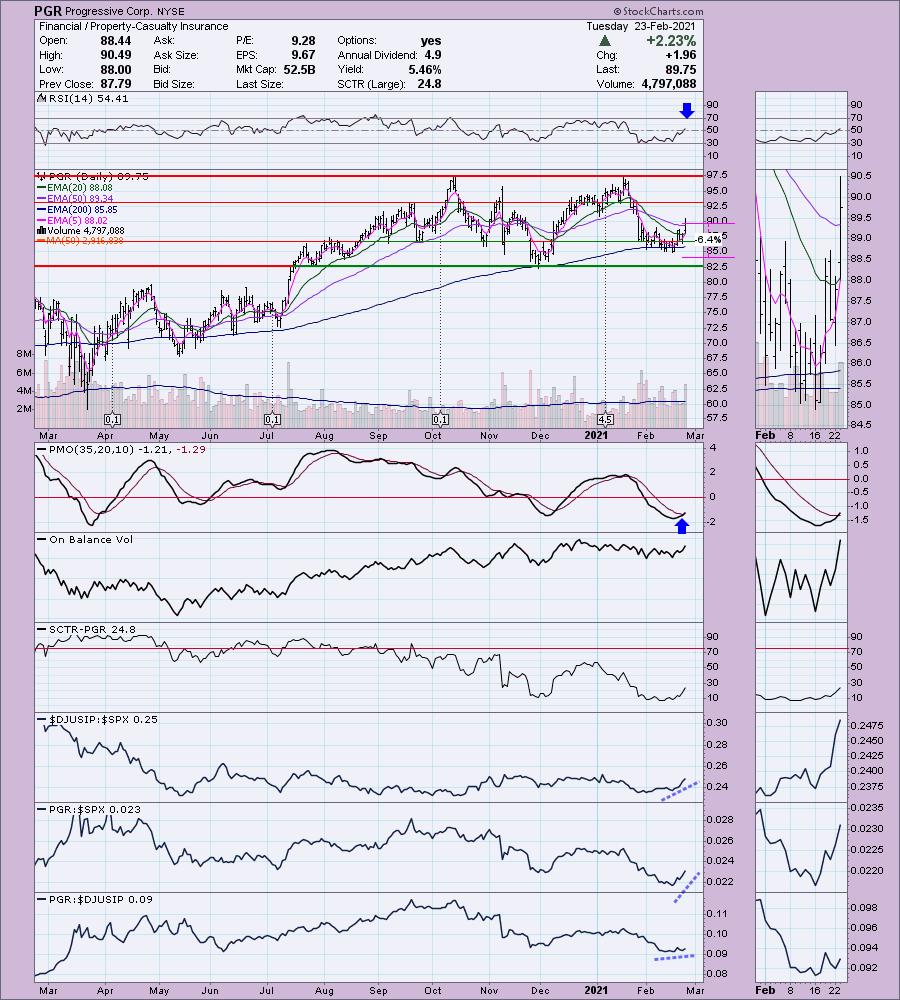
PGR is unchanged in after hours trading. I covered PGR back on April 15th 2020. There was a 4:5 split in January, so I did the calculations and the stop wasn't hit (although it was very very close). That means that PGR is up 19% since. This stock has been about average in its industry group, but the group is very hot and this one is finally breaking out. Today price broke and closed above the 50-EMA. The PMO just triggered a BUY signal and the RSI just went positive. This is what a BUY looks like on a 5-minute chart, remember? We wait for the PMO positive crossover and positive RSI for entry. No guarantees here, but just illustrating the point. The stop level doesn't need to be too deep. You could stretch it to the November low.
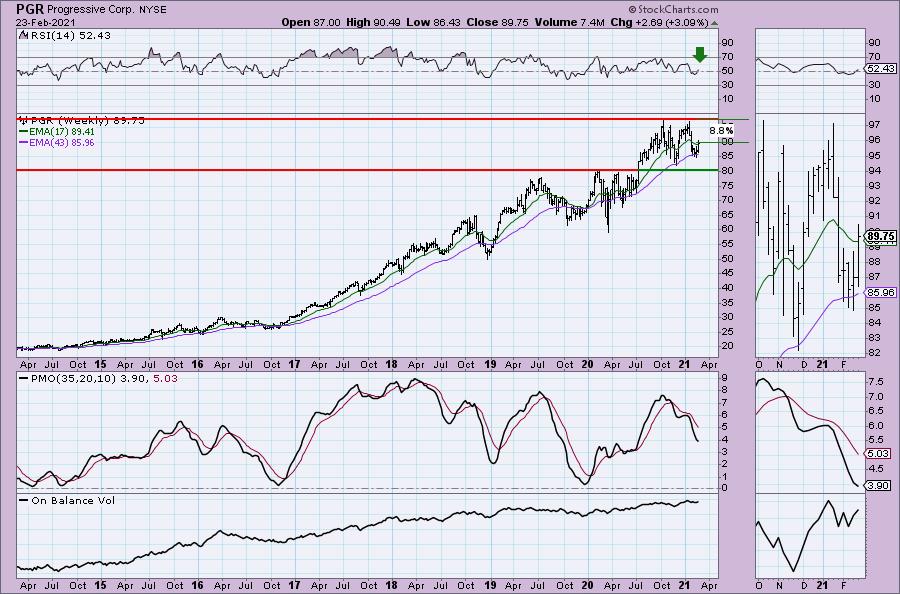
Overhead resistance at the all-time highs could pose a problem, but the weekly RSI just moved positive and the weekly PMO is decelerating its decline.
Construction Partners, Inc. (ROAD)
EARNINGS: 5/7/2021 (BMO)
Construction Partners, Inc. engages in construction of roadways and highways. It acquires road construction companies with services in asphalt production, paving and other construction services for both the public and private sectors. The company was founded by Ned N. Fleming, R. Alan Palmer & Charles E. Owens in 1999 and is headquartered in Dothan, AL.
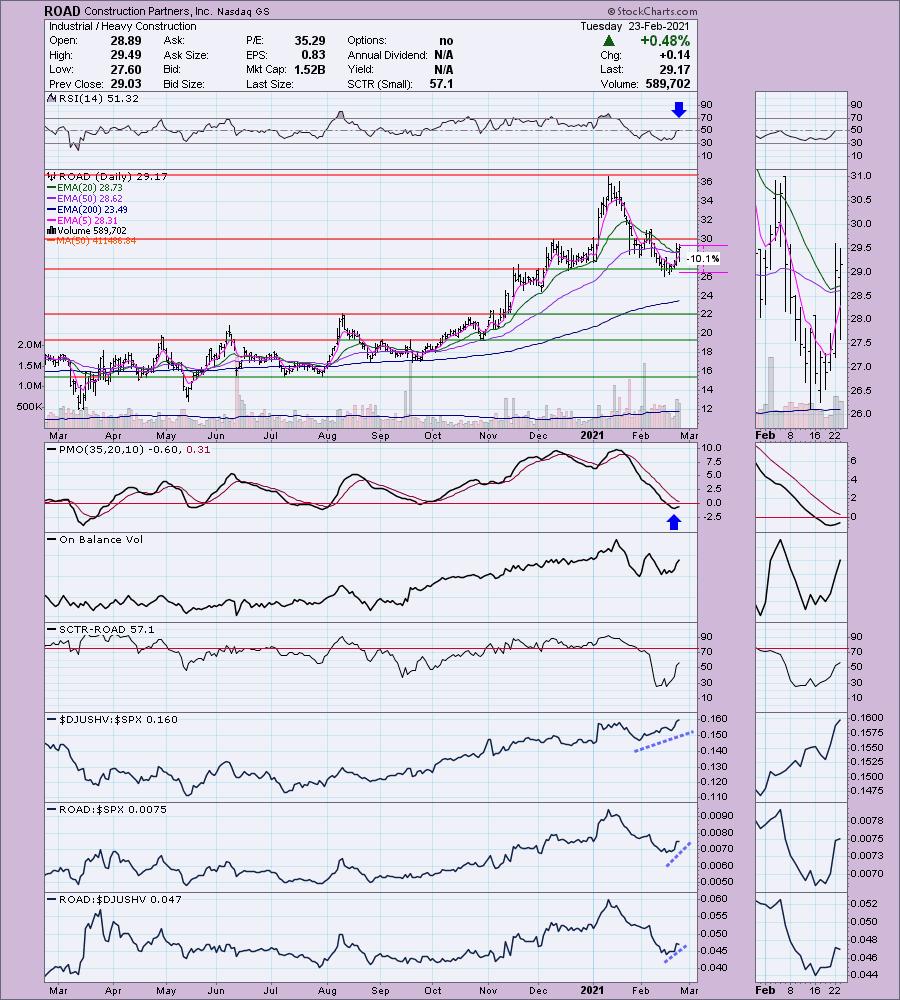
ROAD is unchanged in after hours trading. Such a clever symbol! This one is a sleeper in my opinion. It is beginning to outperform and is in an industry group that could find much favor this summer. There is talk of an infrastructure bill in congress and I suspect this industry group will reap some of those rewards. We may be in here a little early, but after that giant correction this one is looking attractive. The RSI just entered positive territory and the PMO has turned up. The 20-EMA narrowly avoided a negative crossover so the IT Trend Model BUY signal remains intact. The stop level is a bit deep, but likely necessary.
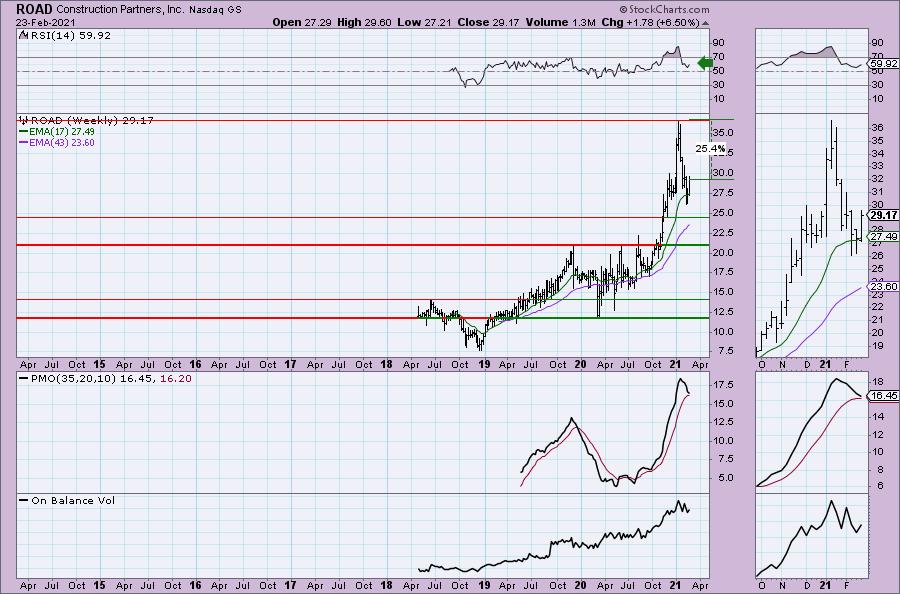
The weekly PMO reflects the correction. However, the RSI remains positive. If it can reach last month's high, that would be an over 25% gain.
Full Disclosure: I'm about 80% invested and 10% is in 'cash', meaning in money markets and readily available to trade with. I'm attempting to shuffle my portfolio around, I'll let you know how it sorts out. I am interested in AXP, XME, JETS and possible adding to my solar positions on their correction. The market overall isn't lined up for success. I'll keep you posted.
Current Market Outlook:
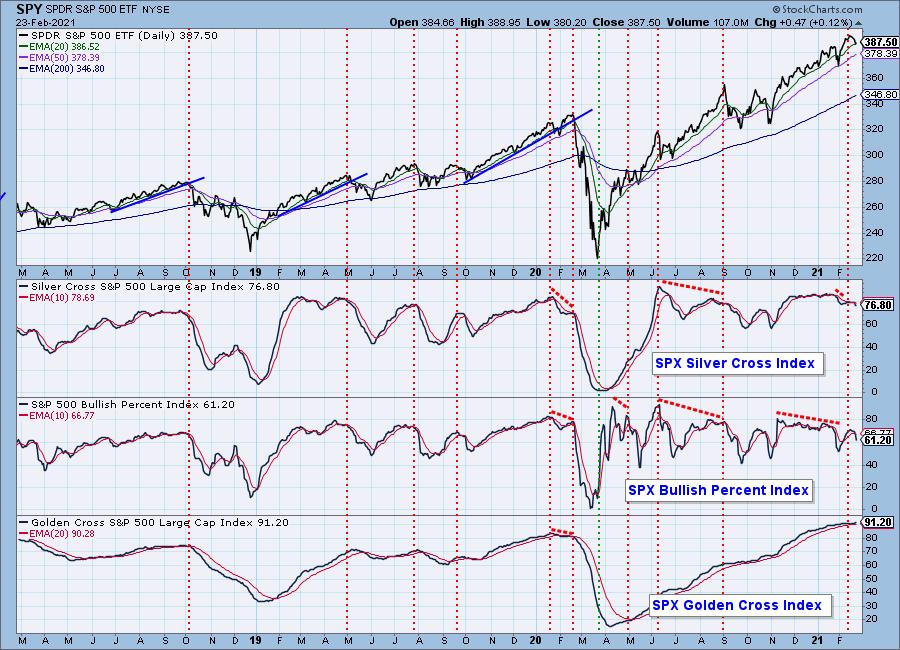
Market Environment: It is important to consider the odds for success by assessing the market tides. The following chart uses different methodologies for objectively showing the depth and trend of participation for intermediate- and long-term time frames.
- The Silver Cross Index (SCI) shows the percentage of SPX stocks on IT Trend Model BUY signals (20-EMA > 50-EMA)
- The Golden Cross Index (GCI) shows the percentage of SPX stocks on LT Trend Model BUY signals (50-EMA > 200-EMA)
- The Bullish Percent Index (BPI) shows the percentage of SPX stocks on Point & Figure BUY signals.
Don't forget that as a "Diamonds" member, you have access to our GCI/SCI curated ChartList on DecisionPoint.com. You'll find it under "Members Only" links on the left side on the Blogs and Links Page.
Here is the current chart:
Diamond Index:
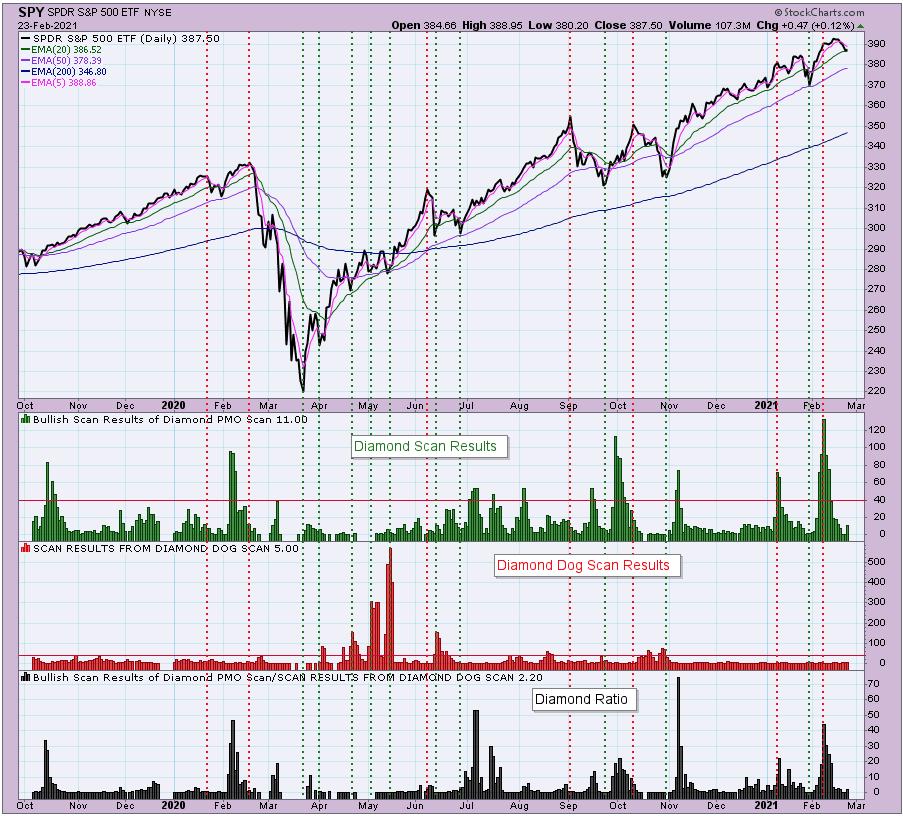
The Diamond Index chart looks at the number of scan results from my bullish Diamond PMO Scan and the number of scan results from the inverse Diamond Dog Scan. The Diamond Ratio divides the bullish results by the bearish results.
I only have data going back to October 2019 so I won't make any sweeping conclusions about the Diamond Index chart. I have marked cardinal tops with red dotted vertical lines and cardinal price bottoms with green dotted vertical lines. I believe that when the Diamond Dog results spike, it usually comes at a price bottom, or marks a strong continuation of the rising trend.
Unfortunately, the Diamond PMO Scan result numbers aren't providing much insight. The Diamond Ratio has promise, but again I don't see a clear correlation to the market tops/bottoms right now. I need to study and manipulate the data some more. Keep you posted!
Technical Analysis is a windsock, not a crystal ball.
Happy Charting!
- Erin
erin@decisionpoint.com
Watch the latest episode of DecisionPoint with Carl & Erin Swenlin on Mondays 7:00p EST or on the DecisionPoint playlist on the StockCharts TV YouTube channel here!
NOTE: The stocks reported herein are from mechanical trading model scans that are based upon moving average relationships, momentum and volume. DecisionPoint analysis is then applied to get five selections from the scans. The selections given should prompt readers to do a chart review using their own analysis process. This letter is not a call for a specific action to buy, sell or short any of the stocks provided. There are NO sure things or guaranteed returns on the daily selection of "diamonds in the rough."
Helpful DecisionPoint Links:
DecisionPoint Shared ChartList and DecisionPoint Chart Gallery
Price Momentum Oscillator (PMO)
Swenlin Trading Oscillators (STO-B and STO-V)
For more links, go to DecisionPoint.com!
