
Today, I ran a scan that I've not used in some time; not because it isn't a profitable one, but because many times I get too many choices or find that the stocks have had a strong rally day and could use a pullback. It finds stocks that have just triggered Short-Term Trend Model BUY signals. A ST Trend Model BUY signal is generated when the 5-EMA crosses above the 20-EMA. These stocks did have strong rally days (minus one), but they have quite a bit of upside potential even after these strong moves.
I decided to showcase four "diamonds in the rough" versus just three today simply because I couldn't decide which one to let go of.
Today's "Diamonds in the Rough" are: AG, FWONA, HEAR and LPI.
 Diamond Mine REGISTRATION Information:
When: Apr 9, 2021 09:00 AM Pacific Time (US and Canada)
Topic: DecisionPoint Diamond Mine LIVE Trading Room
Register in advance for this webinar HERE!
After registering, you will receive a confirmation email containing information about joining the webinar.
After registering, you will receive a confirmation email containing information about joining the webinar, including the password.
=======================================================================
Diamond Mine RECORDING Link from 3/26/2021:
Topic: DecisionPoint Diamond Mine (04/02/2021) LIVE Trading Room
Start Time : Apr 2, 2021 09:00 AM
Meeting Recording HERE!
Access Passcode: DM_04/02
***Click here to register for this recurring free DecisionPoint Trading Room on Mondays at Noon ET!***
+++++++++++++++++++++++++++++++++++++++++++++++++++++++++++++++++++++++++++++++
Free DP Trading Room RECORDING LINK:
Topic: DecisionPoint Trading Room
Start Time : Apr 5, 2021 08:57 AM
Meeting Recording HERE!
Access Passcode: April_4/5
For best results, copy and paste the access code to avoid typos.
Welcome to DecisionPoint Daily Diamonds, wherein I highlight five "diamonds in the rough." These are selected from the results of my DecisionPoint scans, which search for stocks that could benefit from the trend and condition of the market. Remember, these are not recommendations to buy or sell, but are the most interesting of the stocks that surfaced in my scans. My objective is to save you the work of the initial, tedious culling process, but you need to apply your own analysis to see if these stocks pique your interest as well. There are no guaranteed winners here!
First Majestic Silver Corp. (AG)
EARNINGS: 5/13/2021
First Majestic Silver Corp. engages in the production, development, exploration and acquisition of mineral properties. It owns and operates producing mines in México including La Encantada Silver Mine; La Parrilla Silver Mine; San Martin Silver Mine; La Guitarra Silver Mine; Del Toro Silver Mine; Santa Elena Silver & Gold Mine; and San Dimas Silver & Gold Mine. The company was founded by Keith Neumeyer on September 26, 1979 and is headquartered in Vancouver, Canada.
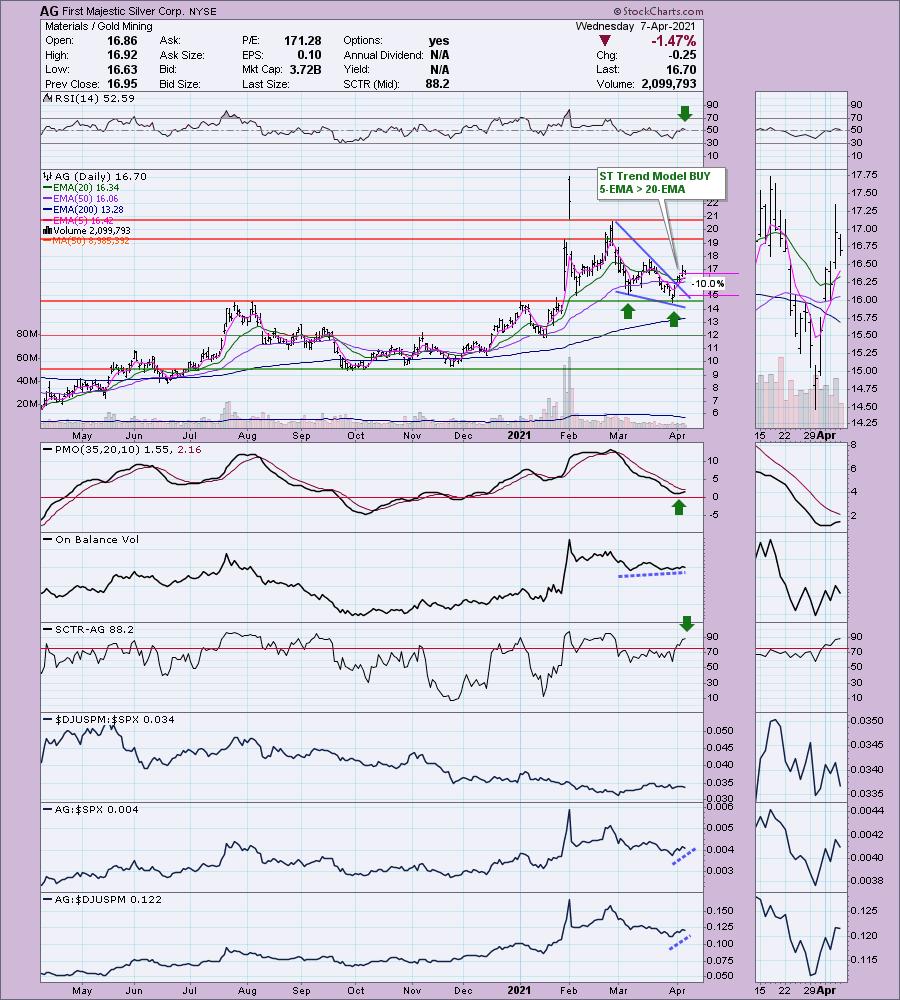
AG is up +0.48% in after hours trading. When I examine my scan results, I use the "CandleGlance" view which doesn't include the sector and industry group. It makes me focus on the chart and indicators without showing bias toward an industry or sector. I'm bullish on Gold Miners, but when I selected this chart, it was because I liked the bullish bias. Finding out it was a Gold Miner when I examined it more closely, told me that I needed to include this one, especially given today's pullback.
We have a bullish falling wedge, a double-bottom and a recent breakout. The RSI just turned positive as it moved above net neutral (50). There is a very nice positive divergence with the OBV. These divergences general precede sustained rallies. The PMO is headed toward a crossover BUY signal. The SCTR is in the "hot zone" above 75 now and the stock is outperforming the SPX and its industry group. I've set a 10% stop level that aligns with the first bottom of a double-bottom pattern.
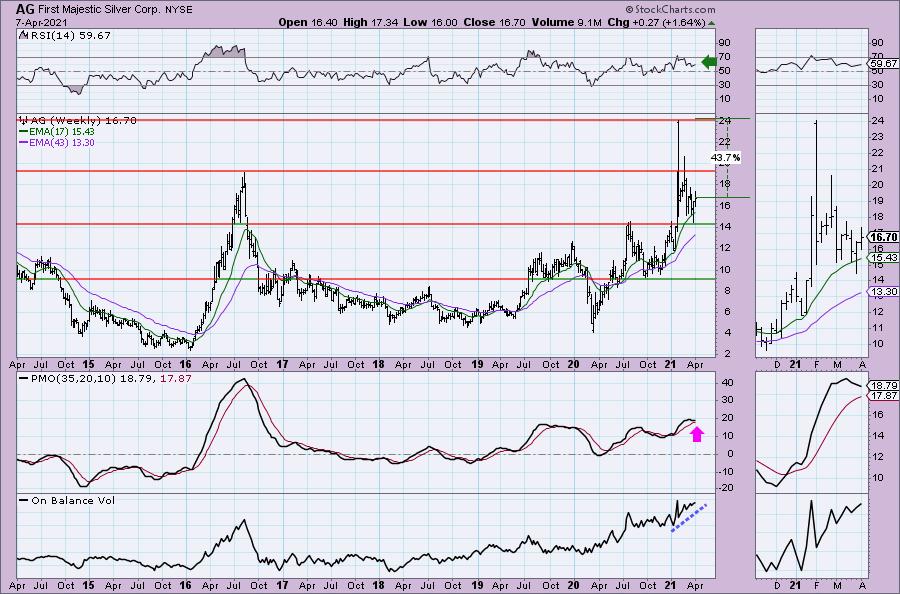
I don't like the PMO on the weekly chart, but we do have a positive RSI and a positive divergence on the OBV. Upside potential could bring price to test its 2021 intra-week high.
Liberty Media Corp. (FWONA)
EARNINGS: 5/7/2021 (BMO)
Liberty Media Corp. Liberty SiriusXM operates as a holding company which provides satellite radio services. The company is headquartered in the United States.
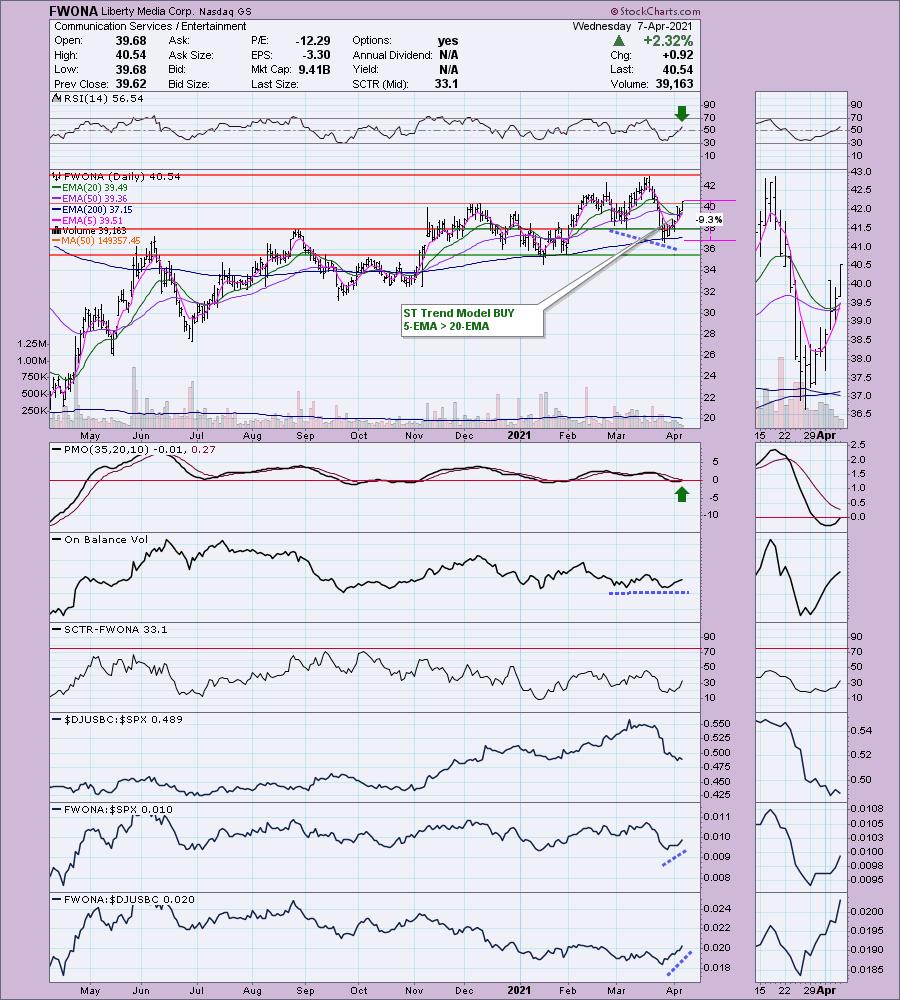
FWONA is unchanged in after hours trading. The RSI has just turned positive and the PMO is nearly back above the zero line as it goes in for a near-term oversold BUY signal. Comm Services (XLC) has been heating up and is breaking out to new all-time highs. There is slight positive divergence with the OBV bottoms. We have that ST Trend Model BUY signal that triggered today and it is outperforming the SPX and its industry group. The stop is set below the 200-EMA. You could tighten it to $38 if you prefer.
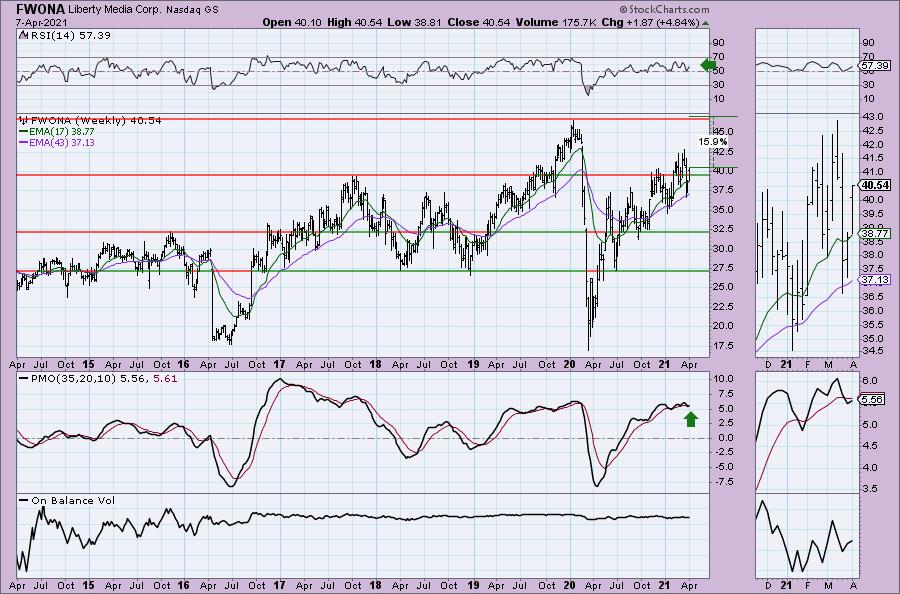
The weekly chart looks encouraging. The PMO is on a SELL signal, but it has already turned up and should be back on a weekly BUY signal soon. The weekly RSI has remained in positive territory since it came out of the bear market.
Turtle Beach Corp. (HEAR)
EARNINGS: 5/4/2021 (AMC)
Turtle Beach Corp. engages in the development, commercialization, and marketing of audio peripherals. The company was founded by Elwood G. Norris and James A. Barnes in 1975 and is headquartered in San Diego, CA.
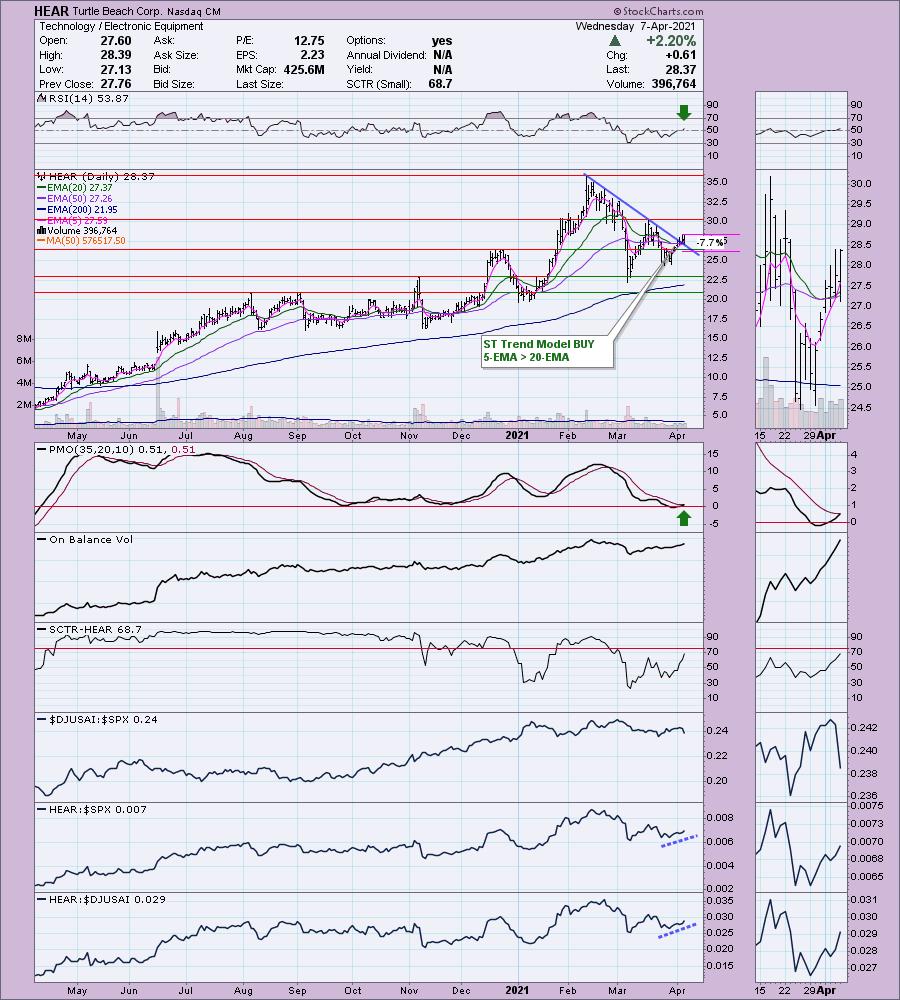
HEAR is down -0.60% in after hours trading. After today's strong rally it isn't a surprise it is down. the chart looks great. The RSI just moved into positive territory. We have a breakout from a declining trend. There is a ST Trend Model BUY signal and the PMO nearly generated a crossover BUY signal as well. The OBV is rising and HEAR is outperforming the SPX and the Electronic Equipment industry group. I set the stop just under the December price top.
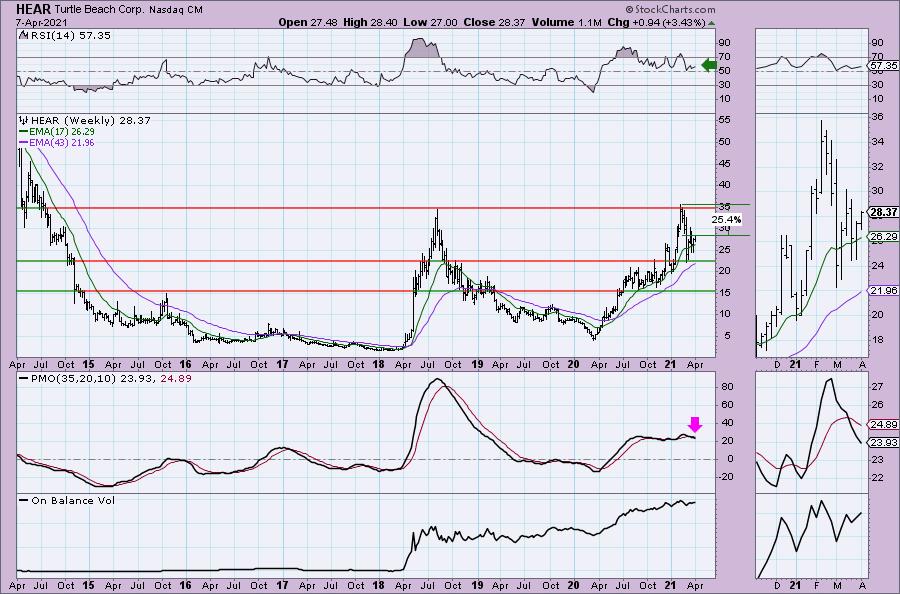
The weekly PMO doesn't look that good, but it is not overbought, so if this stock begins moving higher, there is plenty of territory for the PMO to rise into. Upside potential is great, but we can see on the left side of the chart, this stock has traded much higher.
Don't forget, on Thursdays I look at reader-requested symbols, so shoot me an email at erin@decisionpoint.com. I read every email I receive and try to answer them all!
Laredo Petroleum Holdings, Inc. (LPI)
EARNINGS: 5/5/2021 (AMC)
Laredo Petroleum, Inc. engages in the exploration, development and acquisition of oil and natural gas properties. It operates in the Permian Basin in West Texas. The company was founded by Randy A. Foutch in October 2006 and is headquartered in Tulsa, OK.
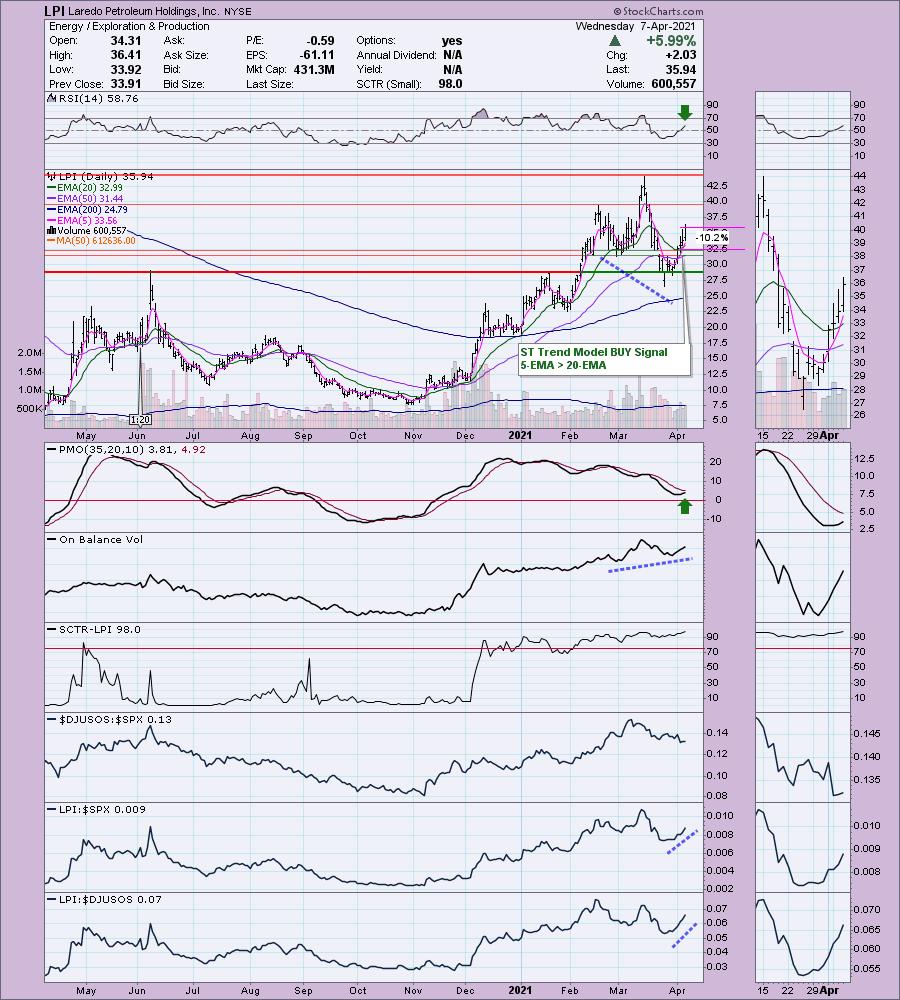
LPI is up +0.19% in after hours trading. The RSI is positive and not overbought. The PMO turned up before moving below the zero line. There is a strong positive divergence on the OBV. There was a new ST Trend Model BUY signal today and currently it is outperforming its industry group and the SPX. The group itself does look weak performance-wise, but given LPI is outperforming the SPX, that's okay. The stop is deep and honestly could be set a little bit deeper, below gap support if that suits your risk appetite.
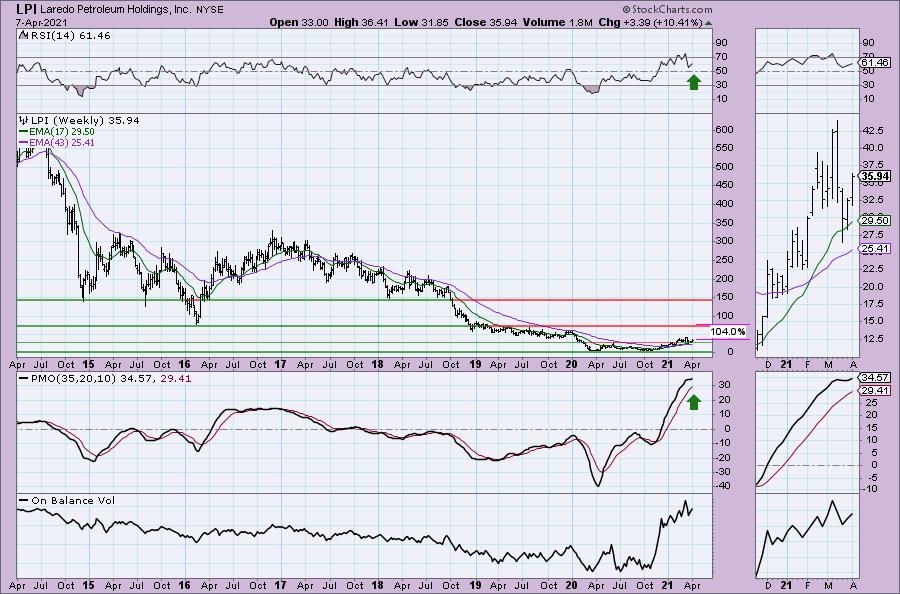
The weekly RSI is positive and the PMO just set a bottom above the signal line which is especially bullish. Upside potential is crazy good.
Full Disclosure: I'm about 65% invested and 35% is in 'cash', meaning in money markets and readily available to trade with. I added the following Diamonds: COPX and PPLT. Next on my agenda is a Gold Miner.
Current Market Outlook:
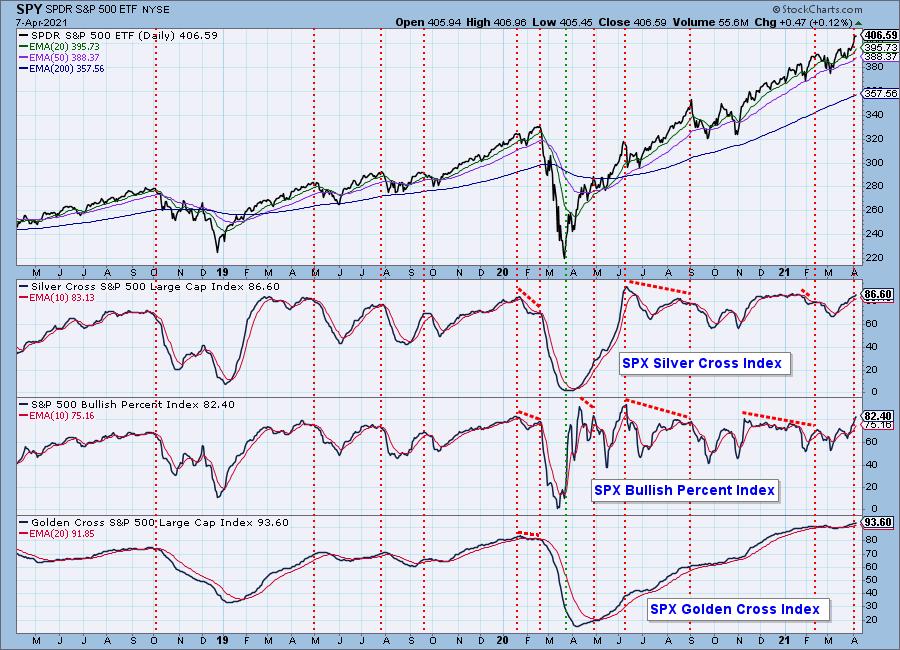
Market Environment: It is important to consider the odds for success by assessing the market tides. The following chart uses different methodologies for objectively showing the depth and trend of participation for intermediate- and long-term time frames.
- The Silver Cross Index (SCI) shows the percentage of SPX stocks on IT Trend Model BUY signals (20-EMA > 50-EMA)
- The Golden Cross Index (GCI) shows the percentage of SPX stocks on LT Trend Model BUY signals (50-EMA > 200-EMA)
- The Bullish Percent Index (BPI) shows the percentage of SPX stocks on Point & Figure BUY signals.
Don't forget that as a "Diamonds" member, you have access to our GCI/SCI curated ChartList on DecisionPoint.com. You'll find it under "Members Only" links on the left side on the Blogs and Links Page.
Here is the current chart:
Diamond Index:
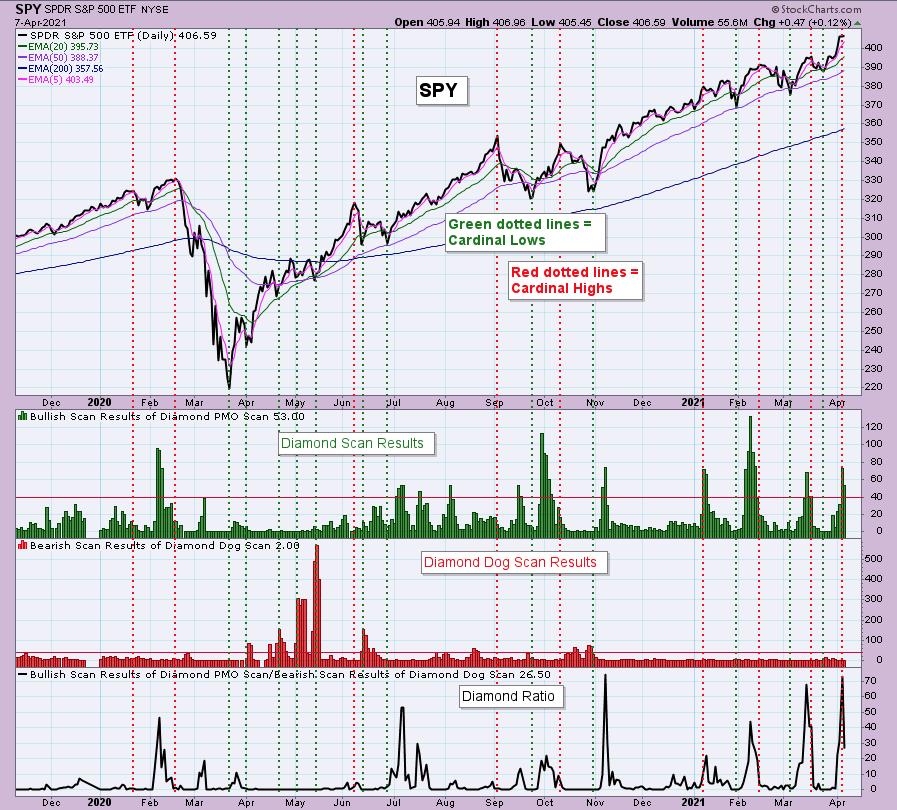
The Diamond Index chart looks at the number of scan results from my bullish Diamond PMO Scan and the number of scan results from the inverse Diamond Dog Scan. The Diamond Ratio divides the bullish results by the bearish results.
I only have data going back to October 2019 so I won't make any sweeping conclusions about the Diamond Index chart. I have marked cardinal tops with red dotted vertical lines and cardinal price bottoms with green dotted vertical lines. I believe that when the Diamond Dog results spike, it usually comes at a price bottom, or marks a strong continuation of the rising trend.
Unfortunately, the Diamond PMO Scan result numbers aren't providing much insight. The Diamond Ratio has promise, but again I don't see a clear correlation to the market tops/bottoms right now. I need to study and manipulate the data some more. Keep you posted!
Technical Analysis is a windsock, not a crystal ball.
Happy Charting!
- Erin
erin@decisionpoint.com
Watch the latest episode of DecisionPoint with Carl & Erin Swenlin on Mondays 7:00p EST or on the DecisionPoint playlist on the StockCharts TV YouTube channel here!
NOTE: The stocks reported herein are from mechanical trading model scans that are based upon moving average relationships, momentum and volume. DecisionPoint analysis is then applied to get five selections from the scans. The selections given should prompt readers to do a chart review using their own analysis process. This letter is not a call for a specific action to buy, sell or short any of the stocks provided. There are NO sure things or guaranteed returns on the daily selection of "diamonds in the rough."
Helpful DecisionPoint Links:
DecisionPoint Shared ChartList and DecisionPoint Chart Gallery
Price Momentum Oscillator (PMO)
Swenlin Trading Oscillators (STO-B and STO-V)
For more links, go to DecisionPoint.com!
