
For two days now my "Diamond PMO Scan" has returned zero results. This scan is available in the article linked here and at the end of all of my blog articles. This is a somewhat conservative scan as it requires rising momentum for at least three days as well as a perfect EMA configuration (20-EMA > 50-EMA > 200-EMA). I scan the universe of stocks $10 and above. So think about that, no results on that scan for two days. The market may be rising right now, but the internals are very very weak.
Consequently I had to use one of my other scans for today's "Diamonds in the Rough". This happens frequently as sometimes I don't like the Diamond Scan results. Today I got all four stocks from my PMO Crossover Scan. And, interestingly, three are Medical Equipment stocks. This was an area we decided on Friday to look for new "Diamonds in the Rough".
Don't forget! TOMORROW I'll be making up one of the "Diamond Mine" trading rooms that I'll miss over my vacation--same time, same bat channel. The registration information is below.
Finally, I WILL be doing Reader Requests again this Thursday so send them over! Many of you request symbols during the trading rooms, send them my way for the Thursday reports!
Today's "Diamonds in the Rough" are: NUVA, RBA, TCMD and ZBH.
Stocks/ETFs to Review (no order): CPA, BLDR, SUZ, CBZ, SITE, PLNT and ADSK.
** UPCOMING VACATION - June 28th to July 9th **
It's that time of year again! Last year it was a road trip to Alabama and back, this year it is a road trip to Utah and back! We plan on dropping in Las Vegas, Zion, Spanish Fork, Bryce Canyon, back to the Grand Canyon, Bull Head City and finally back home. I'll include my travel diary and pictures just like last year for Diamonds readers!
I plan on writing, but trading rooms will be postponed until I return home. Diamond Report publishing will vary depending on travel and activities, but you WILL get your 10 "Diamonds in the Rough" per week.
 Diamond Mine Information:
RECORDING LINK:
Topic: DecisionPoint Diamond Mine (06/18/2021) LIVE Trading Room
Start Time : Jun 18, 2021 08:59 AM
6/18 Diamond Mine Recording Link.
Access Passcode: June-18th
REGISTRATION FOR TOMORROW'S Diamond Mine:
When: Jun 23, 2021 09:00 AM Pacific Time (US and Canada)
Topic: BONUS DecisionPoint Diamond Mine Wednesday (6/23)
Register in advance for Wednesday's Diamond Mine webinar HERE.
REGISTRATION FOR FRIDAY Diamond Mine:
When: Jun 25, 2021 09:00 AM Pacific Time (US and Canada)
Topic: DecisionPoint Diamond Mine (6/25) LIVE Trading Room
Register in advance for FRIDAY's webinar HERE
Save the registration confirmation email with login instructions in case Zoom doesn't notify you in time.
Free DP Trading Room RECORDING LINK:
Topic: DecisionPoint Trading Room
Start Time : Jun 14, 2021 09:00 AM
Free DP Trading Room Recording LINK.
Access Passcode: June/14th
For best results, copy and paste the access code to avoid typos.
Welcome to DecisionPoint Daily Diamonds, wherein I highlight five "Diamonds in the Rough." These are selected from the results of my DecisionPoint scans, which search for stocks that could benefit from the trend and condition of the market. Remember, these are not recommendations to buy or sell, but are the most interesting of the stocks that surfaced in my scans. My objective is to save you the work of the initial, tedious culling process, but you need to apply your own analysis to see if these stocks pique your interest as well. There are no guaranteed winners here!
NuVasive, Inc. (NUVA)
EARNINGS: 8/4/2021 (AMC)
NuVasive, Inc. engages in the development, manufacture, sale, and provision of procedural solutions for spine surgery. It offers a comprehensive portfolio of procedurally integrated spine surgery solutions, including surgical access instruments, spinal implants, fixation systems, biologics, and enabling technologies, as well as systems and services for intraoperative neuromonitoring. The company was founded by Alexis V. Lukianov on July 21, 1997 and is headquartered in San Diego, CA.
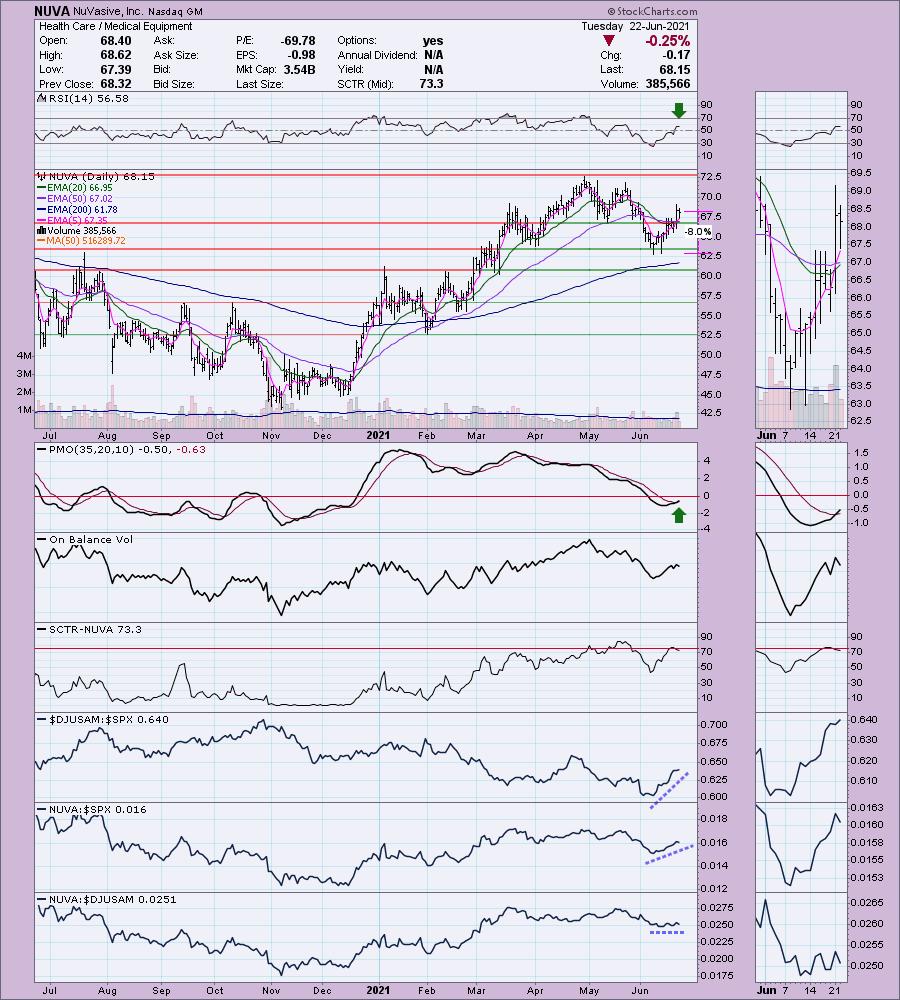
NUVA is unchanged in after hours trading. I covered NUVA in the February 18th 2020 Diamonds Report. Given the pick came in right before the bear market, it wasn't surprising that the stop was immediately hit. This industry group was just beginning to outperform when we looked at last Friday and now it is really outperforming the SPX. NUVA is outperforming the SPX as well, but it is only doing about as well as the group in total. That works for me if it is outperforming the SPX. The RSI is positive and not overbought. As with all of today's selections it just triggered a PMO crossover BUY signal. The OBV is confirming the rally with rising bottoms. The SCTR did just pop below 75, but a 73.3 ranking is still very good. The stop is set at support at the June lows.
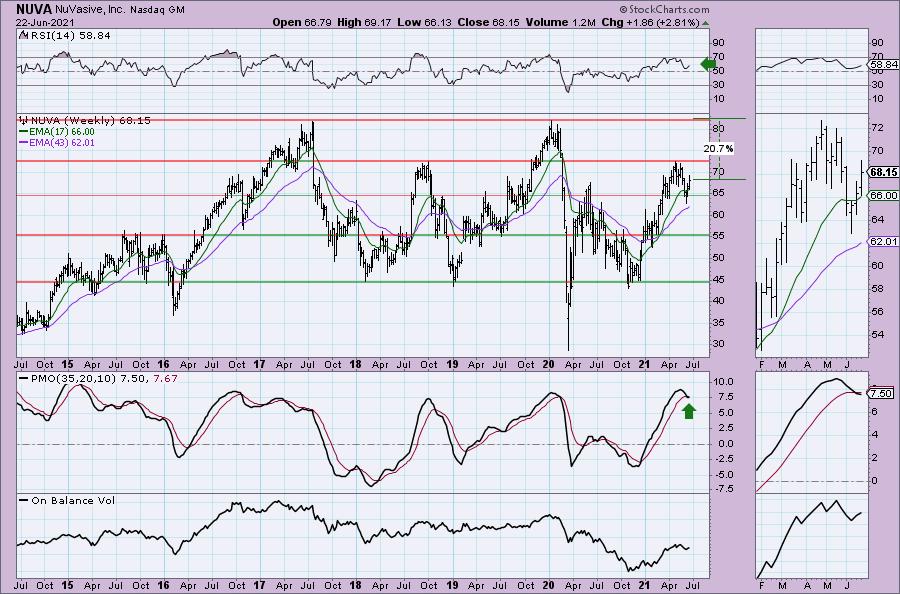
The weekly RSI is positive and has been this entire year. The weekly PMO did just trigger a crossover SELL signal, but it is already flattening out in anticipation of higher prices. A trip to all-time highs would be a 20%+ gain.
Ritchie Bros Auctioneers (RBA)
EARNINGS: 8/5/2021 (AMC)
Ritchie Bros. Auctioneers, Inc. is an industrial auctioneer, which engages in the sale of equipment to on-site and online bidders. It operates through the following segments: Auctions and Marketplaces, Ritchie Bros. Financial Services and Mascus. The Auctions and Marketplaces segment consists of live on site auctions, online auctions and marketplaces, and brokerage service. The Ritchie Bros. Financial Services segment refers to the financial brokerage service. The Mascus segment includes online listing service. The company was founded by David Edward Ritchie in 1958 and is headquartered in Burnaby, Canada.
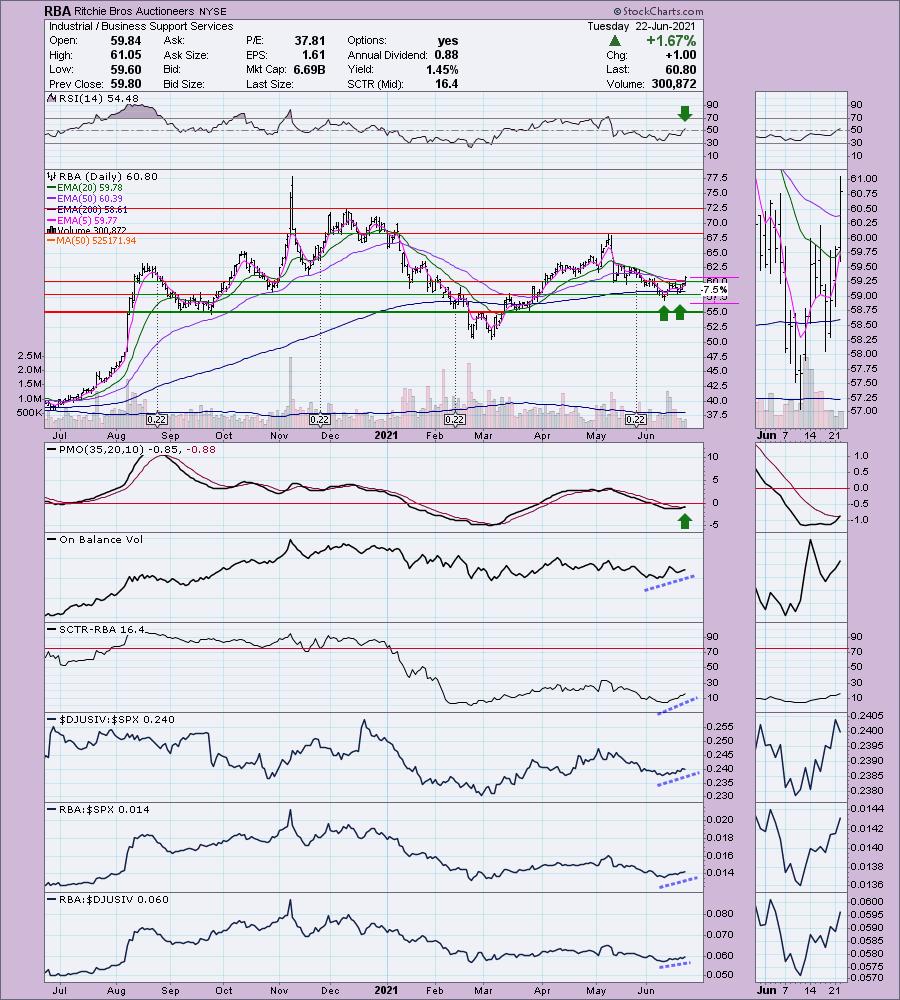
RBA is unchanged in after hours trading. While I'm not a fan of Industrials right now, this chart and industry group are showing outperformance against the SPX. Additionally, RBA is outperforming its industry group. The RSI just entered positive territory and the PMO has a new crossover BUY signal. I spotted a very small double-bottom pattern that executed with today's breakout. The minimum upside target isn't much to write home about (approx. $62.75), but remember it is a "minimum" upside target. The OBV is rising and price has broken above both the 20/50-EMAs. Additionally, the 5-EMA is about to have a positive crossover the 20-EMA which would give us a ST Trend Model BUY signal. The stop is set at the first bottom in the pattern.
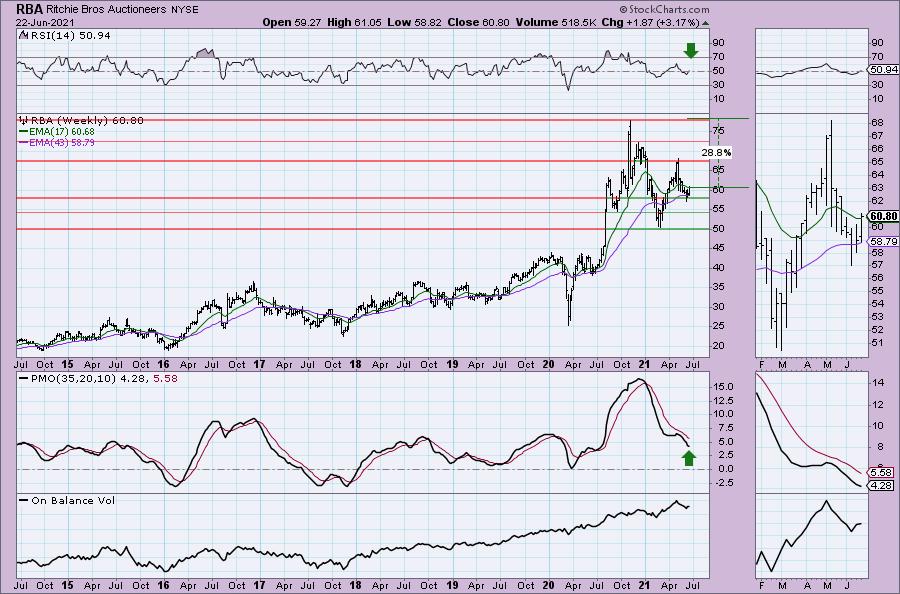
The weekly RSI just hit positive territory again. Price is bouncing off the 43-week EMA and today closed above the 17-week EMA. Be careful though, we could be looking at a large bearish double-top. You'll want to babysit this one closely.
Tactile Systems Technology Inc. (TCMD)
EARNINGS: 8/2/2021 (AMC)
Tactile Systems Technology, Inc. is a medical technology company. It develops and provides innovative medical devices for the treatment of chronic diseases at home. The company focus on advancing the standard of care in treating chronic diseases in the home setting to improve patient outcomes and quality of life and help control rising healthcare expenditures. It possesses a platform to deliver at-home healthcare solutions throughout the United States. Tactile Systems Technology was founded on January 30, 1995 and is headquartered in Minneapolis, MN.
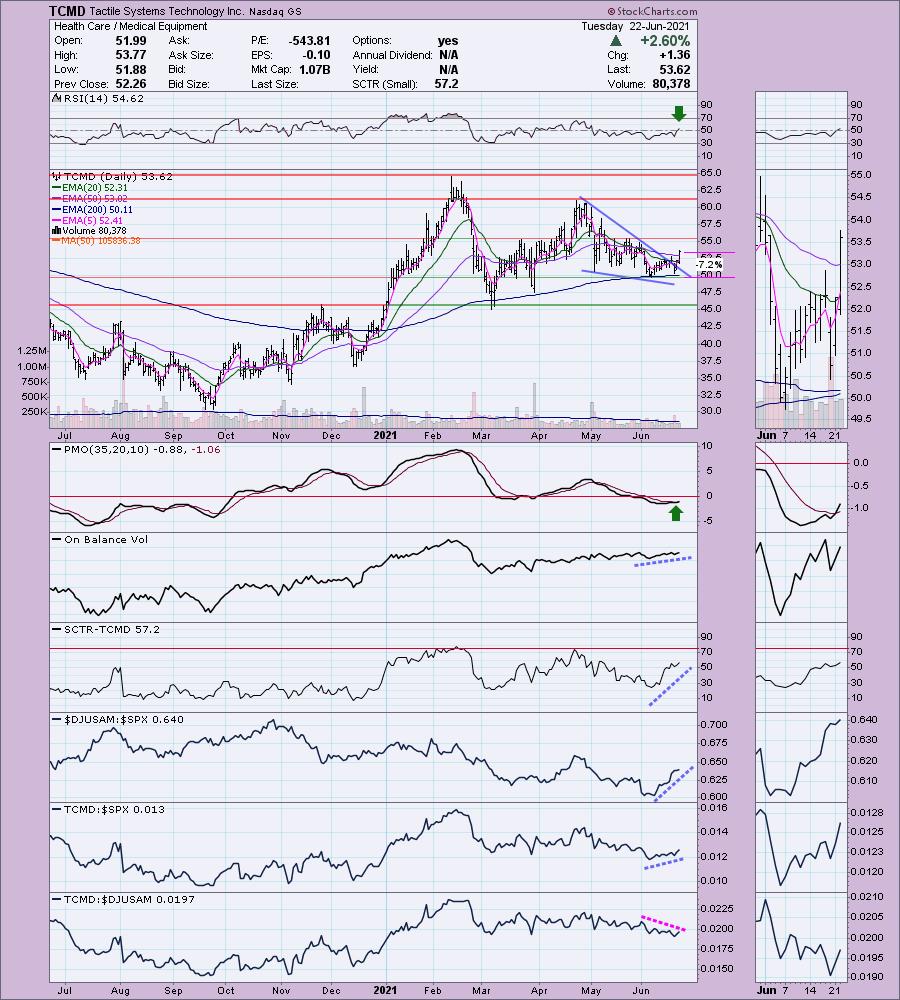
TCMD is unchanged in after hours trading. Price just broke out of a bullish falling wedge. Additionally, today it broke out above its 50-EMA. I also note we have a new ST Trend Model BUY signal on today's 5/20-EMA positive crossover. The RSI just moved into positive territory and it is in a strong industry group. The PMO had a positive crossover today and is in oversold territory. The OBV is confirming this new rally. My one beef with TCMD is that it isn't outperforming its industry group. I'll forgive it only because it is outperforming the SPX. If this breakout turns into a strong rally, it will likely start outperforming the group again. The stop is below obvious support and is only 7.2%.
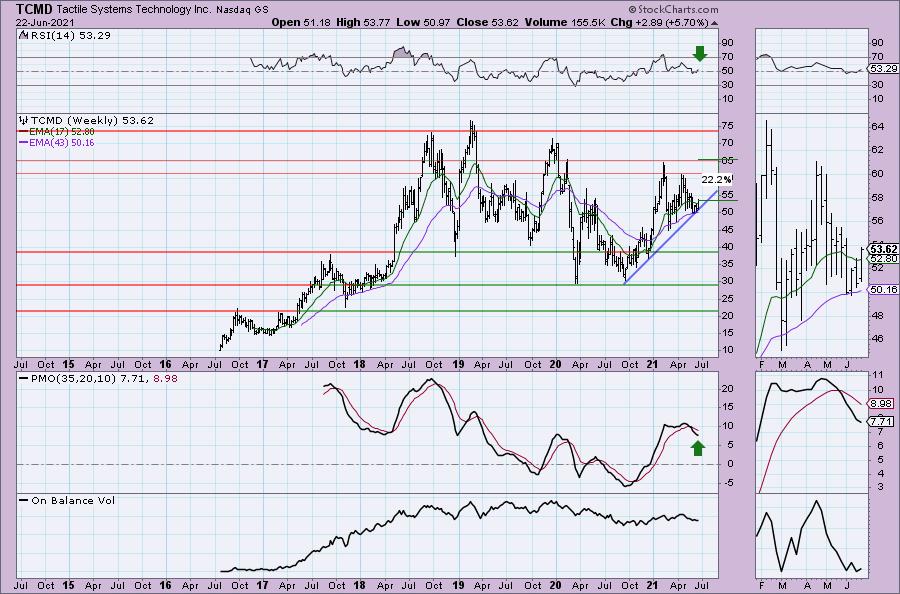
The weekly chart shows that price is maintaining the long-term rising trend and price just bounced off the 43-week EMA. The weekly PMO isn't great, but it is at least decelerating its decline.
Zimmer Biomet Holdings, Inc. (ZBH)
EARNINGS: 8/3/2021 (BMO)
Zimmer Biomet Holdings, Inc. provides musculoskeletal healthcare services. It operates through the following segments: Americas and Global Businesses, EMEA, and Asia Pacific. The Americas and Global Businesses segment consists of U.S. and includes other North, Central and South American markets for all product categories as well as the global results for the Dental products division. The EMEA segment focuses in Europe and includes the Middle East and African markets for all product categories except Dental. The Asia Pacific segment comprises of Japan, China and Australia and includes other Asian and Pacific markets for all product categories except Dental. The company was founded by Justin O. Zimmer in 1927 and is headquartered in Warsaw, IN.
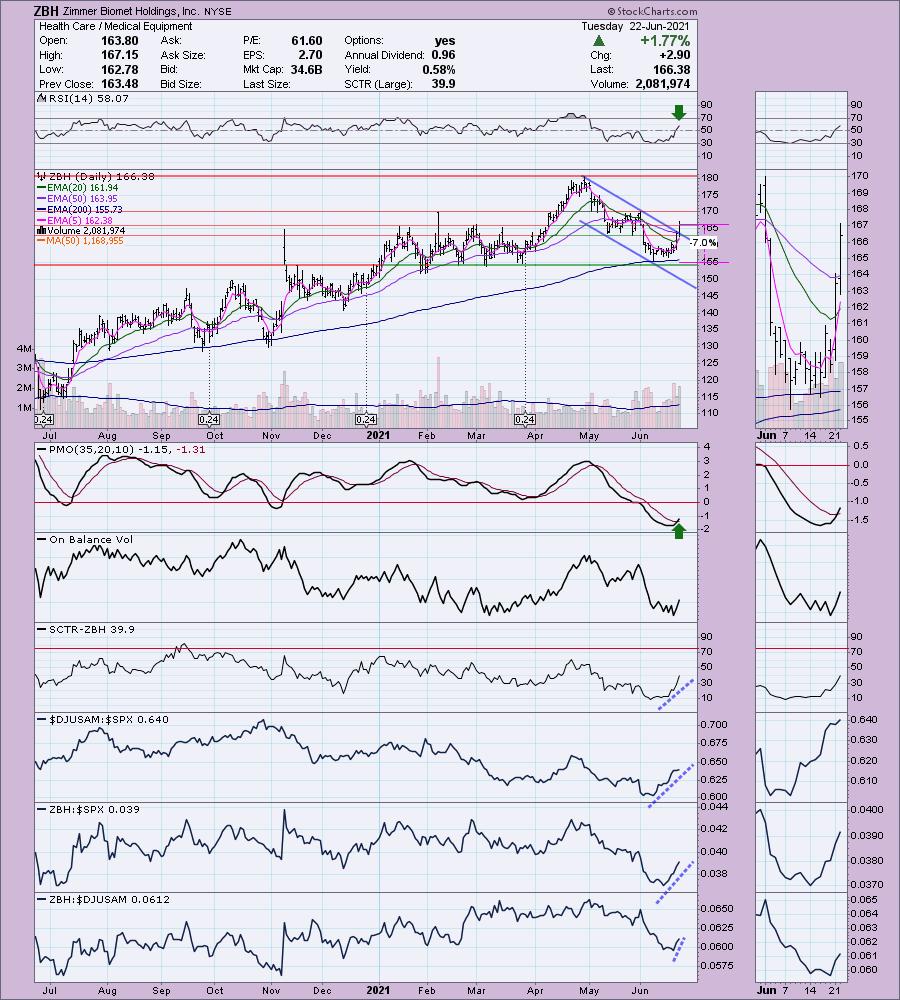
ZBH is down -0.02% in after hours trading. Yesterday it broke above the 20-EMA and today it followed that up with a breakout above the 50-EMA. There is a ST Trend Model BUY signal on the positive 5/20-EMA crossover. Additionally, price broke out from its declining trend channel. The RSI just hit positive territory and there is a new PMO BUY signal. I would like to have seen rising OBV bottoms, but we do see that ZBH is outperforming and has a SCTR rising strongly. The stop can be set at only 7% to line up just below the 200-EMA.
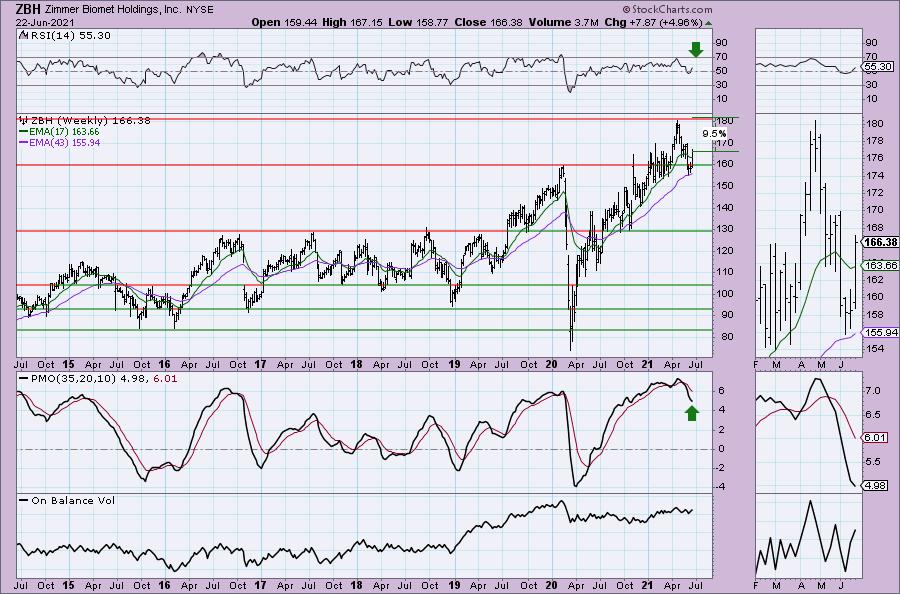
Price just bounced off the 43-week EMA. The RSI is reentering positive territory. The PMO isn't optimal, but it is decelerating somewhat. It is less than 10% below all-time highs, but I expect it to breakout and set new all-time highs.
Don't forget, on Thursdays I look at reader-requested symbols, so shoot me an email at erin@decisionpoint.com. I read every email I receive and try to answer them all!
Current Market Outlook:
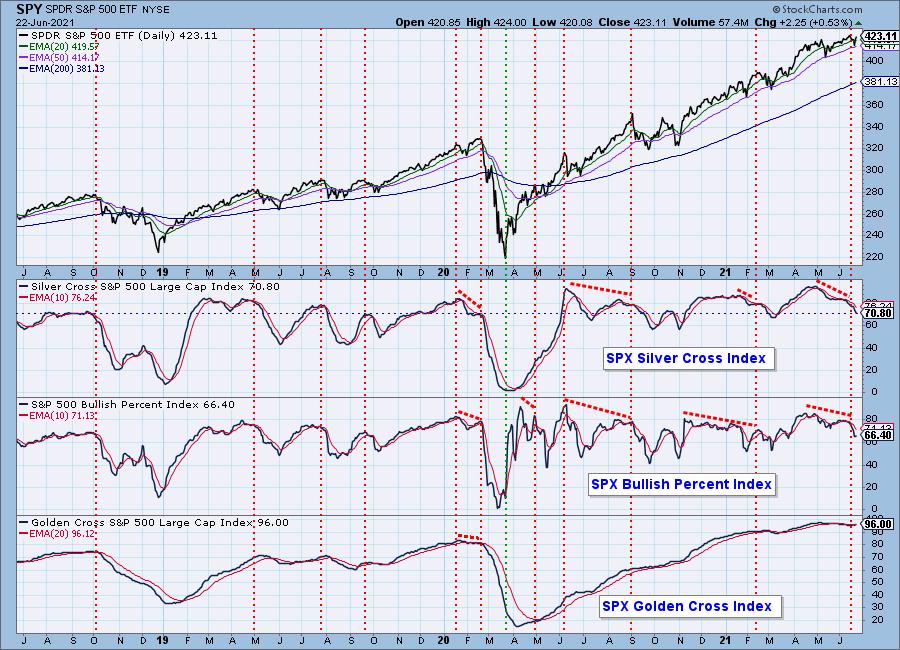
Market Environment: It is important to consider the odds for success by assessing the market tides. The following chart uses different methodologies for objectively showing the depth and trend of participation for intermediate- and long-term time frames.
- The Silver Cross Index (SCI) shows the percentage of SPX stocks on IT Trend Model BUY signals (20-EMA > 50-EMA)
- The Golden Cross Index (GCI) shows the percentage of SPX stocks on LT Trend Model BUY signals (50-EMA > 200-EMA)
- The Bullish Percent Index (BPI) shows the percentage of SPX stocks on Point & Figure BUY signals.
Don't forget that as a "Diamonds" member, you have access to our GCI/SCI curated ChartList on DecisionPoint.com. You'll find it under "Members Only" links on the left side on the Blogs and Links Page.
Here is the current chart:
Diamond Index:
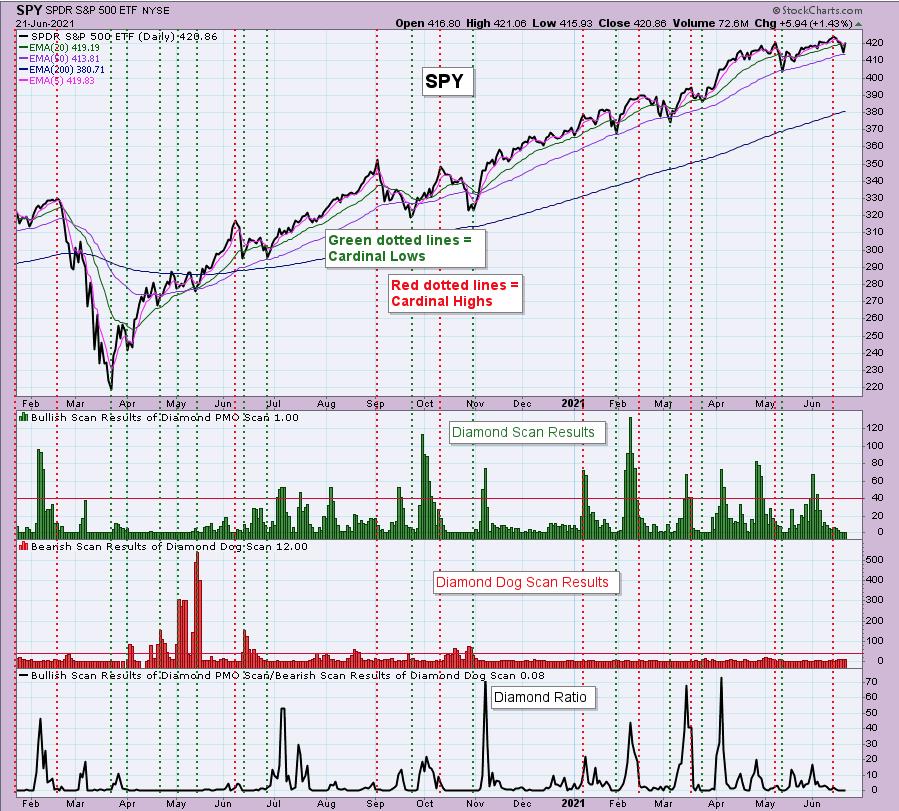
The Diamond Index chart looks at the number of scan results from my bullish Diamond PMO Scan and the number of scan results from the inverse Diamond Dog Scan. The Diamond Ratio divides the bullish results by the bearish results.
I only have data going back to October 2019 so I won't make any sweeping conclusions about the Diamond Index chart. I have marked cardinal tops with red dotted vertical lines and cardinal price bottoms with green dotted vertical lines. I believe that when the Diamond Dog results spike, it usually comes at a price bottom, or marks a strong continuation of the rising trend.
Unfortunately, the Diamond PMO Scan result numbers aren't providing much insight. The Diamond Ratio has promise, but again I don't see a clear correlation to the market tops/bottoms right now. I need to study and manipulate the data some more. Keep you posted!
Full Disclosure: I'm about 50% invested and 50% is in 'cash', meaning in money markets and readily available to trade with.
Technical Analysis is a windsock, not a crystal ball.
Happy Charting!
- Erin
erin@decisionpoint.com
Watch the latest episode of DecisionPoint with Carl & Erin Swenlin on Mondays 7:00p EST or on the DecisionPoint playlist on the StockCharts TV YouTube channel here!
NOTE: The stocks reported herein are from mechanical trading model scans that are based upon moving average relationships, momentum and volume. DecisionPoint analysis is then applied to get five selections from the scans. The selections given should prompt readers to do a chart review using their own analysis process. This letter is not a call for a specific action to buy, sell or short any of the stocks provided. There are NO sure things or guaranteed returns on the daily selection of "Diamonds in the Rough."
Helpful DecisionPoint Links:
DecisionPoint Shared ChartList and DecisionPoint Chart Gallery
Price Momentum Oscillator (PMO)
Swenlin Trading Oscillators (STO-B and STO-V)
For more links, go to DecisionPoint.com