
With the Energy, Financial and Real Estate sectors outperforming, I decided to tweak one of my scans to also search for stocks with yields greater than 2%. I found some very interesting choices with yields of 3% or more. Not only do they have dividends and yields, these stocks are breaking out too!
I decided to set a trailing stop on QFIN and hard stops on my cannabis stocks. The cannabis stocks are difficult to use trailing stops on simply because they are so volatile during the trading day. I have my line in the sand stops in place though.
Today's "Diamonds in the Rough" are: ARES, DCP, VIRT and VNO.
Stocks/ETFs to Review (no order): CNQ, PSXP, PSX, SIRI and TLRY.
 Diamond Mine REGISTRATION Information:
When: Jun 4, 2021 09:00 AM Pacific Time (US and Canada)
Topic: DecisionPoint Diamond Mine LIVE Trading Room
Register in advance for this webinar HERE.
After registering, you will receive a confirmation email containing information about joining the webinar, including the password. SAVE IT! Zoom doesn't always send out the reminders.
=======================================================================
Diamond Mine RECORDING Link:
Topic: DecisionPoint Diamond Mine LIVE Trading Room
Start Time : May 28, 2021 09:01 AM
Meeting Recording Link.
Access Passcode: May-28th
***Click here to register for this recurring free DecisionPoint Trading Room on Mondays at Noon ET!***
+++++++++++++++++++++++++++++++++++++++++++++++++++++++++++++++++++++++++++++++
Free DP Trading Room RECORDING LINK:
Topic: DecisionPoint Trading Room
Start Time : May 31, 2021 09:00 AM PT
Meeting Recording Link HERE.
Access Passcode: May-31st
For best results, copy and paste the access code to avoid typos.
Welcome to DecisionPoint Daily Diamonds, wherein I highlight five "diamonds in the rough." These are selected from the results of my DecisionPoint scans, which search for stocks that could benefit from the trend and condition of the market. Remember, these are not recommendations to buy or sell, but are the most interesting of the stocks that surfaced in my scans. My objective is to save you the work of the initial, tedious culling process, but you need to apply your own analysis to see if these stocks pique your interest as well. There are no guaranteed winners here!
Ares Management, LP (ARES)
EARNINGS: 7/29/2021 (BMO)
Ares Management Corp. is engaged in providing investment management and consultancy services. It operates through the following segments: Credit Group, Private Equity Group and Real Estate Group. The Credit Group segment offers credit strategies across the liquid and illiquid spectrum, including syndicated bank loans, high yield bonds, credit opportunities, special situations, asset-backed investments and U.S. and European direct lending. The Credit Group provides solutions for traditional fixed income investors seeking to access the syndicated bank loan and high yield bond markets and capitalize on opportunities across traded corporate credit. It additionally provides investors access to directly originated fixed and floating rate credit assets and the ability to capitalize on illiquidity premiums across the credit spectrum. The Private Equity Group segment manages shared control investments in corporate private equity funds. The Real Estate Group segment provides debt, mortgage loans, and equity capital to borrowers, property owners, and real estate developers. The company was by founded by Michael J. Arougheti, David B. Kaplan, John H. Kissick, Antony P. Ressler, and Bennett Rosenthal in 1997 and is headquartered in Los Angeles, CA.
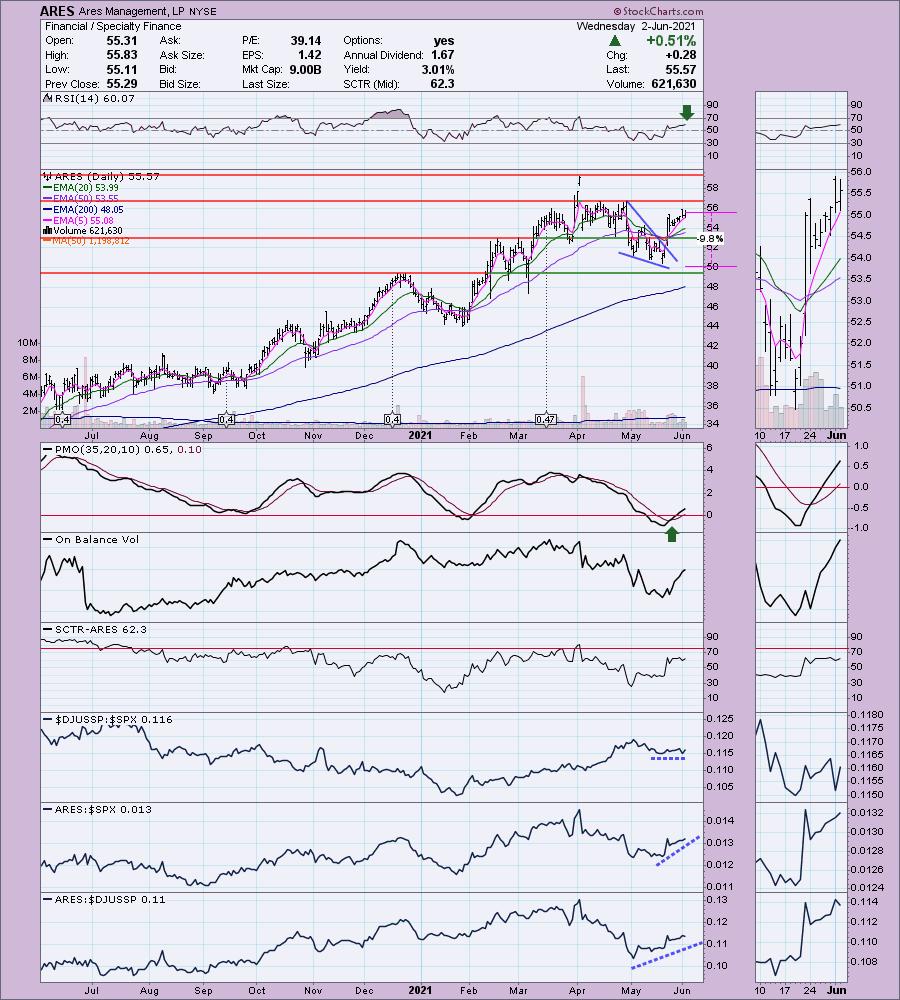
ARES in unchanged in after hours trading. ARES is on an oversold PMO crossover BUY signal and recently saw a shake-up on its EMAs that has them right where we want them, with the faster EMAs on top of the slower ones. Volume has been coming in. The RSI is positive. While the group isn't doing much against the SPX, ARES is outperforming both of them. The stop is deeper than you probably need or want, but it is set at the May low. This has a yield of 3.01% and a dividend of $1.67/yr.
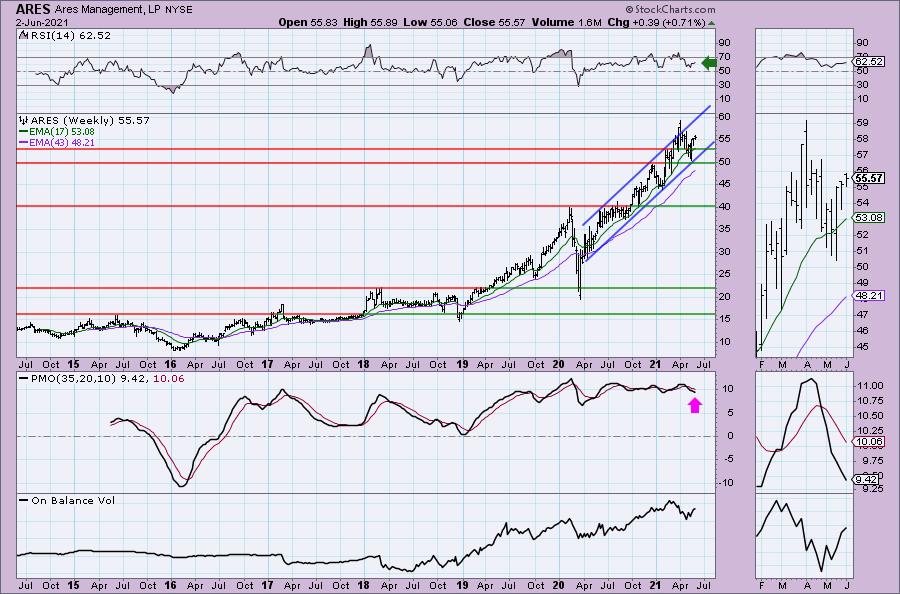
The weekly price chart shows us that ARES has been in a steep rising trend channel since the bear market low. The PMO is currently pointed the wrong way, but remember it measures acceleration and given the steady acceleration of the rising trend, it has flattened. I am looking for all-time highs to be reached soon.
DCP Midstream, LP (DCP)
EARNINGS: 8/4/2021 (AMC)
DCP Midstream LP engages in the business of gathering, compressing, treating, processing, transporting, storing and selling natural gas. It operates through the following segments: Logistics and Marketing and Gathering and Processing. The Logistics and Marketing segment includes transporting, trading, marketing and storing natural gas and NGLs and fractionating NGLs. The Gathering and Processing segment consists of gathering, compressing, treating and processing natural gas, producing and fractionating NGLs and recovering condensate. The company was founded in August 2005 and is headquartered in Denver, CO.
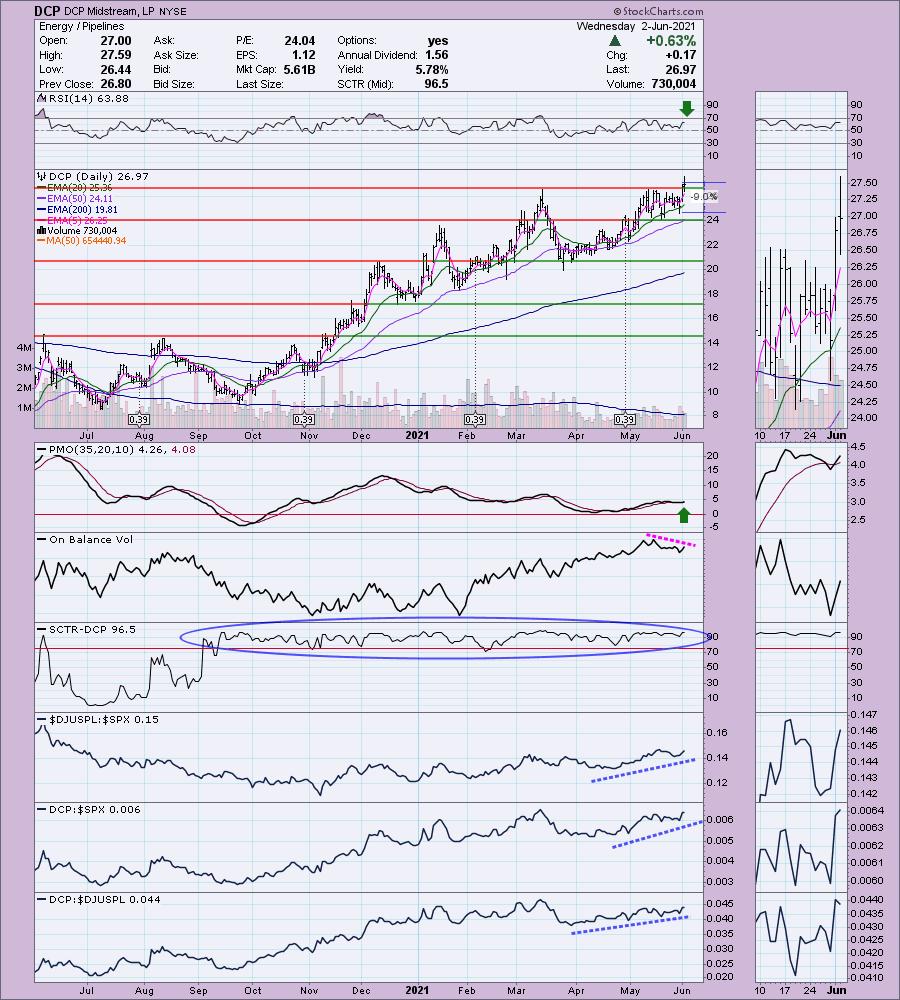
DCP is unchanged in after hours trading. I covered DCP back on April 14th 2021. Full disclosure, I do own this one. The stop was never hit, so this one is up 16.6% since I presented it. It looks ready to run higher after spending much of May in a consolidation zone. I like today's strong breakout. The PMO whipsawed back into a crossover BUY signal and the RSI is positive. There is a negative here--a negative OBV divergence with price tops. The group and DCP are clear out-performers. The SCTR also tells us that this is a strong stock among the mid-caps. Just be aware that Limited Partnerships (LPs) do require you to file a K-1 when you do your taxes. The stop is set at the late May intraday low.
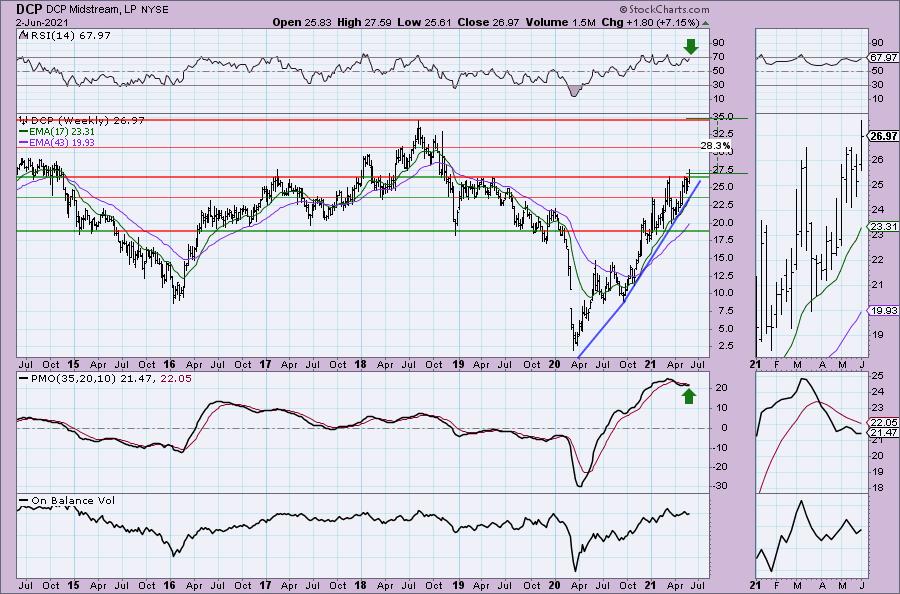
Today's move also helped DCP break above strong overhead resistance. A weekly PMO top below the signal line was concerning me, but we can see the weekly PMO is ready to turn back up. Upside potential is a cool 28% and the yield is 4.28%.
Virtu Financial, Inc. (VIRT)
EARNINGS: 8/5/2021 (BMO)
Virtu Financial, Inc. engages in the provision of market making and liquidity services. It operates through the following segments: Market Making, Execution Services and Corporate. The Market Making segment engages in buying and selling of securities and other financial instruments. The Execution Services segment agency offers trading venues that provide transparent trading in global equities, ETFs, and fixed income to institutions, banks and broker dealers. The Corporate segment consists of investments in strategic financial services-oriented opportunities and maintains corporate overhead expenses and all other income and expenses that are not attributable to the other segments. The company was founded by Vincent J. Viola and Douglas Cifu in 2008 and is headquartered in New York, NY.
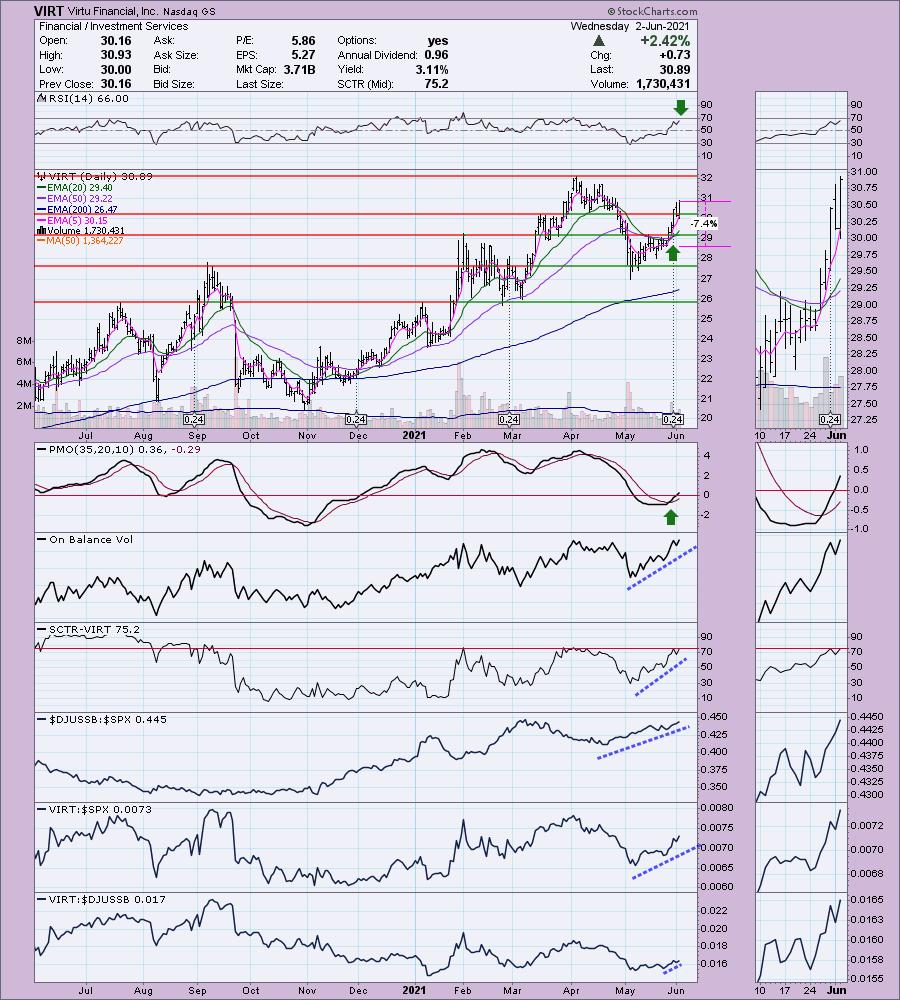
VIRT is up +0.36% in after hours trading. Price broke above resistance at the March highs and April lows. The RSI is positive. We have a recent IT Trend Model "Silver Cross" BUY signal that was generated when the 20-EMA crossed above the 50-EMA. The SCTR just entered the "hot zone" above 75. It is a clear winner against the SPX and it is beginning to outperform its industry group. The stop is manageable at 7.4%, but could be set closer to $29 if you want to line up with the first support level.
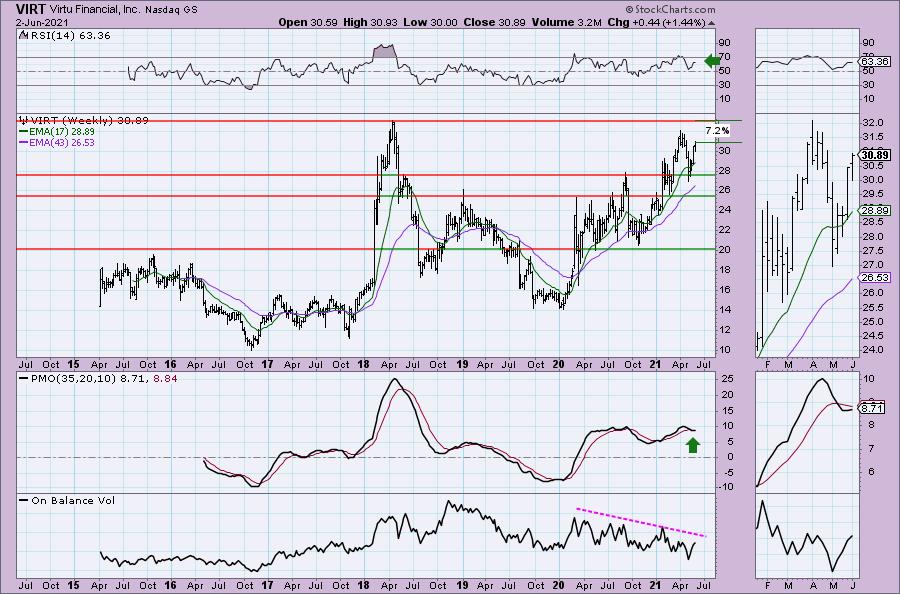
The weekly chart is shaping up nicely. The weekly PMO has turned up and the RSI is staying in positive territory. My current issue with this chart is the negative OBV divergence. All-time highs should be reached and then some.
Vornado Realty Trust (VNO)
EARNINGS: 8/2/2021 (AMC)
Vornado Realty Trust is a real estate investment trust. The company owns office, retail, merchandise mart properties and other real estate and related investments. Its office properties include various building office complexes and Bank of America Center in San Francisco. The company's retail properties include shopping centers, regional malls single tenant retail assets. Its other real estate and related investments include marketable securities and mezzanine loans or real estate. The company was founded by Steven Roth in 1980 and is headquartered in New York, NY.
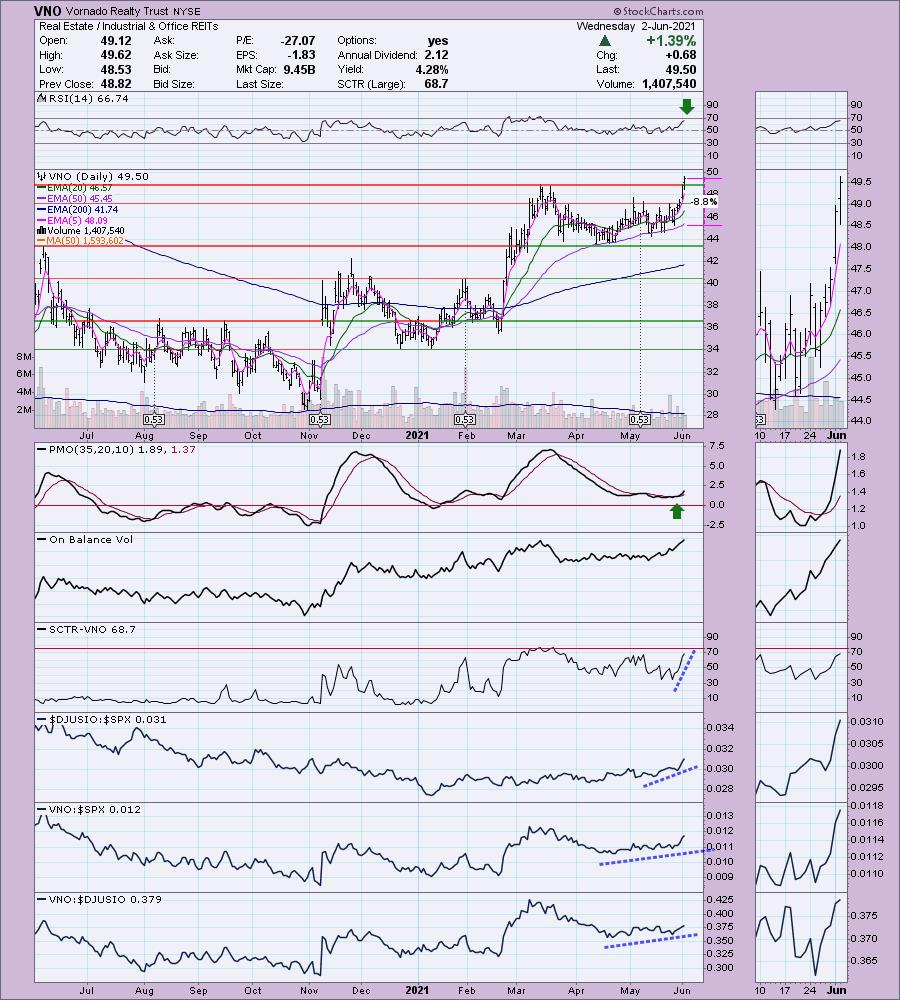
VNO is unchanged in after hours trading. While this one has a nice 4.28% yield, it should be noted that they currently have EPS at -1.83. I do like this chart though! Price just broke out. The RSI is positive and not yet overbought. The PMO is headed straight up on a BUY signal. The OBV is confirming this breakout with a breakout of its own. The SCTR is on the rise and it is a strong performer in an improving industry group. The stop is set just below the 50-EMA.
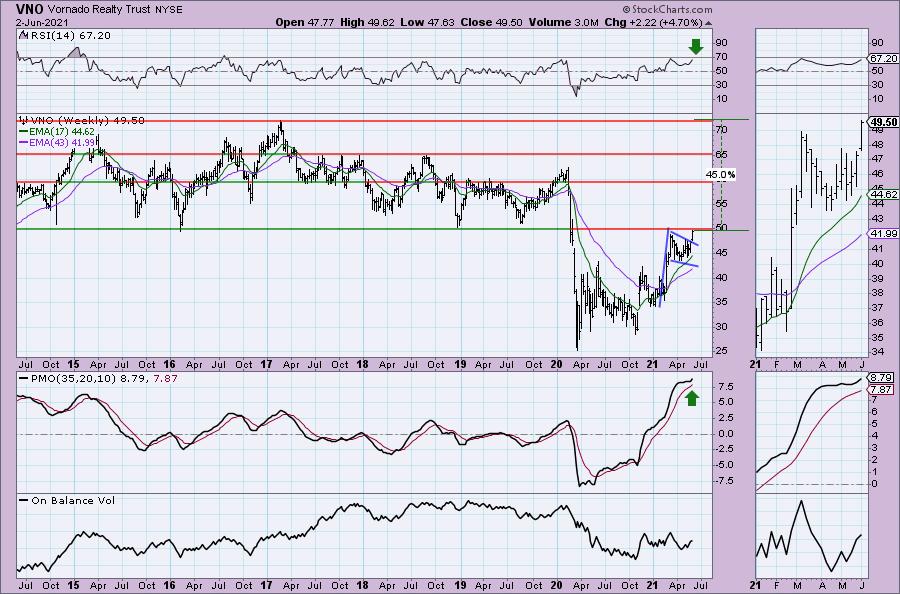
The weekly RSI is positive and not overbought. The PMO has turned up above its signal line which is especially bullish. We do have a bullish flag formation and with this breakout, it has executed the pattern. The minimum upside target of the pattern is around $65. If I had a complaint it would be the OBV which on a weekly basis isn't confirming the breakout and price does have some very strong overhead resistance to overcome.
Don't forget, on Thursdays I look at reader-requested symbols, so shoot me an email at erin@decisionpoint.com. I read every email I receive and try to answer them all!
Current Market Outlook:
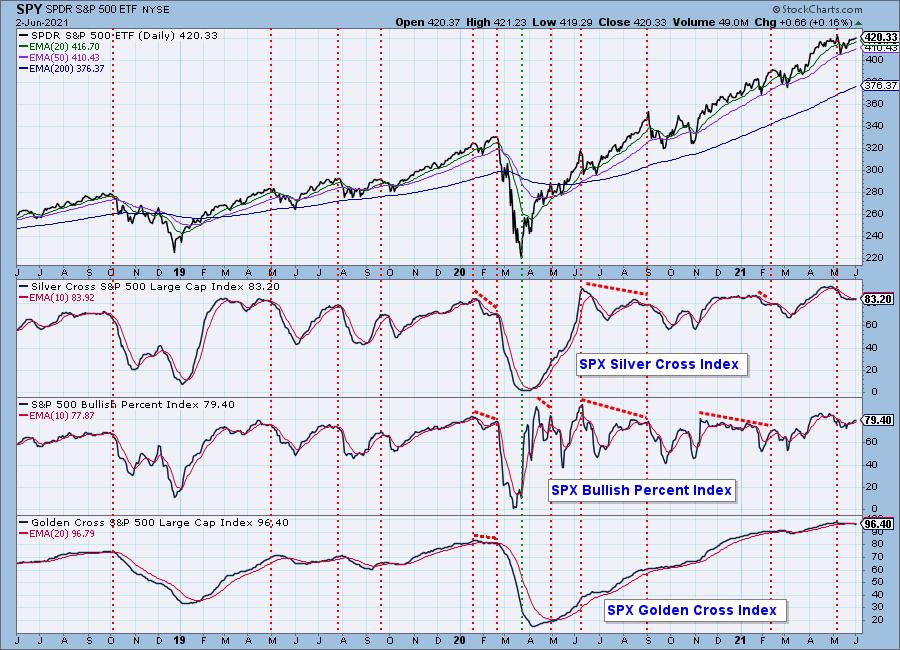
Market Environment: It is important to consider the odds for success by assessing the market tides. The following chart uses different methodologies for objectively showing the depth and trend of participation for intermediate- and long-term time frames.
- The Silver Cross Index (SCI) shows the percentage of SPX stocks on IT Trend Model BUY signals (20-EMA > 50-EMA)
- The Golden Cross Index (GCI) shows the percentage of SPX stocks on LT Trend Model BUY signals (50-EMA > 200-EMA)
- The Bullish Percent Index (BPI) shows the percentage of SPX stocks on Point & Figure BUY signals.
Don't forget that as a "Diamonds" member, you have access to our GCI/SCI curated ChartList on DecisionPoint.com. You'll find it under "Members Only" links on the left side on the Blogs and Links Page.
Here is the current chart:
Diamond Index:
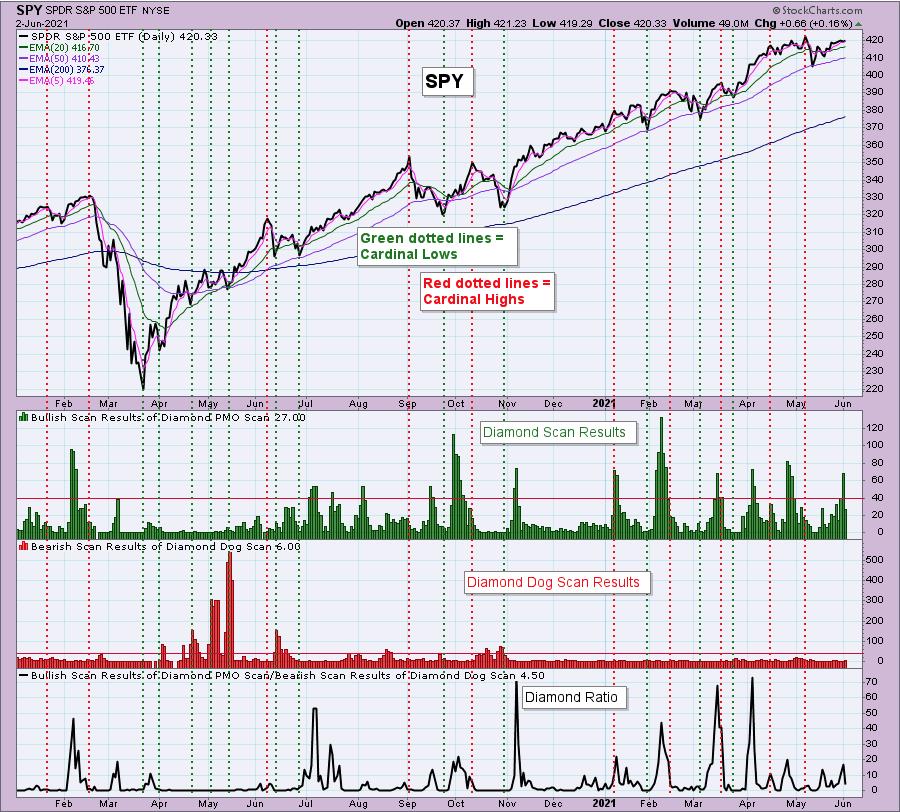
The Diamond Index chart looks at the number of scan results from my bullish Diamond PMO Scan and the number of scan results from the inverse Diamond Dog Scan. The Diamond Ratio divides the bullish results by the bearish results.
I only have data going back to October 2019 so I won't make any sweeping conclusions about the Diamond Index chart. I have marked cardinal tops with red dotted vertical lines and cardinal price bottoms with green dotted vertical lines. I believe that when the Diamond Dog results spike, it usually comes at a price bottom, or marks a strong continuation of the rising trend.
Unfortunately, the Diamond PMO Scan result numbers aren't providing much insight. The Diamond Ratio has promise, but again I don't see a clear correlation to the market tops/bottoms right now. I need to study and manipulate the data some more. Keep you posted!
Full Disclosure: I'm about 75% invested and 25% is in 'cash', meaning in money markets and readily available to trade with.
Technical Analysis is a windsock, not a crystal ball.
Happy Charting!
- Erin
erin@decisionpoint.com
Watch the latest episode of DecisionPoint with Carl & Erin Swenlin on Mondays 7:00p EST or on the DecisionPoint playlist on the StockCharts TV YouTube channel here!
NOTE: The stocks reported herein are from mechanical trading model scans that are based upon moving average relationships, momentum and volume. DecisionPoint analysis is then applied to get five selections from the scans. The selections given should prompt readers to do a chart review using their own analysis process. This letter is not a call for a specific action to buy, sell or short any of the stocks provided. There are NO sure things or guaranteed returns on the daily selection of "diamonds in the rough."
Helpful DecisionPoint Links:
DecisionPoint Shared ChartList and DecisionPoint Chart Gallery
Price Momentum Oscillator (PMO)
Swenlin Trading Oscillators (STO-B and STO-V)
For more links, go to DecisionPoint.com
