
Two of today's stocks are from industry groups we've been watching closely over the past two weeks. Of the other two, one is from the Utilities sector, the Multi-utilities industry group to be specific. The other is from the Defense group. While that group isn't doing that much, this stock is outperforming the SPX with a strong price chart.
The two groups I'm revisiting are Renewable Energy and Biotechnology. I found two that look very interesting.
I'm struggling with a headache today so my comments may be brief.
Today's "Diamonds in the Rough" are: CNP, IGMS, PLUG and POWW.
Stocks to Review ** (no order): BEEM, SUNW, LAC, MHK, PFG and ST.
** The "Stocks to Review" are stocks that were on my short list for the day.

RECORDING LINK FOR Wednesday 8/4 Bonus Diamond Mine:
Topic: DecisionPoint Make-Up Diamond Mine (8/4/2021) LIVE Trading Room
Start Time : Aug 4, 2021 09:00 AM
Meeting Recording Link HERE.
Access Passcode: August/4
RECORDING LINK Friday (8/6):
Topic: DecisionPoint Diamond Mine (8/6/2021) LIVE Trading Room
Start Time : Aug 6, 2021 08:59 AM
Meeting Recording Link HERE.
Access Passcode: August/6
REGISTRATION FOR FRIDAY 8/13 Diamond Mine:
When: Aug 13, 2021 09:00 AM Pacific Time (US and Canada)
Topic: DecisionPoint Diamond Mine (8/13/2021) LIVE Trading Room
Register in advance for this webinar HERE.
Save the registration confirmation email with login instructions in case Zoom doesn't notify you in time.

Free DP Trading Room (8/9) RECORDING LINK:
Topic: DecisionPoint Trading Room
Start Time : Aug 9, 2021 09:00 AM
Meeting Recording Link HERE.
Access Passcode: August-9th
For best results, copy and paste the access code to avoid typos.
Welcome to DecisionPoint Daily Diamonds, wherein I highlight five "Diamonds in the Rough." These are selected from the results of my DecisionPoint scans, which search for stocks that could benefit from the trend and condition of the market. Remember, these are not recommendations to buy or sell, but are the most interesting of the stocks that surfaced in my scans. My objective is to save you the work of the initial, tedious culling process, but you need to apply your own analysis to see if these stocks pique your interest as well. There are no guaranteed winners here!
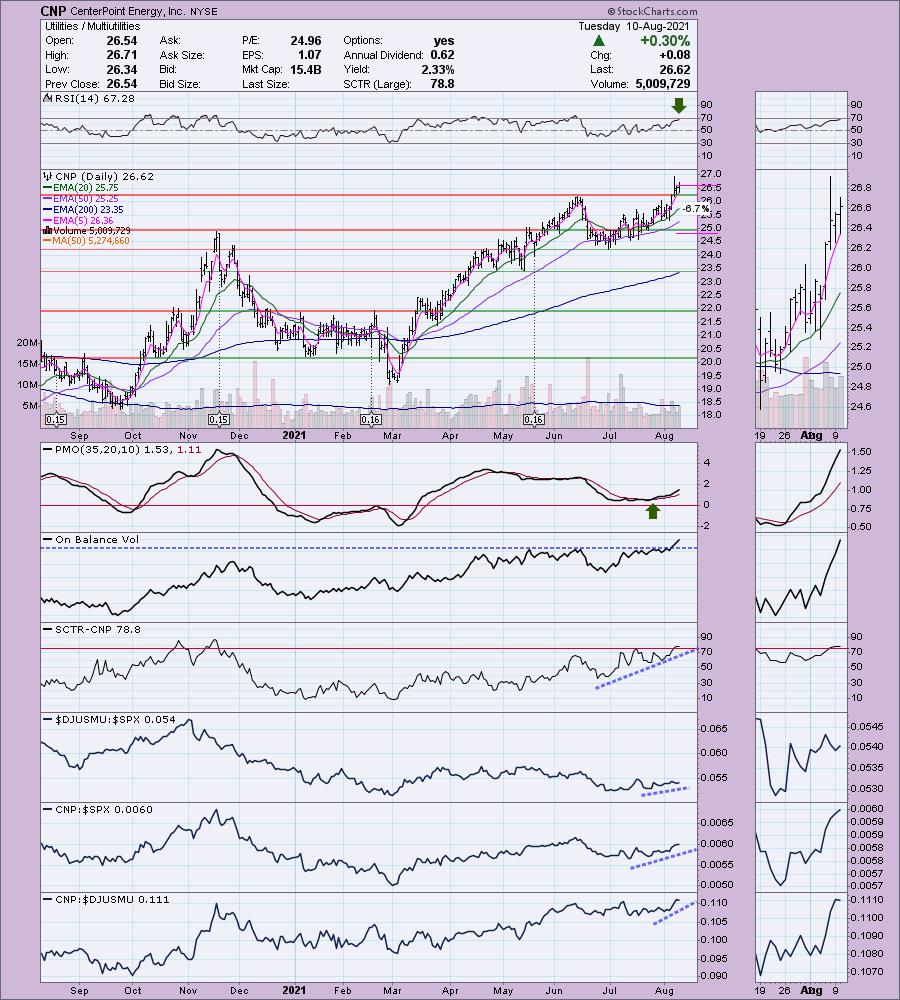
CenterPoint Energy, Inc. (CNP)
EARNINGS: 11/4/2021 (BMO)
CenterPoint Energy, Inc. is a holding company, which engages in the business of power generation and distribution. It operates through the following segments: Houston Electric Transmission & Distribution (T&D); Indiana Electric Integrated; Natural Gas Distribution; Energy Services; Infrastructure Services; Midstream Investments; and Corporate and Other. The Electric T&D segment offers electric transmission and distribution services. The Indiana Electric Integrated segment includes energy delivery services to electric customers and electric generation assets to serve electric customers and optimize those assets in the wholesale power market. The Natural Gas Distribution segment provides regulated natural gas distribution services. The Energy Services segment offers non-rate regulated natural gas sales to, and transportation and storage services, for commercial and industrial customers. The Infrastructure Services segment focuses on underground pipeline construction and repair services. The Midstream Investments segment consist of the equity method investment in Enable. The Other Operations segment comprises office buildings and other real estate used for business operations and home repair protection plans. The company was founded in 1866 and is headquartered in Houston, TX.
CNP is unchanged in after hours trading. Price broke out above resistance at the June top and has been consolidating the move. The RSI is positive and the PMO is gently rising out of overbought territory on a BUY signal. The OBV broke to a new high with price which confirms the breakout and likely follow-on. The SCTR just entered the "hot zone" above 75. The group is outperforming the market slightly and CNP is outperforming both the market and the group.
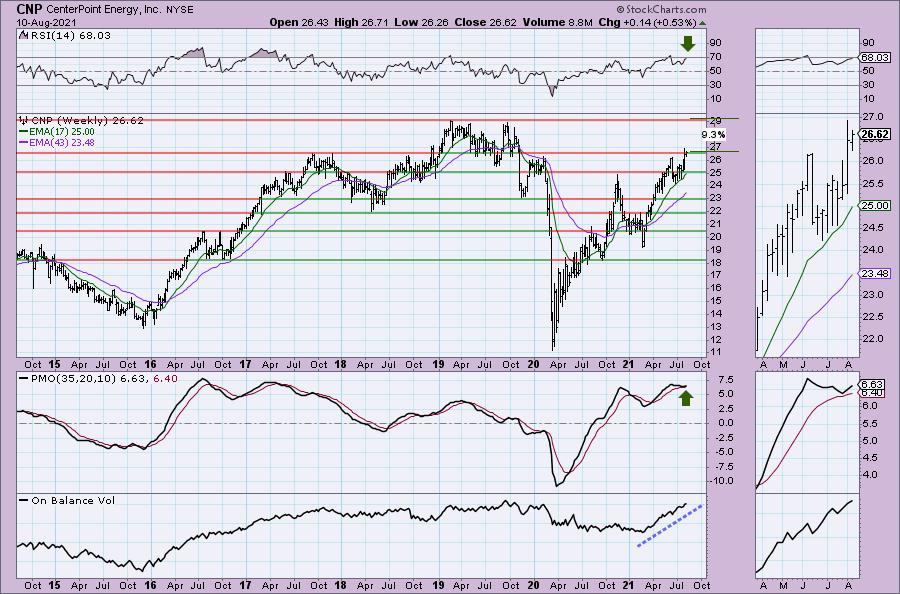
The weekly chart looks good with a positive RSI and PMO bottom above the signal line. the OBV is confirming the rally out of the 2021 low. Notice that price is beginning to breakout above resistance at the 2017 and 2018 tops that also align with the early 2020 high. Upside potential appears to be less, but this one should break to new all-time highs. It's in a defensive area of the market and a pretty good yielder.
IGM Biosciences Inc. (IGMS)
EARNINGS: 11/8/2021 (AMC)
IGM Biosciences, Inc. operates as a biotechnology company, which develops antibodies for the treatment of cancer. It offers IgM platform to expand upon the inherent properties of IgM antibodies and to allow for the rapid development of engineered therapeutic antibodies. The firms product pipe line includes IGM-2323, which is a CD20 x CD3 bispecific IgM antibody designed to treat patients with B cell Non-Hodgkin's lymphoma and other B cell malignancies; IGM-8444, which is an IgM antibody targeting Death Receptor 5 for the treatment of patients with solid and hematologic malignancies; and IGM-7354, which will target the delivery of IL-15 with the goal of inducing immune cell stimulation and proliferation. IGM Biosciences was founded in 2010 and is headquartered in Mountain View, CA.
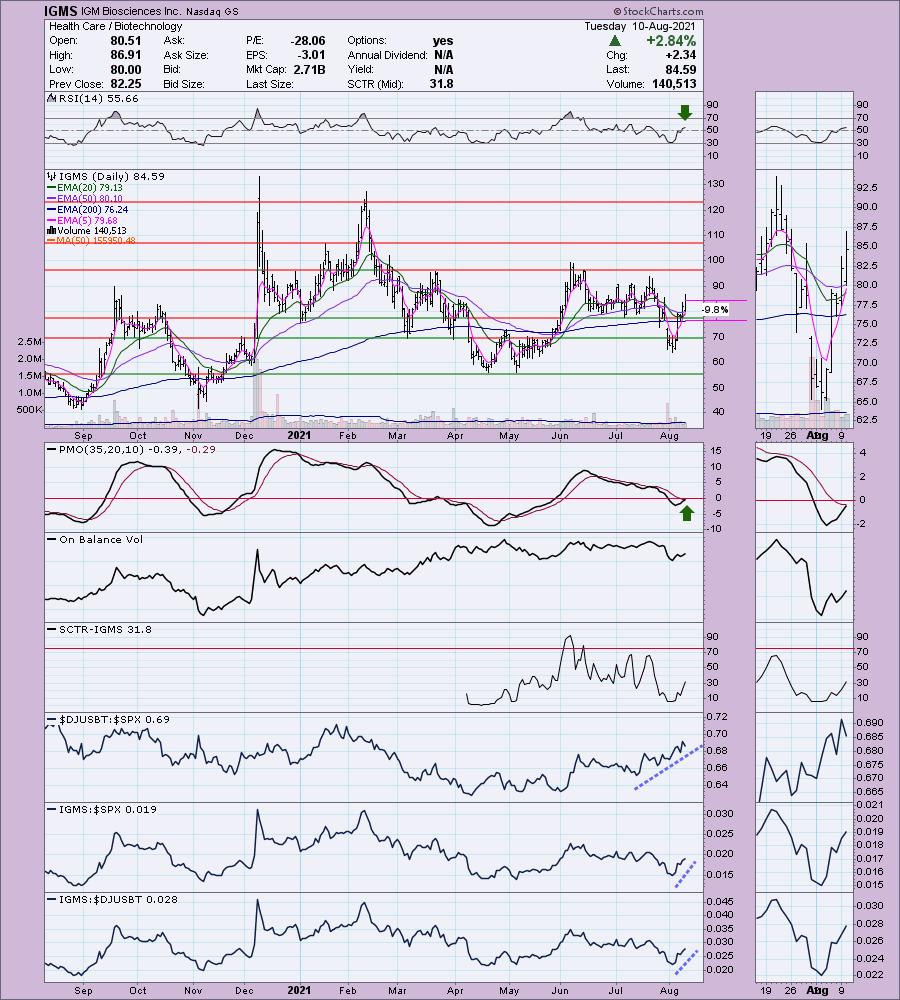
IGMS reported earnings yesterday and apparently they were well received. However, this one is down -1.5% in after hours trading so it appears we are getting a pullback toward the breakout point at the 50-EMA. This is a "V" bottom pattern that suggests a breakout above $96 at the March and June tops. We just had a ST Trend Model BUY signal as the 5-EMA crossed above the 20-EMA. It has been a bit of a sideways mover but in the short term we may be able to take advantage of new relative strength. The PMO is about to give us a crossover BUY signal. The stop is set at the 200-EMA.
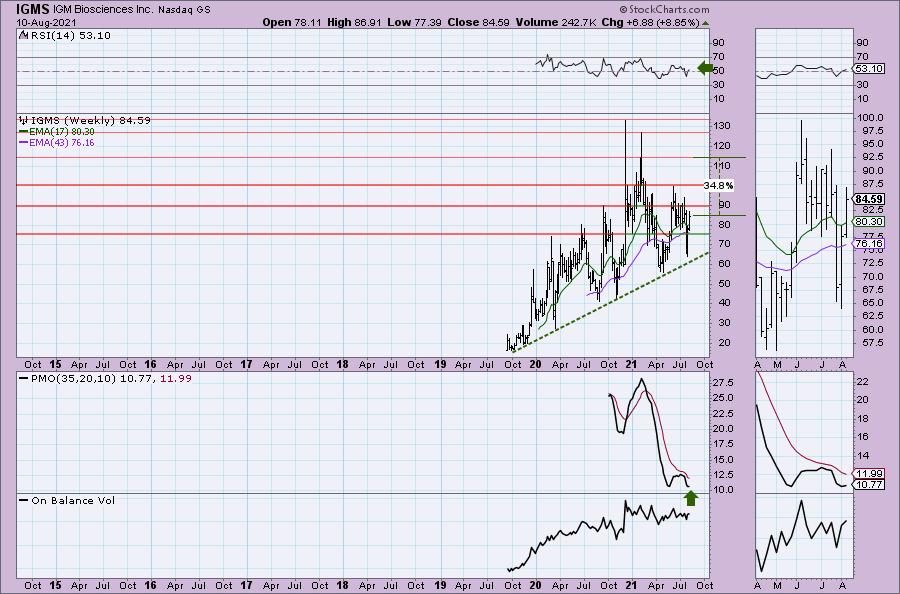
I like the look of the weekly chart given the nice rising trend that has held for months. The weekly PMO is now turning up. this is an interesting one but as with all Biotechs, be prepared for volatility. Upside potential is great. Even if it just gets to the June top, that's about an 18% gain.
Plug Power, Inc. (PLUG)
EARNINGS: 11/9/2021 (AMC)
Plug Power, Inc. provides alternative energy technology, which focuses on the design, development, commercialization, and manufacture of hydrogen and fuel cell systems used primarily for the material handling and stationary power markets. Its fuel cell system solution is designed to replace lead-acid batteries in electric material handling vehicles and industrial trucks for some distribution and manufacturing businesses. The company was founded by George C. McNamee and Larry G. Garberding on June 27, 1997 and is headquartered in Latham, NY.
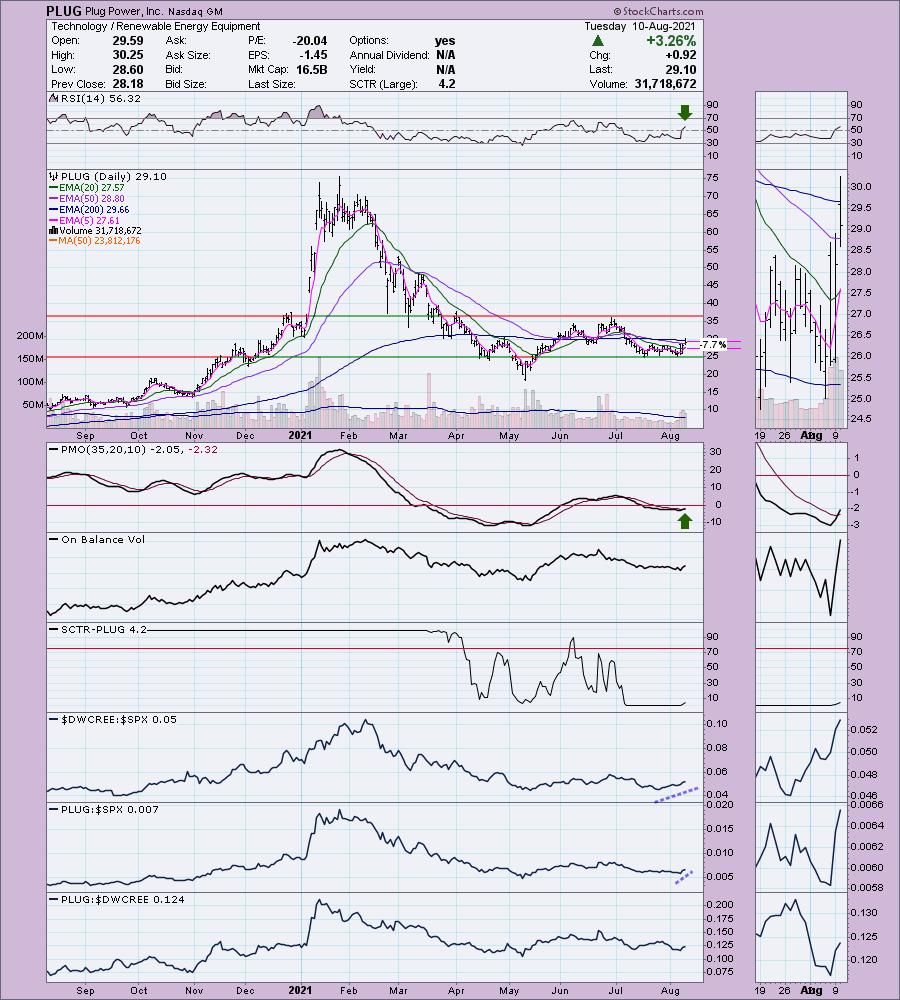
PLUG is up +0.76% in after hours trading. This one really hit the skids back in February and has now retreated into a new basing pattern. I still like the Solar group as it is really picking up nicely. This is a possible bottom fish in that area to consider. Price closed above the 50-EMA today and we have a ST Trend Model BUY signal as the 5-EMA crossed above the 20-EMA. The RSI is now in positive territory and the PMO just had a crossover BUY signal. The SCTR is definitely unimpressive, but we can see that relative strength lines have been favorable since the end of last week. It's still a beat down stock, but it could offer some very interesting gains. The stop is set below the 20-EMA. I'd say that should be your line in the sand. However, if you don't mind a deep stop, it requires about a 14% decline to reach the bottom of support.
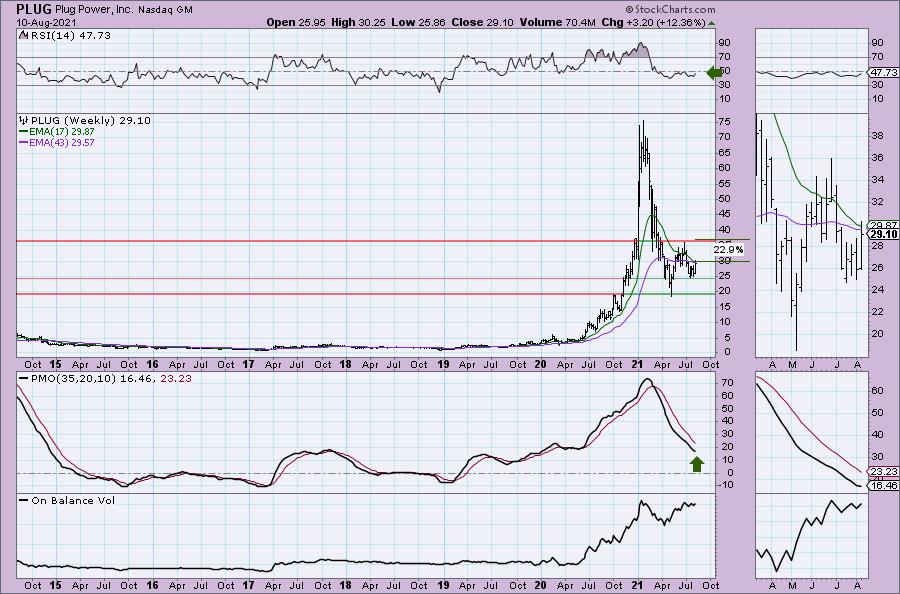
The weekly chart is beginning to get more positive. I'd like to see price get above the weekly EMAs and see a positive weekly RSI. The weekly PMO has stopped its descent, but it needs to turn up. We could see a double-bottom pattern develop in the intermediate term. One negative here is that despite an influx of volume based on the OBV, price hasn't come close to challenging the highs from earlier this year.
AMMO, Inc. (POWW)
EARNINGS: 8/16/2021 (AMC) ** Reports next Monday **
AMMO, Inc. engages in the design, manufacture and sale of ammunition products. It distributes its products under the following brands: Jesse James, SHIELD, and One Precise Shot. The company was founded in November 1990 and is headquartered in Scottsdale, AZ.
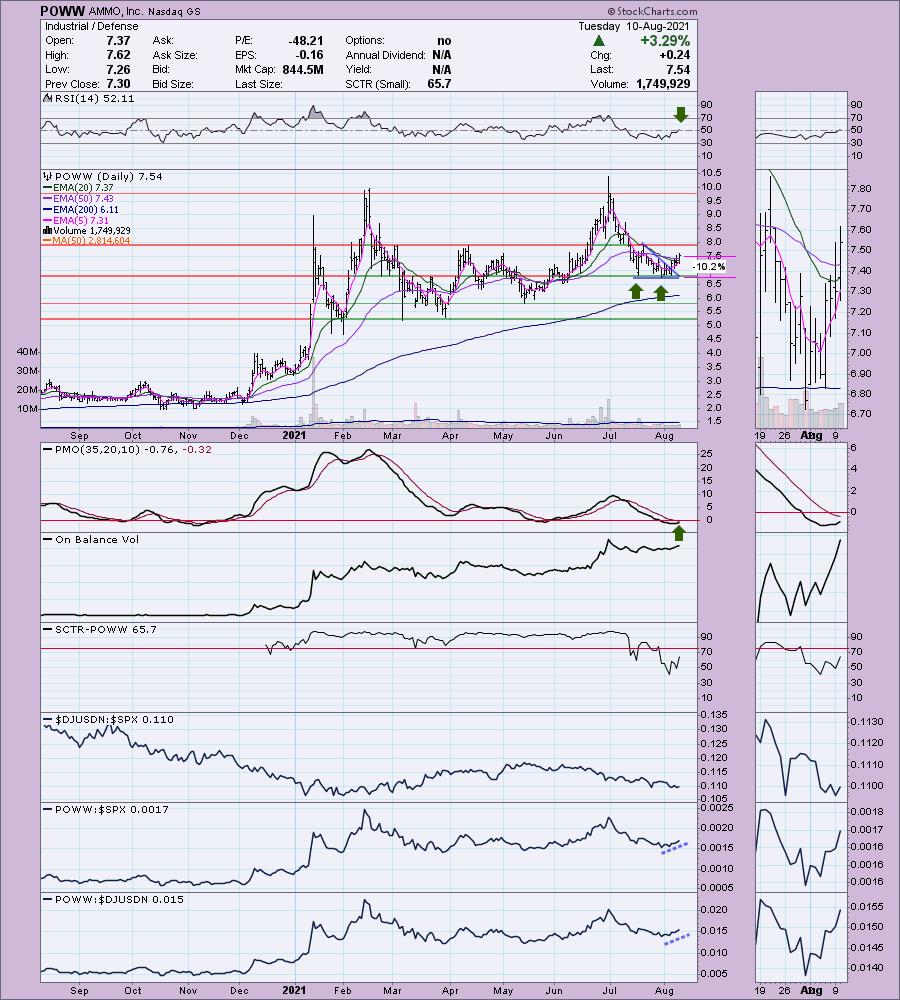
POWW is unchanged in after hours trading. I have anecdotal evidence, if you want to call it that, of the shortage in ammunition in the country right now. Trying to find ammunition for private use has proven nearly impossible in California and even in "gun friendly" states like Arizona, Nevada and Utah. Shortages generally lead to higher prices. Of course this has been the case for some time and we can see that POWW has been all over the place.
The chart looks really good minus the industry group not performing relatively well against the SPX. However, POWW is having no problem outperforming over the past week. We had a bearish descending triangle, but instead of breaking down, it broke up and out. This has formed an Adam & Eve double-bottom. Today it got above the 50-EMA. The PMO has bottomed and is going in for an oversold BUY signal. The RSI just reached positive territory. The SCTR is improving. The stop is rather deep but lined up just below short-term support.
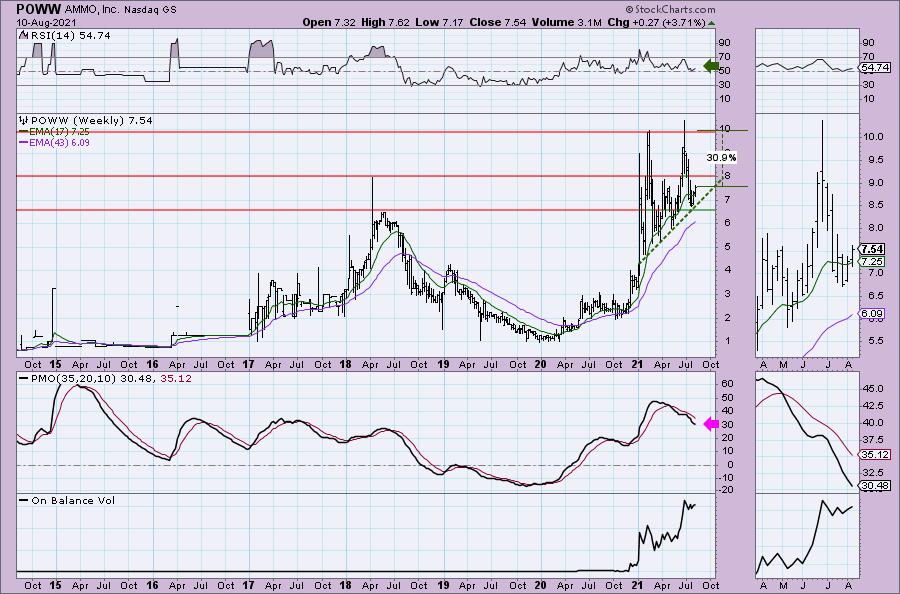
The weekly PMO needs work, but the weekly RSI is staying in positive territory. I like the longer-term rising trend that is staying intact with this recent pullback. Upside potential looks great.
Don't forget, on Thursdays I look at reader-requested symbols, so shoot me an email at erin@decisionpoint.com. I read every email I receive and try to answer them all!
Current Market Outlook:
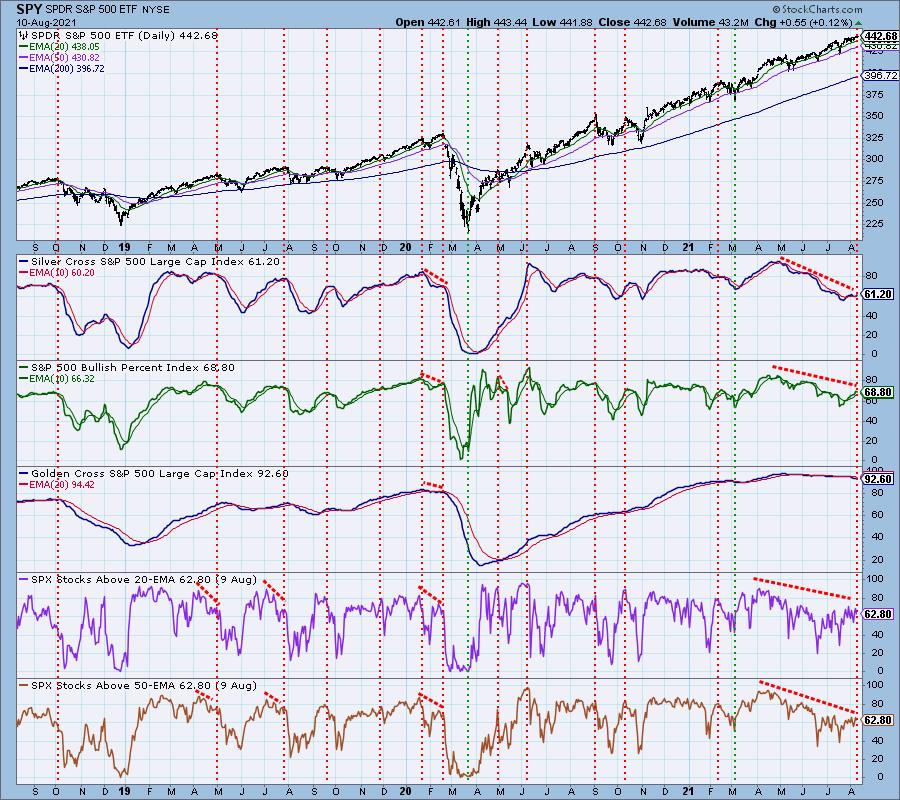
Market Environment: It is important to consider the odds for success by assessing the market tides. The following chart uses different methodologies for objectively showing the depth and trend of participation for intermediate- and long-term time frames.
- The Silver Cross Index (SCI) shows the percentage of SPX stocks on IT Trend Model BUY signals (20-EMA > 50-EMA)
- The Golden Cross Index (GCI) shows the percentage of SPX stocks on LT Trend Model BUY signals (50-EMA > 200-EMA)
- The Bullish Percent Index (BPI) shows the percentage of SPX stocks on Point & Figure BUY signals.
Don't forget that as a "Diamonds" member, you have access to our GCI/SCI curated ChartList on DecisionPoint.com. You'll find it under "Members Only" links on the left side on the Blogs and Links Page.
Here is the current chart:
Full Disclosure: I'm about 55% invested and 45% is in 'cash', meaning in money markets and readily available to trade with.
Technical Analysis is a windsock, not a crystal ball.
Happy Charting!
- Erin
erin@decisionpoint.com
Watch the latest episode of DecisionPoint with Carl & Erin Swenlin on Mondays 7:00p EST or on the DecisionPoint playlist on the StockCharts TV YouTube channel here!
NOTE: The stocks reported herein are from mechanical trading model scans that are based upon moving average relationships, momentum and volume. DecisionPoint analysis is then applied to get five selections from the scans. The selections given should prompt readers to do a chart review using their own analysis process. This letter is not a call for a specific action to buy, sell or short any of the stocks provided. There are NO sure things or guaranteed returns on the daily selection of "Diamonds in the Rough."
Helpful DecisionPoint Links:
DecisionPoint Shared ChartList and DecisionPoint Chart Gallery
Price Momentum Oscillator (PMO)
Swenlin Trading Oscillators (STO-B and STO-V)
For more links, go to DecisionPoint.com