
The Energy sector continues to outperform this week as we believed it would after our research in the Diamond Mine trading room last Friday. The stocks I've picked from this sector were up quite a bit today, but I suspect you can get them on a possible pullback tomorrow or Friday.
I had a few that are listed on the "short list" that came up in my scans. The four I'm presenting came from side research within in the Integrated Oil & Gas industry group. Certainly if you see Energy (XLE) outperforming, you know that a few of the big names crowding the top of the holdings are COP (scan result) and XOM. I liked the charts and included them. The other two HES (scan result) and CVE are also in the group and have very strong charts.
Don't forget to email your requests for tomorrow's issue of Diamonds! I'll add them to the Diamond Mine symbol review list if I don't cover them.
Today's "Diamonds in the Rough" are: COP, CVE, HES and XOM.
"Short List" (no order): PMT, NYCB, RDS/B, REVG, BP, APA and ARCC.

RECORDING LINK Friday (9/10):
Topic: DecisionPoint Diamond Mine (9/10/2021) LIVE Trading Room
Start Time : Sep 10, 2021 09:02 AM
Meeting Recording Link HERE.
Access Passcode: Sept@10th
REGISTRATION FOR FRIDAY 9/17 Diamond Mine:
When: Sep 17, 2021 09:00 AM Pacific Time (US and Canada)
Topic: DecisionPoint Diamond Mine (9/17/2021) LIVE Trading Room
Register in advance for this webinar HERE.
Save the registration confirmation email with login instructions in case Zoom doesn't notify you in time.

Free DP Trading Room (9/13) RECORDING LINK:
Topic: DecisionPoint Trading Room
Start Time : Sep 13, 2021 09:01 AM
Meeting Recording LINK.
Access Passcode: Sept/13th
For best results, copy and paste the access code to avoid typos.
Welcome to DecisionPoint Daily Diamonds, wherein I highlight five "Diamonds in the Rough." These are selected from the results of my DecisionPoint scans, which search for stocks that could benefit from the trend and condition of the market. Remember, these are not recommendations to buy or sell, but are the most interesting of the stocks that surfaced in my scans. My objective is to save you the work of the initial, tedious culling process, but you need to apply your own analysis to see if these stocks pique your interest as well. There are no guaranteed winners here!
ConocoPhillips (COP)
EARNINGS: 10/28/2021 (BMO)
ConocoPhillips engages in the exploration, production, transportation and marketing of crude oil, bitumen, natural gas, natural gas liquids, and liquefied natural gas on a worldwide basis. It operates through the following geographical segments: Alaska; Lower 48; Canada; Europe, Middle East and North Africa; Asia Pacific; and Other International. The Alaska segment primarily explores for produces, transports and markets crude oil, natural gas and natural gas liquids. The Lower 48 segment consists of operations in the U.S. and the Gulf of Mexico. The Canada segment is comprised of oil sands development in the Athabasca Region of northeastern Alberta and a liquids-rich unconventional play in western Canada. The Europe, Middle East and North Africa segment consists of operations and exploration activities in Norway, the United Kingdom and Libya. The Asia Pacific segment has explorations and product operations in China, Indonesia, Malaysia and Australia. The Other International segment handles exploration activities in Columbia and Argentina. The company was founded in 1875 and is headquartered in Houston, TX.
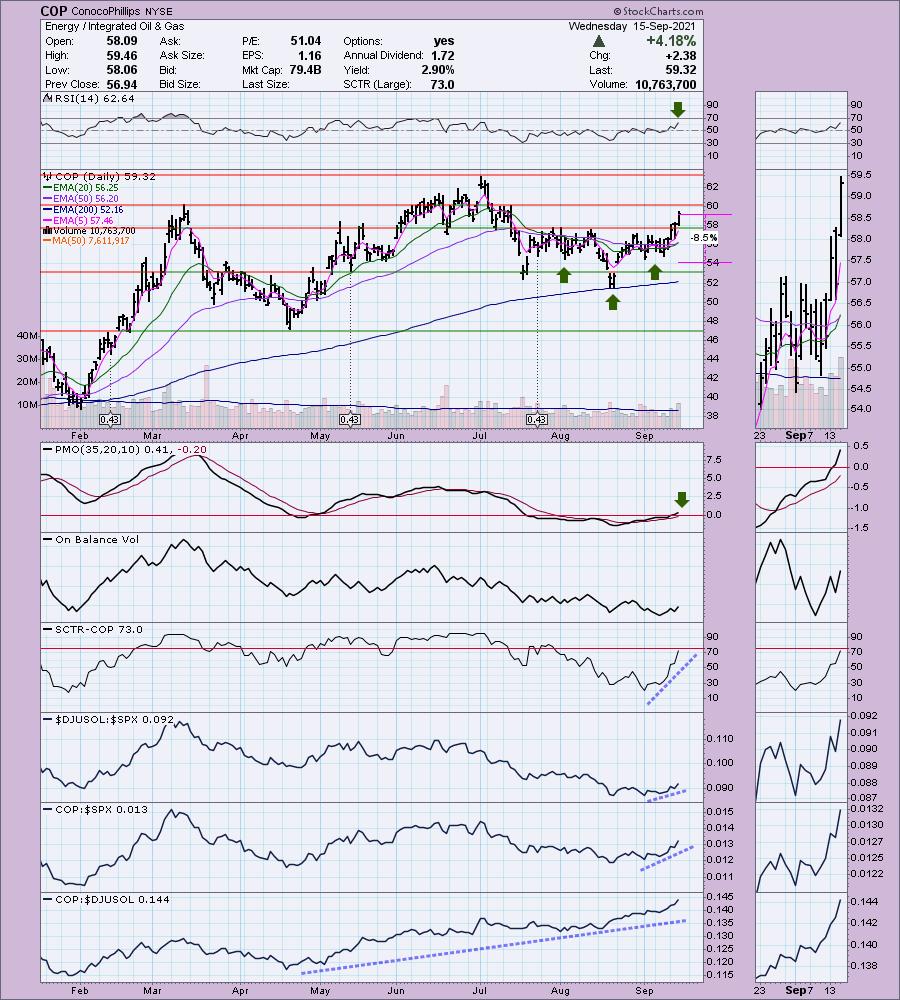
COP is unchanged in after hours trading. I've noticed that on most of the energy charts we have reverse head and shoulders patterns. COP is no exception. Today's strong breakout above the neckline suggest price could reach a minimum upside target of about $64. Today COP had an IT Trend Model "Silver Cross" BUY signal. The RSI is positive and not overbought. The PMO has now reached positive territory on an oversold crossover BUY signal. This group was the "one to watch" on Friday. It is outperforming and hasn't come close to reaching its relative strength highs. If this group is going to outperform the SPX, then COP is an excellent trading vehicle given its dominance of group outperformance. The stop is set below the "shoulders" of the reverse head and shoulders pattern.
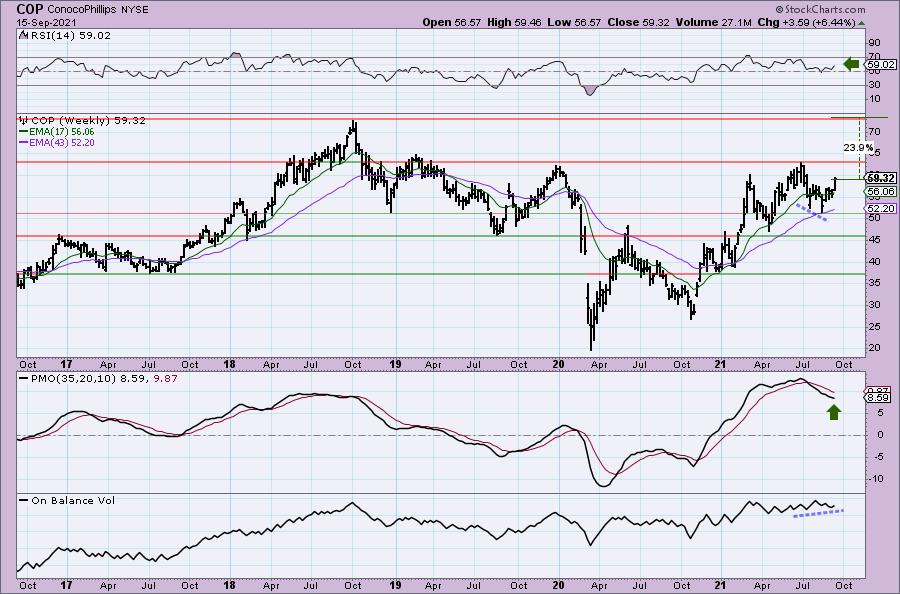
We have a positive divergence between price lows and OBV lows that led into the current rally. The weekly RSI is positive and the weekly PMO has been slowing its descent for a few weeks now.
Cenovus Energy Inc. (CVE)
EARNINGS: 10/28/2021 (BMO)
Cenovus Energy, Inc. engages in provision of gas and oil. Its activities include development, production, and marketing of crude oil, natural gas liquids (NGLS), and natural gas in Canada. The firm operates through four segments: Oil Sands, Conventional, Refining & Marketing, and Corporate & Eliminations. The Oil sands segment includes the development and production of bitumen in northeast Alberta including Foster Creek, Christina Lake and Narrows Lake as well as projects in the early stages of development. The Conventional segment includes includes land primarily in the Elmworth-Wapiti, Kaybob-Edson, and Clearwater operating areas. The Refining and Marketing segment provides transportation and selling of crude oil, natural gas and NGLS. The Corporate and Eliminations segment includes unrealized gains and losses recorded on derivative financial instruments, divestiture of assets, as well as other administrative, financing activities and research costs. The company was founded in 1881 and is headquartered in Calgary, Canada.
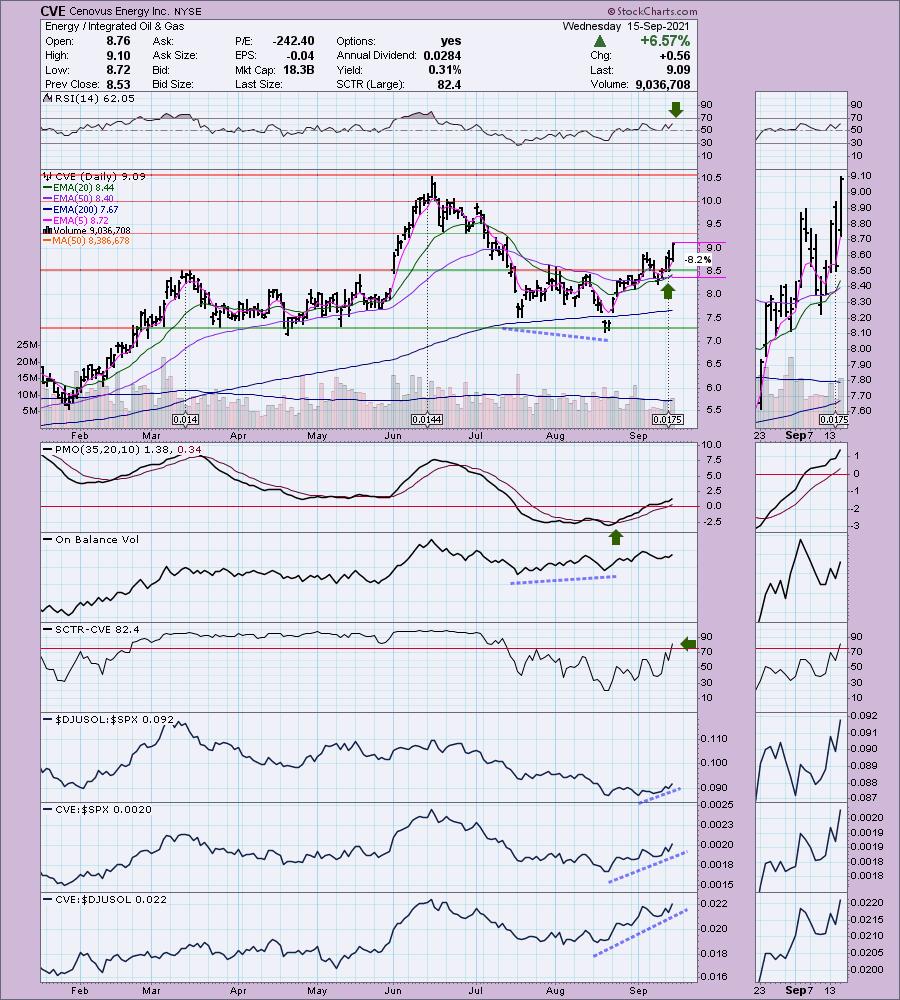
CVE is unchanged in after hours trading. The RSI is positive and the PMO is accelerating its descent in positive territory. We had a positive OBV divergence leading into this rally off the August low. The SCTR has just entered the "hot zone" above 75. An IT Trend Model "Silver Cross" BUY signal was just triggered this week. Relative strength is very good. The stop is set below the 50-EMA at 8.2%.
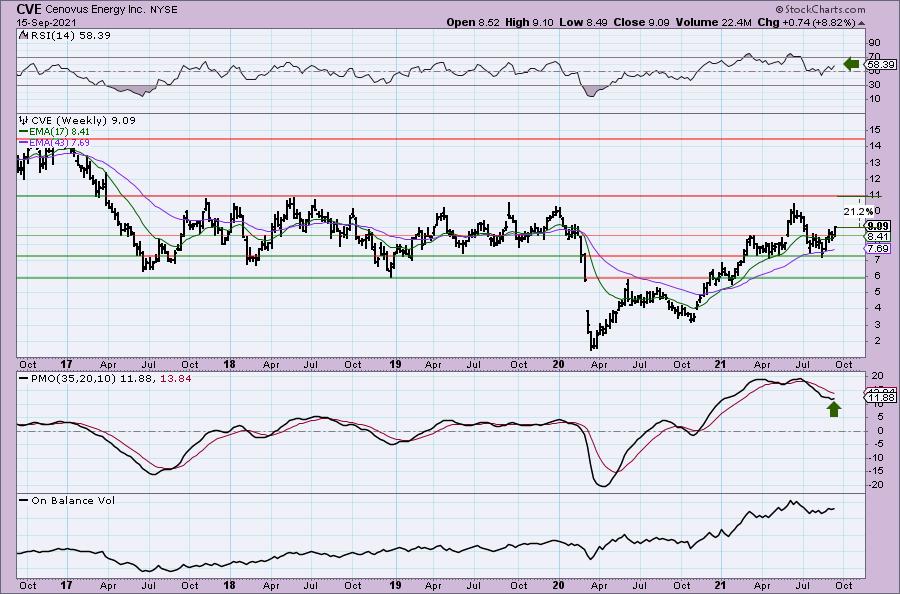
The weekly PMO has just turned back up. The weekly RSI is positive and rising. If price rallies to overhead resistance that would be an over 20% gain.
Hess Corp. (HES)
EARNINGS: 10/27/2021 (BMO)
Hess Corp is an exploration and production company, which engages in exploration, development, production, transportation, purchase & sale of crude oil, natural gas liquids and natural gas with production operations. It operates through the following segments: Exploration and Production and Midstream. The Exploration and Production segment explores for, develops, produces, purchases and sells crude oil, natural gas liquids and natural gas. The Midstream segment provides fee-based services including crude oil and natural gas gathering, processing of natural gas and the fractionation of natural gas liquids, transportation of crude oil by rail car, terminaling and loading crude oil and natural gas liquids, and the storage and terminaling of propane, primarily in the Bakken shale play of North Dakota. The company was founded by Leon Hess in 1920 and is headquartered in New York, NY.
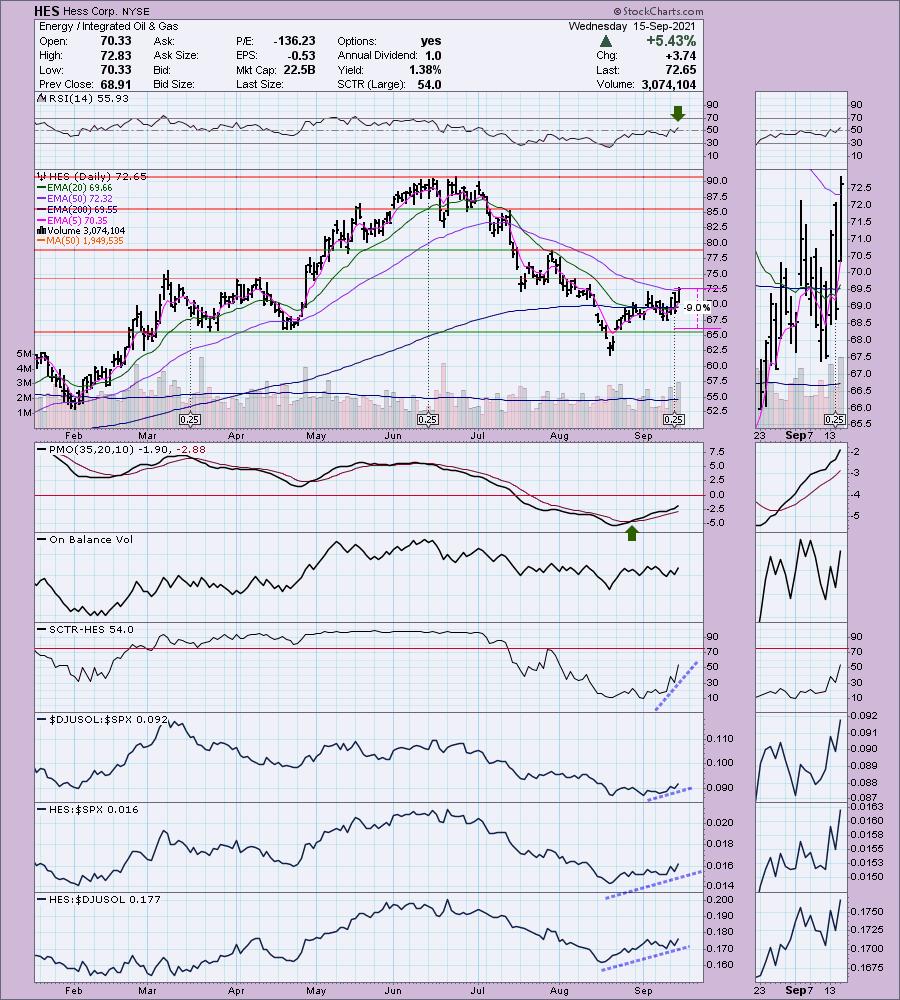
HES is up +0.01% in after hours trading. Price broke out above the 50-EMA for the first time since early July. The PMO is on an oversold crossover BUY signal. The RSI is positive and rising. The SCTR has shot up. Relative strength is strong for HES against the SPX and its group. The stop is set below the September low.
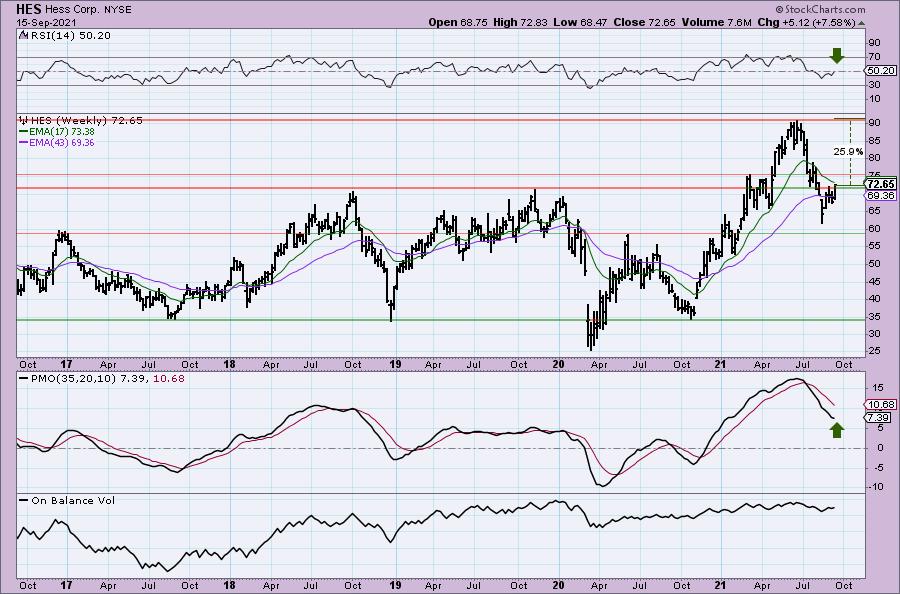
The weekly RSI just hit positive territory and the weekly PMO has turned up. It does have overhead resistance to deal with March 2021 top, but it has already vaulted stronger long-term resistance at the 2018/2019 highs.
Exxon Mobil Corp. (XOM)
EARNINGS: 10/29/2021 (BMO)
Exxon Mobil Corp. engages in the exploration, development, and distribution of oil, gas, and petroleum products. It operates through the following segments: Upstream, Downstream and Chemical. The Upstream segment produces crude oil and natural gas. The Downstream segment manufactures and trades petroleum products. The Chemical segment offers petrochemicals. The company was founded by John D. Rockefeller in 1882 and is headquartered in Irving, TX.
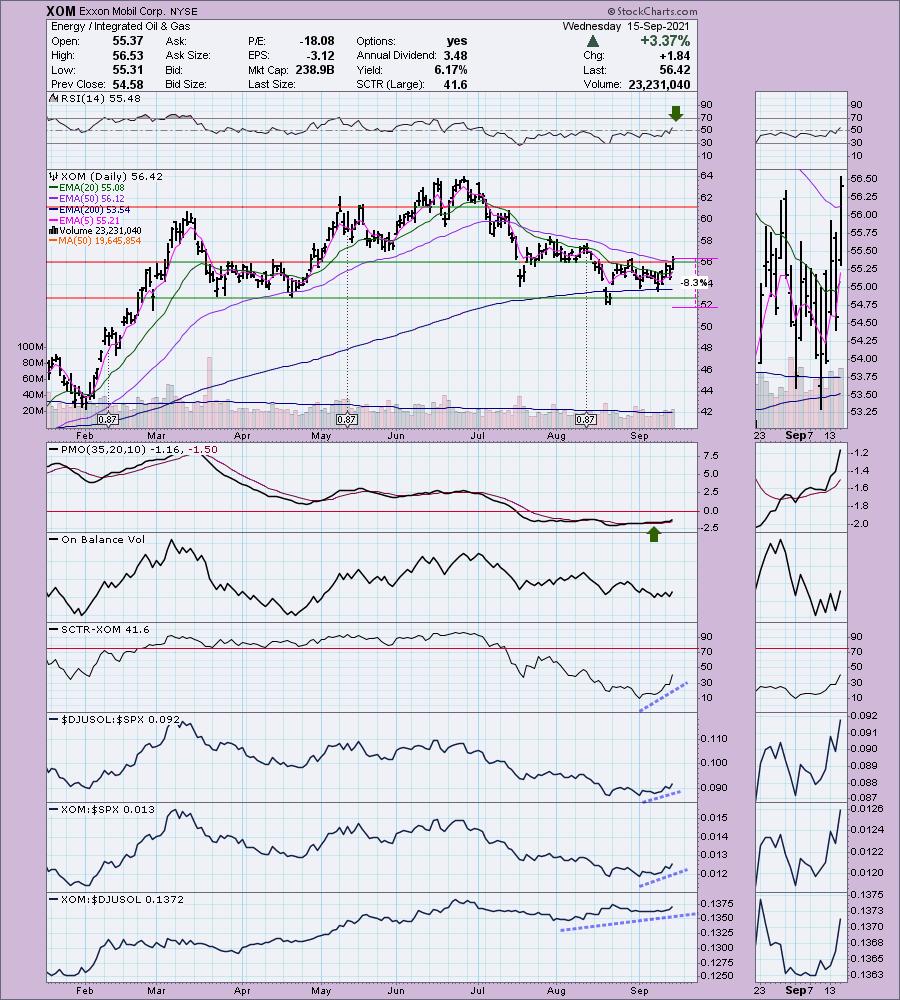
XOM is up +0.05% in after hours trading. I covered XOM in the April 29th 2021Diamonds Report. The position was up about 12% before it topped. The 8.3% stop appears to have been hit on the breakdown below the 200-EMA. The position would be down about 2% if it didn't hit.
I love the breakout above both the 50-EMA and overhead resistance. The RSI is positive and the PMO is rising after bottoming above the signal line in oversold territory. The SCTR has improved greatly. This is another one that you would want to own in this industry group given it nearly always outperforms its brethren. The stop is set below the August low.
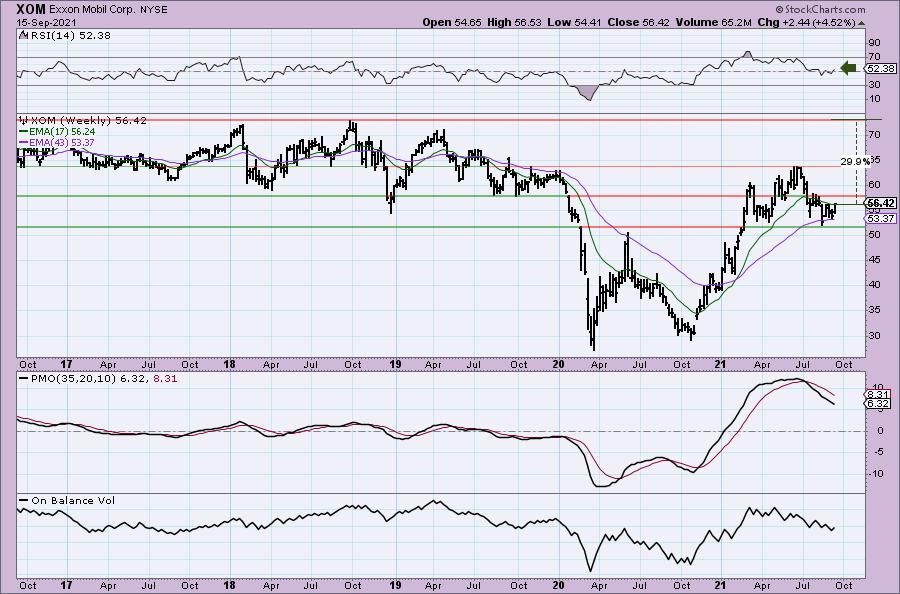
The one thing I don't like about the weekly chart is the still declining weekly PMO. The weekly RSI is back in positive territory. We can see that price bounced off strong support. Should it recapture the 2018 high, it would be nearly a 30% gain.
Don't forget, on Thursdays I look at reader-requested symbols, so shoot me an email at erin@decisionpoint.com. I read every email I receive and try to answer them all!
Current Market Outlook:
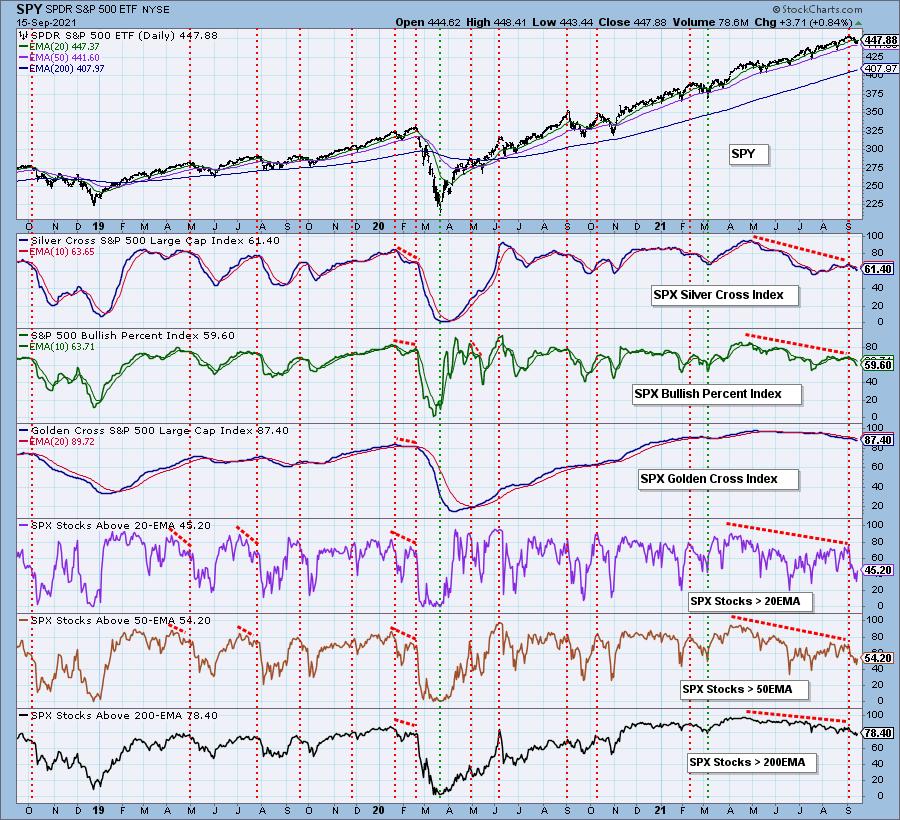
Market Environment: It is important to consider the odds for success by assessing the market tides. The following chart uses different methodologies for objectively showing the depth and trend of participation for intermediate- and long-term time frames.
- The Silver Cross Index (SCI) shows the percentage of SPX stocks on IT Trend Model BUY signals (20-EMA > 50-EMA)
- The Golden Cross Index (GCI) shows the percentage of SPX stocks on LT Trend Model BUY signals (50-EMA > 200-EMA)
- The Bullish Percent Index (BPI) shows the percentage of SPX stocks on Point & Figure BUY signals.
Don't forget that as a "Diamonds" member, you have access to our GCI/SCI curated ChartList on DecisionPoint.com. You'll find it under "Members Only" links on the left side on the Blogs and Links Page.
Here is the current chart:
Full Disclosure: I'm about 70% invested and 30% is in 'cash', meaning in money markets and readily available to trade with. I am contemplating expanding my exposure in Energy with a possible purchase of one of today's "Diamonds in the Rough". Their charts will tell me tomorrow which it will be if I do decide to pull the trigger.
Technical Analysis is a windsock, not a crystal ball.
Happy Charting!
- Erin
erin@decisionpoint.com
Watch the latest episode of DecisionPoint with Carl & Erin Swenlin on Mondays 7:00p EST or on the DecisionPoint playlist on the StockCharts TV YouTube channel here!
NOTE: The stocks reported herein are from mechanical trading model scans that are based upon moving average relationships, momentum and volume. DecisionPoint analysis is then applied to get five selections from the scans. The selections given should prompt readers to do a chart review using their own analysis process. This letter is not a call for a specific action to buy, sell or short any of the stocks provided. There are NO sure things or guaranteed returns on the daily selection of "Diamonds in the Rough."
Helpful DecisionPoint Links:
DecisionPoint Shared ChartList and DecisionPoint Chart Gallery
Price Momentum Oscillator (PMO)
Swenlin Trading Oscillators (STO-B and STO-V)
For more links, go to DecisionPoint.com