
The rally is on for the broad markets and that usually means Technology (XLK) is full of relative strength and opportunities! I wrote yesterday in the DecisionPoint Alert that we had an IT Trend Model "Silver Cross" BUY signal on XLK. Running my "Diamond PMO Scan" and my new version of the "Momentum Sleepers Scan" brought forth plenty of technology charts with an emphasis on Software and Semiconductors stocks.
I decided to dive into the Sector Summary - Industry Groups Summary to look at other Semiconductor and Software stocks that may've been missed by these scans for one reason or another. I decided I would concentrate on Semiconductors today, but I have listed some Software stocks as well as Semiconductor stocks in the "Stocks to Review".
Today's "Diamonds in the Rough": ALGM, ON, NXPI and STM.
"Stocks to Review" (no order): PLTR, FOUR, AMBA, MRVL, ACMR and SHOP.

RECORDING LINK Friday (10/15):
Topic: DecisionPoint Diamond Mine (10/15/2021) LIVE Trading Room
Start Time : Oct 15, 2021 09:00 AM
Meeting Recording LINK.
Access Passcode: October$15
REGISTRATION FOR FRIDAY 10/22 Diamond Mine:
When: Oct 22, 2021 09:00 AM Pacific Time (US and Canada)
Topic: DecisionPoint Diamond Mine (10/22/2021) LIVE Trading Room
Register in advance for this webinar HERE.
Save the registration confirmation email with login instructions in case Zoom doesn't notify you in time.

Free DP Trading Room (10/18) RECORDING LINK:
Topic: DecisionPoint Trading Room
Start Time : Oct 18, 2021 09:00 AM
Meeting Recording LINK
Access Passcode: October18!
For best results, copy and paste the access code to avoid typos.
Welcome to DecisionPoint Daily Diamonds, wherein I highlight five "Diamonds in the Rough." These are selected from the results of my DecisionPoint scans, which search for stocks that could benefit from the trend and condition of the market. Remember, these are not recommendations to buy or sell, but are the most interesting of the stocks that surfaced in my scans. My objective is to save you the work of the initial, tedious culling process, but you need to apply your own analysis to see if these stocks pique your interest as well. There are no guaranteed winners here!
Allegro Microsystems Inc. (ALGM)
EARNINGS: 10/28/2021 (BMO)
Allegro MicroSystems, Inc. develops semiconductor technology and application-specific algorithms. It provides current sensors, switches and latches, linear and angular position, and magnetic speed sensors. The firm designs, develops, fabless manufactures and markets of sensor ICs and application-specific analog power ICs enabling the emerging technologies in the automotive and industrial markets. The company was founded on March 30, 2013 and is headquartered in Manchester, NH.
Predefined Scans Triggered: P&F High Pole and Parabolic SAR Buy Signals.
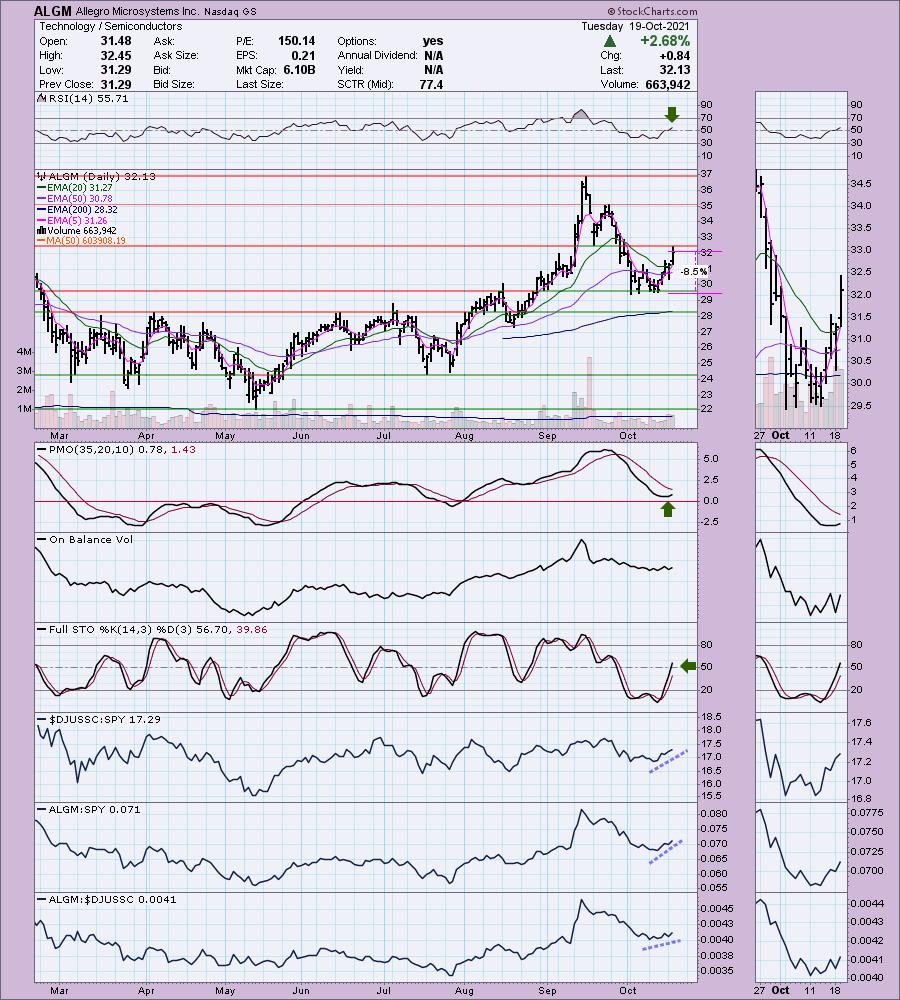
ALGM is unchanged in after hours trading. Price bounced off strong support earlier this month. There is a messy double-bottom here and price did break above the confirmation line today. It traded and closed above the 20-EMA, but it is now against resistance at that mid-September low. Given the positive RSI and rising PMO, I suspect we will see it break above this level. Stochastics are moving upward and are not overbought. Relative strength is beginning to improve for the Semiconductor industry group. ALGM is outperforming the SPY and is beginning to outperform its industry group. The stop is set below support at 8.5%.
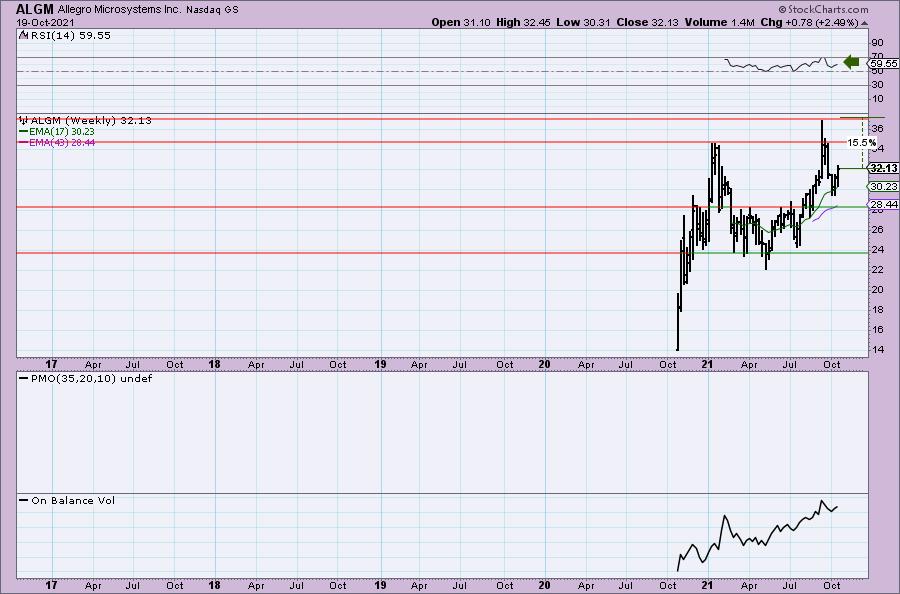
The weekly chart does not have a calculated PMO, but we do see a positive RSI. Upside target is a breakout past all-time highs.
NXP Semiconductor N.V. (NXPI)
EARNINGS: 11/1/2021 (AMC)
NXP Semiconductors NV is a holding company, which engages in the provision of semiconductor solutions. It focuses on high performance mixed signal (HMPS), which delivers high performance mixed signal solutions to its customers to satisfy their system and sub-systems needs across the application areas such as automotive, identification, mobile, consumer, computing, wireless infrastructure, lighting and industrial, and software solutions for mobile phones. Its products include Arm Processors, Arm MCUs, and Power Architecture. The company was founded on August 2, 2006 and is headquartered in Eindhoven, the Netherlands.
Predefined Scans Triggered: Bullish MACD Crossovers.
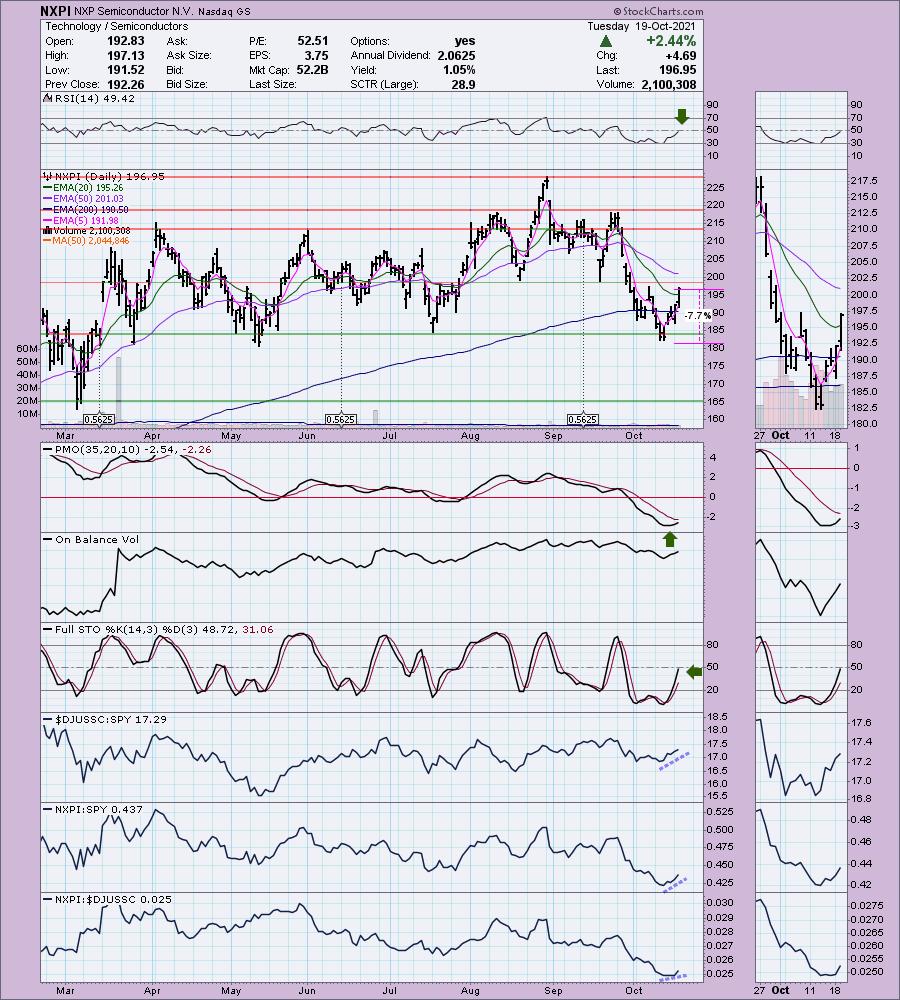
NXPI is down -0.10% in after hours trading. It's actually been a sideways mover and I do like to avoid those. However, I made an exception here for two reasons. 1) It is at the bottom of the trading range and rallying. 2) We have a "V" bottom that has retraced more than 1/3rd of the left side of the pattern. The RSI is just about to cross into positive territory. The PMO is rising in oversold territory. Stochastics are rising strongly. Relative performance is beginning to turn up. The stop is set below support at 7.7%.
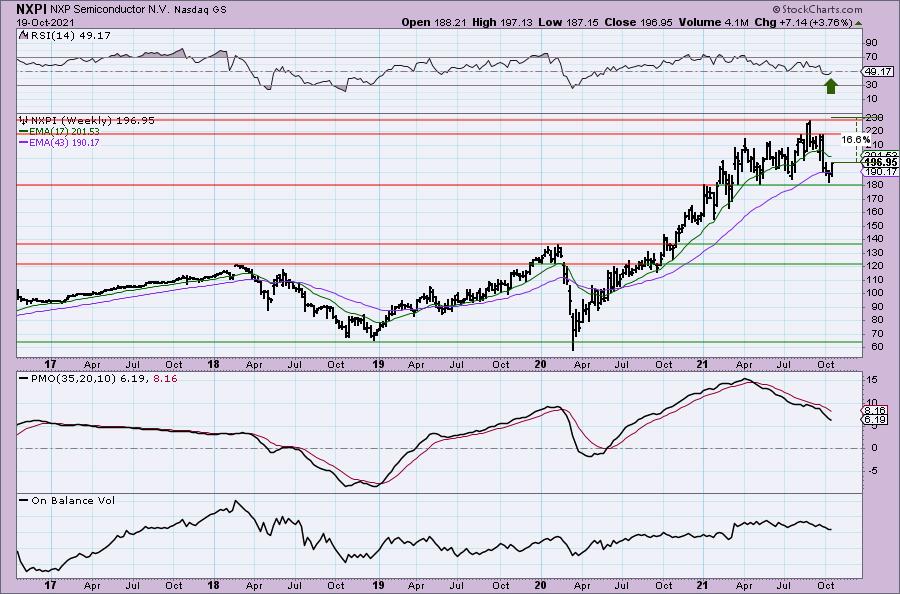
We can see the trading range quite clearly on the weekly chart. If it can reach the top of the range, that would be an over 16% gain. The weekly RSI is turning up and nearing positive territory again. The weekly PMO is still pointed downward so think of this investment as short-term until it turns up.
ON Semiconductor Corp. (ON)
EARNINGS: 11/2/2021 (AMC)
ON Semiconductor Corp. engages in the design, manufacture, and marketing of portfolio of semiconductor components. It operates through the following segments: Power Solutions Group, Advanced Solutions Group, and Intelligent Sensing Group. The Power Solutions Group segment offers discrete, module, and semiconductor products that perform multiple application functions, including power switching, power conversion, signal conditioning, circuit protection, signal amplification, and voltage reference functions. The Advanced Solutions Group segment designs and develops analog, mixed-signal, advanced logic, ASSPs and ASICs, Wi-Fi and power solutions for a broad base of end-users in the automotive, consumer, computing, industrial, communications, medical and aerospace/defense markets. The Intelligent Sensing Group segment includes designs and develops CMOS and CCD image sensors, as well as proximity sensors, image signal processors, single photon detectors, including SiPM and SPAD arrays, as well as actuator drivers for autofocus and image stabilization for a broad base of end-users in the automotive, industrial, consumer, wireless, medical and aerospace/defense markets. The company was founded on August 4, 1999 and is headquartered in Phoenix, AZ.
Predefined Scans Triggered: Elder Bar Turned Green and Parabolic SAR Buy Signals.
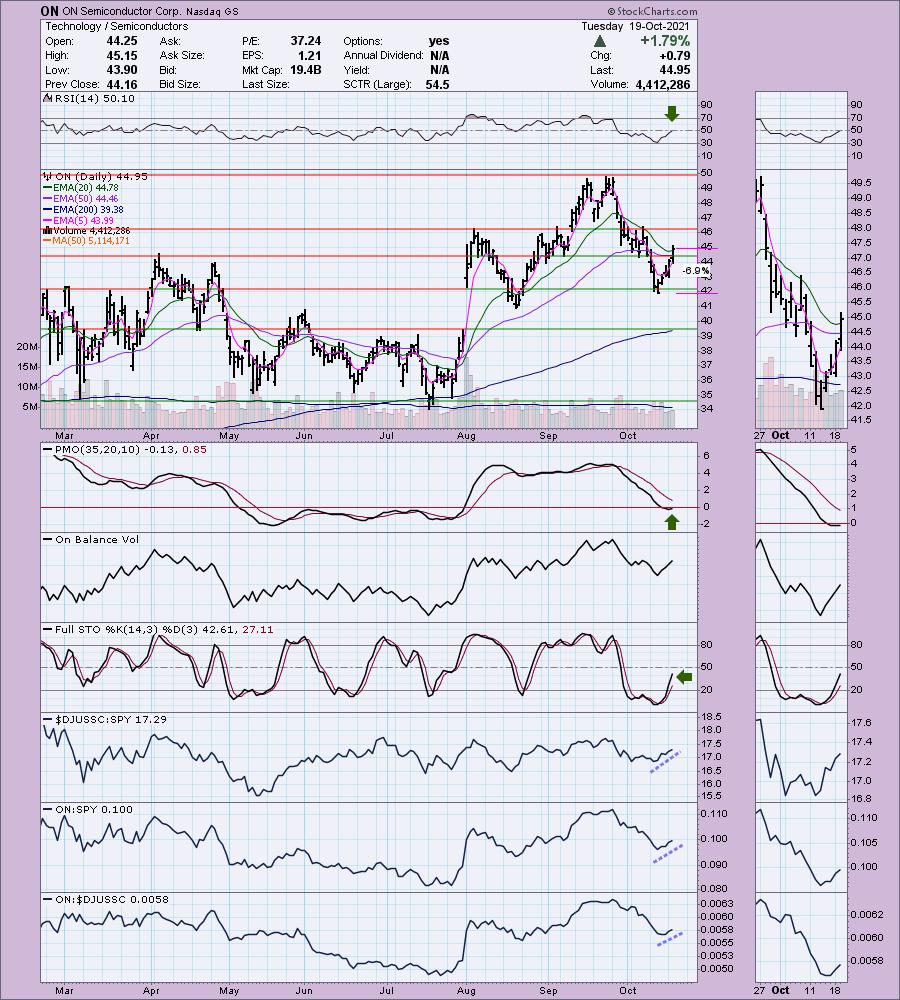
ON is down -0.31% in after hours trading. Price bounced off gap support and has now broken above the 20-EMA. The PMO is beginning to turn up. The RSI just entered positive territory. Stochastics are quite bullish and we can see relative strength beginning to build. The stop is set at about 7% just below support.
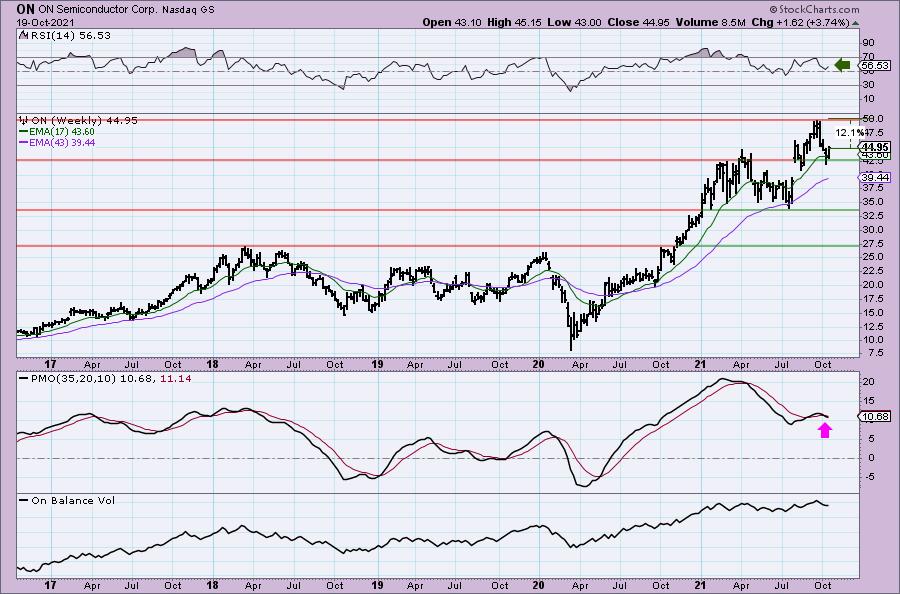
The weekly PMO just triggered a crossover SELL signal, however, it appears to be decelerating already. Upside potential is more than 12% as I expect to see new all-time highs.
STMicroelectronics NV (STM)
EARNINGS: 10/28/2021 (BMO)
STMicroelectronics NV designs, develops, manufactures and markets products, which offers discrete and standard commodity components, application-specific integrated circuits, full custom devices and semi-custom devices for analog, digital and mixed-signal applications. It operates through the following segments: Automotive and Discrete Group, Analog and MEMS Group, and Microcontrollers and Digital ICs Group. The Automotive and Discrete Group segment comprises of all dedicated automotive ICs, and discrete and power transistor products. The Analog and MEMS Group segment comprises of low-power high-end analog ICs, smart power products for industrial, computer and consumer markets, touch screen controllers, low power connectivity solutions and metering solutions for smart grid and all MEMS products. The Microcontrollers and Digital ICs Group segment comprises of general purpose and secure microcontrollers, EEPROM memories, and digital ASICs. The company was founded in June 1987 and is headquartered in Plan-Les-Ouates, Switzerland.
Predefined Scans Triggered: Bullish MACD Crossovers and P&F High Pole.
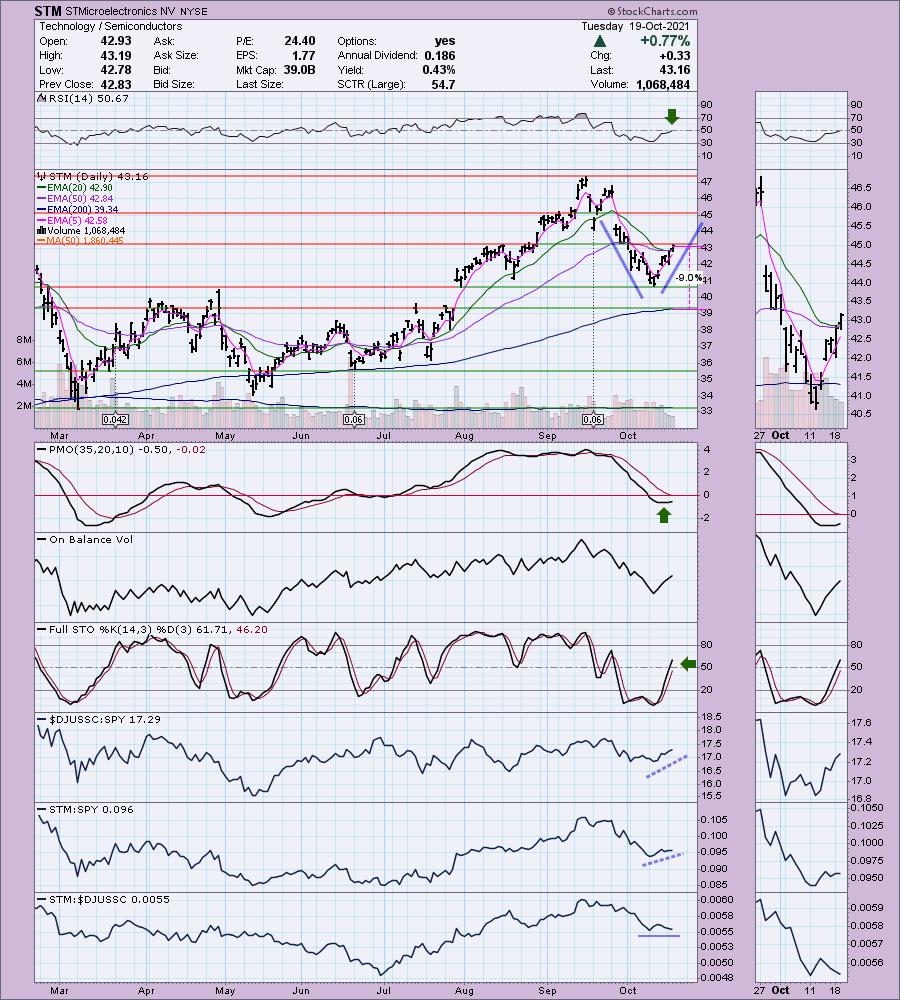
STM is up +0.21% in after hours trading. I liked the "V" bottom chart pattern. Combine that will a breakout above the 20/50-EMAs and we see that it has retraced about 1/3rd of the pattern which executes and confirms it. The expectation is a breakout above the resistance level at the top of the left side of the "V". The RSI is now positive and the PMO has turned up in oversold territory. Volume is coming in. Stochastics are positive and rising. Relative strength against the SPY is good and it is performing in line with its industry group. The stop level listed is 9%, but you could tighten that up to about 6% and stay beneath the October low.
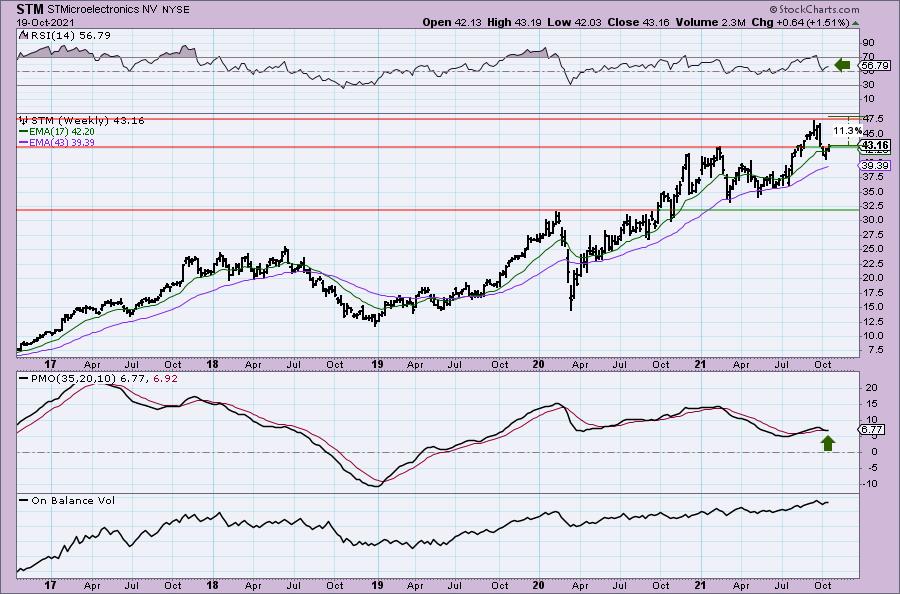
The PMO is on a SELL signal, but it has already flattened out in preparation to resume its uptrend. Upside potential is more than 11% as I believe this one will also start making new highs soon.
Don't forget, on Thursdays I look at reader-requested symbols, click HERE to shoot me an email. I read every email I receive and try to answer them all!
Current Market Outlook:
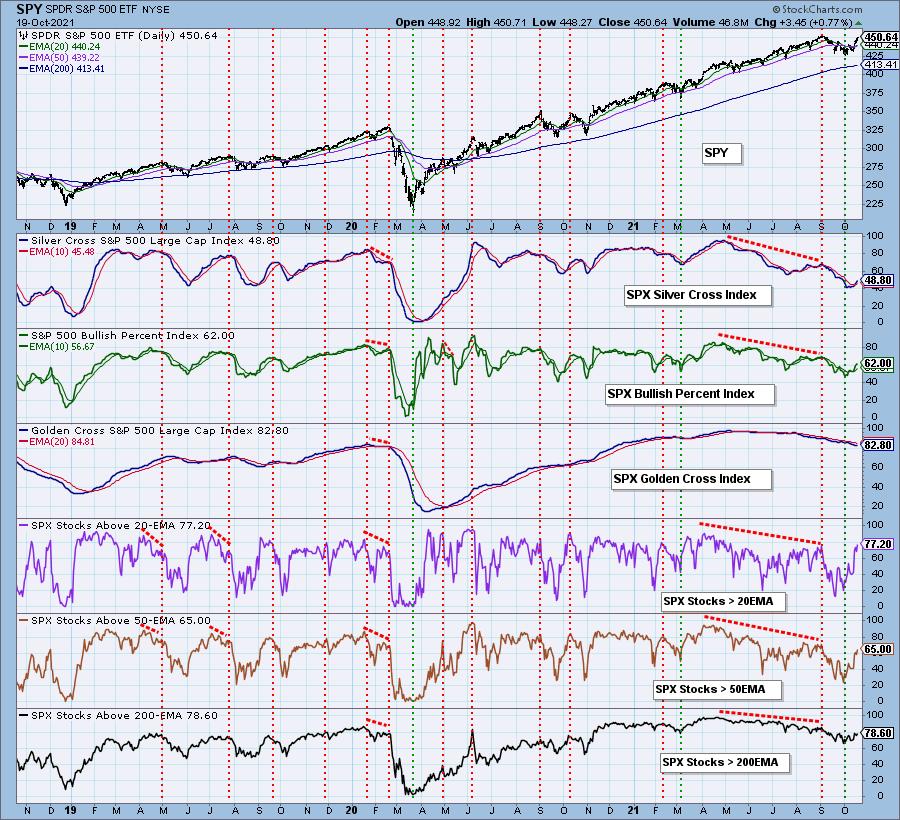
Market Environment: It is important to consider the odds for success by assessing the market tides. The following chart uses different methodologies for objectively showing the depth and trend of participation for intermediate- and long-term time frames.
- The Silver Cross Index (SCI) shows the percentage of SPX stocks on IT Trend Model BUY signals (20-EMA > 50-EMA)
- The Golden Cross Index (GCI) shows the percentage of SPX stocks on LT Trend Model BUY signals (50-EMA > 200-EMA)
- The Bullish Percent Index (BPI) shows the percentage of SPX stocks on Point & Figure BUY signals.
Don't forget that as a "Diamonds" member, you have access to our GCI/SCI curated ChartList on DecisionPoint.com. You'll find it under "Members Only" links on the left side on the Blogs and Links Page.
Here is the current chart:
Full Disclosure: I'm back to 70% invested and 30% is in 'cash', meaning in money markets and readily available to trade with.
I'm required to disclose if I currently own a stock and/or may buy it within the next 72 hours.
Technical Analysis is a windsock, not a crystal ball.
Happy Charting!
- Erin
erin@decisionpoint.com
Watch the latest episode of DecisionPoint with Carl & Erin Swenlin on Mondays 7:00p EST or on the DecisionPoint playlist on the StockCharts TV YouTube channel here!
NOTE: The stocks reported herein are from mechanical trading model scans that are based upon moving average relationships, momentum and volume. DecisionPoint analysis is then applied to get five selections from the scans. The selections given should prompt readers to do a chart review using their own analysis process. This letter is not a call for a specific action to buy, sell or short any of the stocks provided. There are NO sure things or guaranteed returns on the daily selection of "Diamonds in the Rough."
Helpful DecisionPoint Links:
DecisionPoint Shared ChartList and DecisionPoint Chart Gallery
Price Momentum Oscillator (PMO)
Swenlin Trading Oscillators (STO-B and STO-V)
For more links, go to DecisionPoint.com