
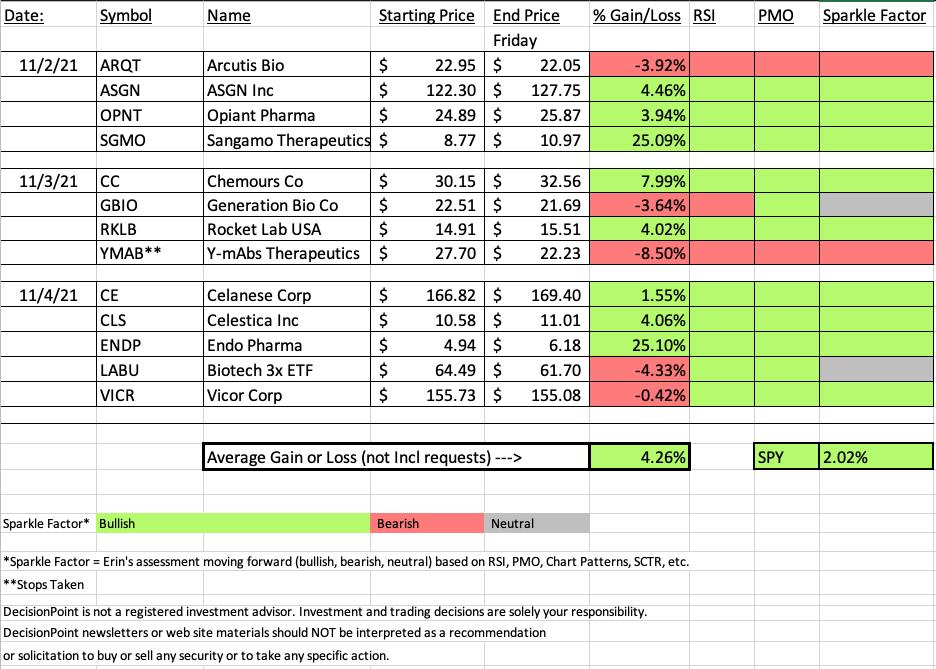
Our two winners finished the week up over 25% each! As I always say it is not my intention to make comparisons to the SPY with Diamonds in the Rough, but it is a barometer on how the analysis process is functioning. This week the scans supplied plenty of candy post-Halloween.
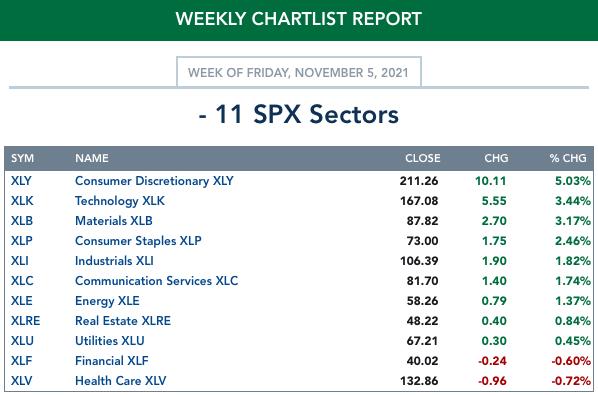
Healthcare was hit and miss this week as the biggest loser was a Biotech and the big winner was a Biotech. It is time to rotate out of Healthcare in general in my opinion, so set stops. The sector was the only sector to finish in the red today. I would also point out that Crude Oil is topping and we could see supply increase which will bring prices even lower. I would avoid Energy in the coming week(s).
Biotechs are getting worrisome. Please note my "Sparkle Factors" on my outlook moving forward. There are few I do not like anymore and two that are questionable.
I opted to take a slightly deeper stop on our "Dud" this week. It was set at 7.8%, but I'm not sure if you'd have been able to prevent a decline that was deeper so I made it an 8.5% loss. One of them appeared to have triggered the stop, but I'm going to go ahead and not count it, meaning I'm taking the gain from the following day. It was just so close.
I'll discuss this week's "Dud" and "Darling" below and you'll find this week's "Sector/Industry Group to Watch". Reader Request ENDP was only one one-hundredth of a point higher than my selection SGMO, so I'm presenting SGMO as this week's "Darling".
This link to today's Diamond Mine recording is below as well as the link to sign up for next week's Diamond Mine.
Hope everyone has a great weekend!

RECORDING LINK Friday (11/5):
Topic: DecisionPoint Diamond Mine (11/5/2021) LIVE Trading Room
Start Time: Nov 5, 2021 09:01 AM
Meeting Recording Link HERE.
Access Passcode: November#5
REGISTRATION FOR FRIDAY 11/12 Diamond Mine:
When: Nov 12, 2021 09:00 AM Pacific Time (US and Canada)
Topic: DecisionPoint Diamond Mine (11/12/2021) LIVE Trading Room
Register in advance for this webinar HERE.
Save the registration confirmation email with login instructions in case Zoom doesn't notify you in time.

Free DP Trading Room (11/1) RECORDING LINK:
Topic: DecisionPoint Trading Room
Start Time: Nov 1, 2021 09:00 AM
Meeting Recording LINK.
Access Passcode: November@1
For best results, copy and paste the access code to avoid typos.
A few items about the spreadsheet: I've put on the spreadsheet whether the RSI is positive (green) or negative (red). The PMO column tells you if it is rising (green) or falling (red). Finally I've added my own "Sparkle Factor" that gives you my assessment going forward, bullish (green), bearish (red) or neutral (gray). The Sparkle Factor is basically my thoughts on whether I expect it to rise or fall. A neutral means it could really go either way so it could be added to a watch list. If you're in a stock I consider "neutral" going forward, the ball is in your court.
Darling:
Sangamo Therapeutics, Inc. (SGMO)
EARNINGS: 11/4/2021 (BMO)
Sangamo Therapeutics, Inc. is a clinical stage biotechnology company, which engages in the research and development of zinc finger proteins. It focuses on three therapeutic areas: inherited metabolic diseases, central nervous system, and diseases and immunology, which comprises inflammatory and autoimmune diseases. It also offers complementary technology platforms such as gene therapy, ex vivo cell therapy, in vivo genome editing, and in vivo genome regulation. The company was founded by Edward O. Lanphier II in 1995 and is headquartered in Brisbane, CA.
Predefined Scans Triggered: P&F Descending Triple Bottom Breakdown, P&F Double Bottom Breakout, Strong Volume Gainers and P&F Bearish Catapult.
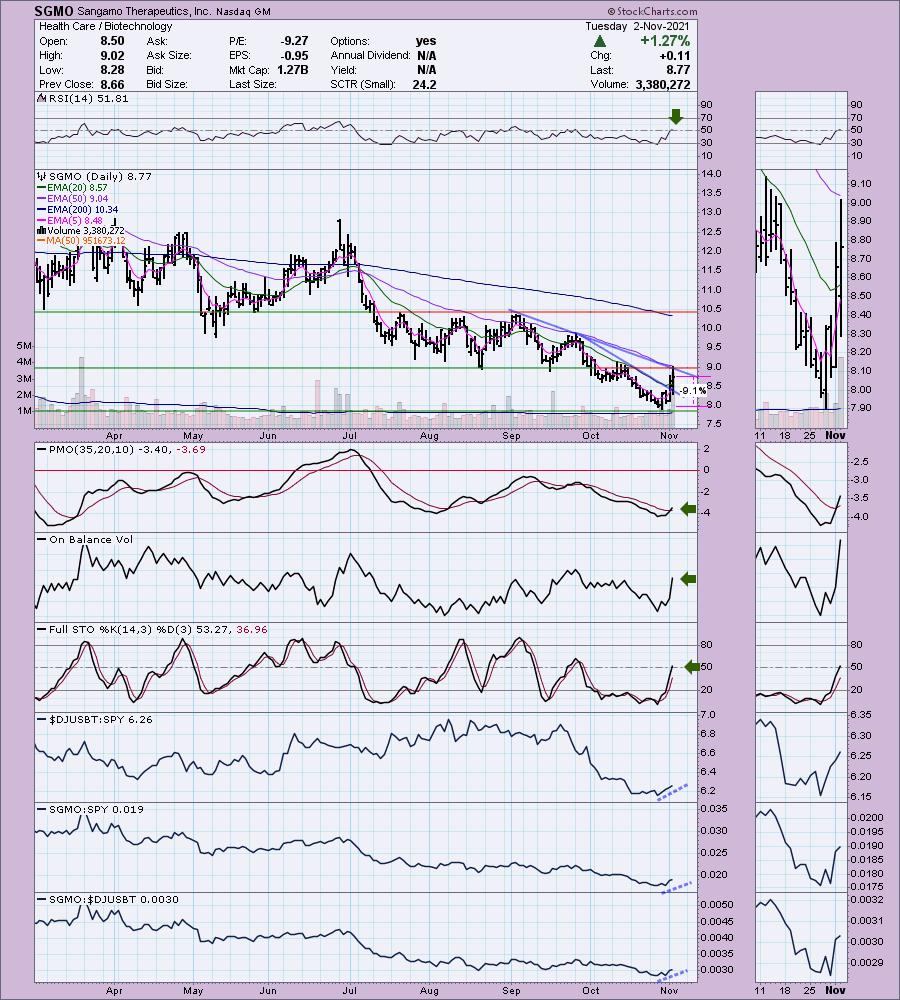
Below are the commentary and chart from Tuesday:
"SGMO was up +1.48% in after hours trading. It has broken out of the short-term declining trend and is poised to breakout of an intermediate-term declining trend that also aligns with the 50-EMA. It is up against overhead resistance at the August/September lows, but given the positive RSI and new PMO BUY signal. I would look for a breakout. Volume really came in on the breakout from the short-term declining trend. Stochastics are now in positive territory and are rising strongly. Relative strength has been mediocre, but it is now trending higher. The stop is deep at 9.1%, but given the weekly chart, I think this one could be a longer-term hold and I tend to use deeper stops on those positions and there is a high likelihood I'll be purchasing this one."
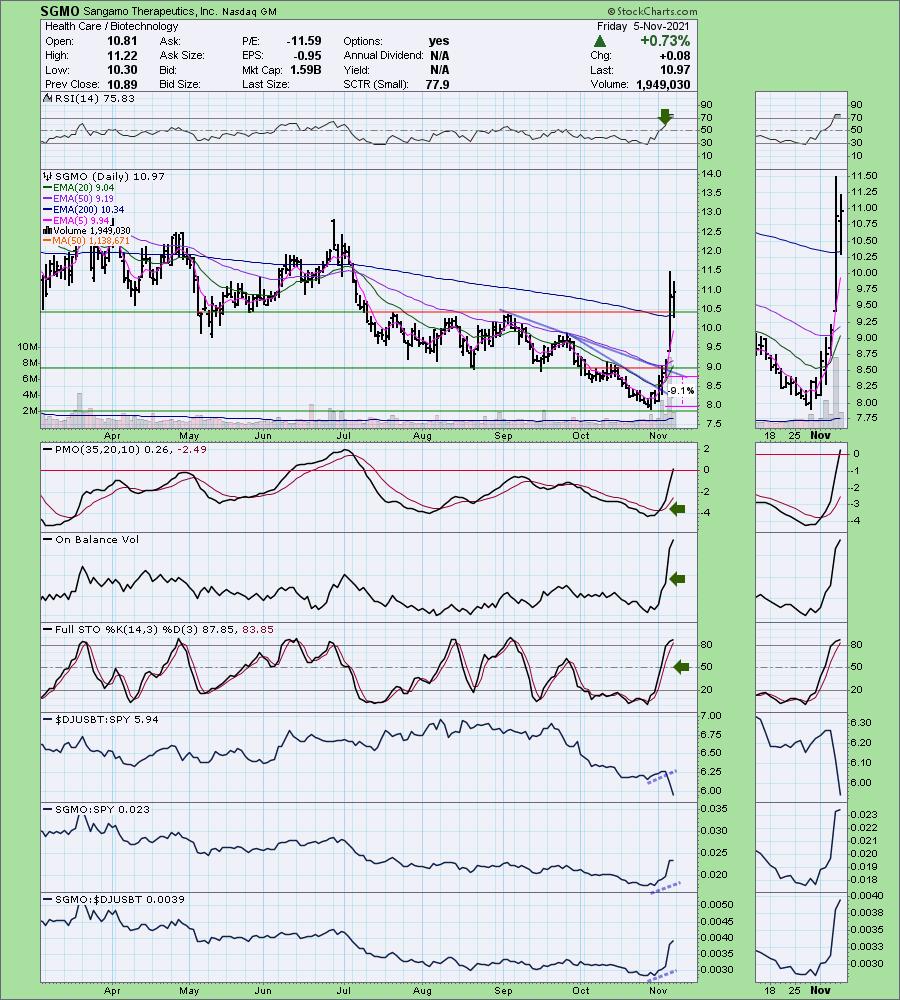
Here is today's chart:
I happened to add SGMO to my portfolio after I presented it and boy, am I pleased. Sometimes it feels like I always pick the worst Diamond in the Rough to put money on. Not this time. I think the chart still has plenty of merit as price is holding above the 200-EMA. The RSI is now overbought which is a problem, but the PMO just hit positive territory and despite the industry group struggling, it continues to outperform. I will likely be setting up a trailing stop of around 8% over the weekend.
Don't forget, on Thursdays I look at reader-requested symbols, so shoot me an email at erin@decisionpoint.com. I read every email I receive and try to answer them all!
Dud:
Y-mAbs Therapeutics, Inc. (YMAB)
EARNINGS: 11/4/2021 (AMC)
Y-mAbs Therapeutics, Inc. is a clinical-stage biopharmaceutical company, which focuses on the development and commercialization of antibody based therapeutic products for the treatment of cancer. Its services include discovery, protein engineering, clinical and regulatory. Y-mAbs Therapeutics was founded by Thomas Gad in April 2015 and is headquartered in New York, NY.
Predefined Scans Triggered: None.
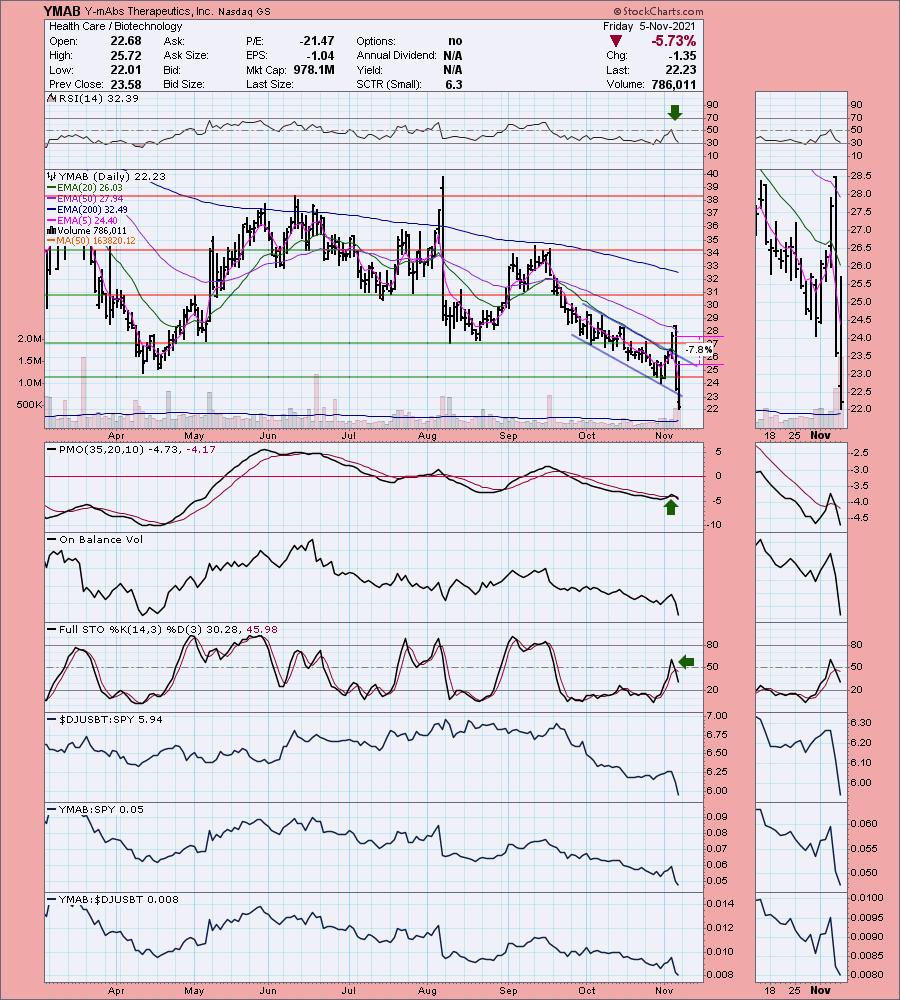
Below are the commentary and chart from Wednesday:
"YMAB is unchanged in after hours trading and does report earnings tomorrow so I'm opening myself up yet again for a surprise move. However, this chart needed to be shown. The RSI just turned positive. Price broke out of a declining trend channel and above the 20-EMA. The PMO had a crossover BUY signal today and volume is already coming in ahead of earnings. Relative strength is improving against the group and the SPY. The stop is set at the closing low in April at 7.8%."
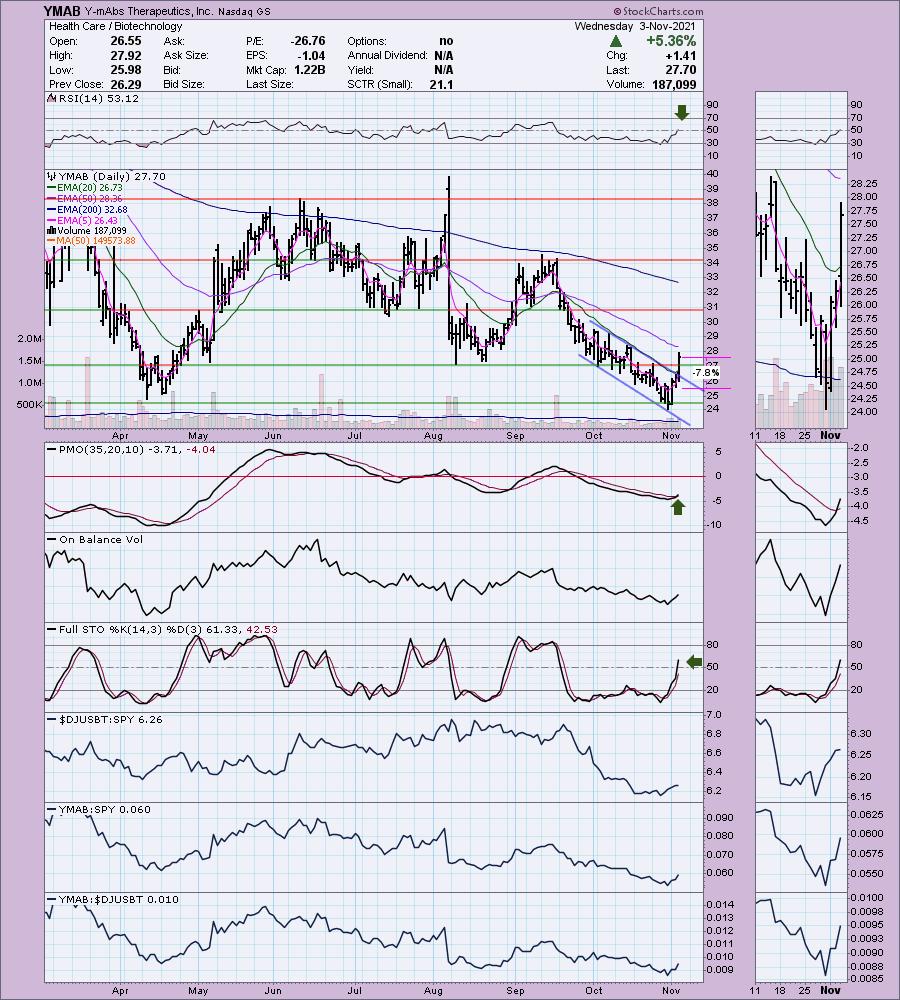
Below is today's chart:
This "Dud" stunk up the joint for sure, but looking at its chart above, this was not the result I would've expected technically. The volatility was dizzying. As I noted in the opening, I opted to take an 8.5% stop rather than 7.8%, simply because it dropped very quickly and if it wasn't a hard stop, there is a high likelihood you would've gotten caught for a bigger loss. This is a reason to avoid holding through earnings. I do note that it is currently up +6.03% right now in after hours trading, but it doesn't make it appetizing.
THIS WEEK's Sector Performance:
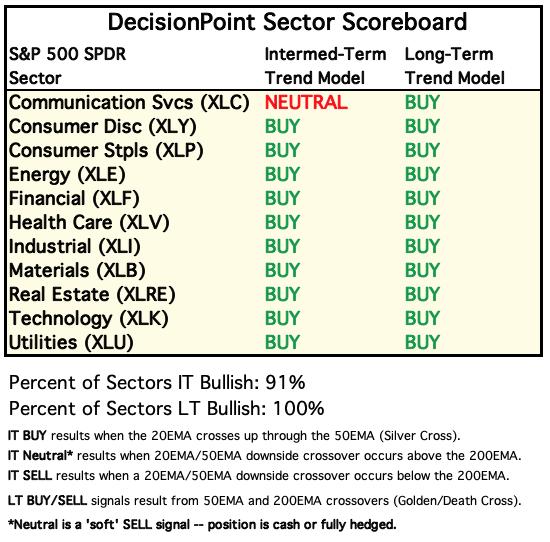
DecisionPoint Sector Scoreboard (Mechanical Trend Model Signals):
Click Here to view Carl's annotated Sector ChartList!
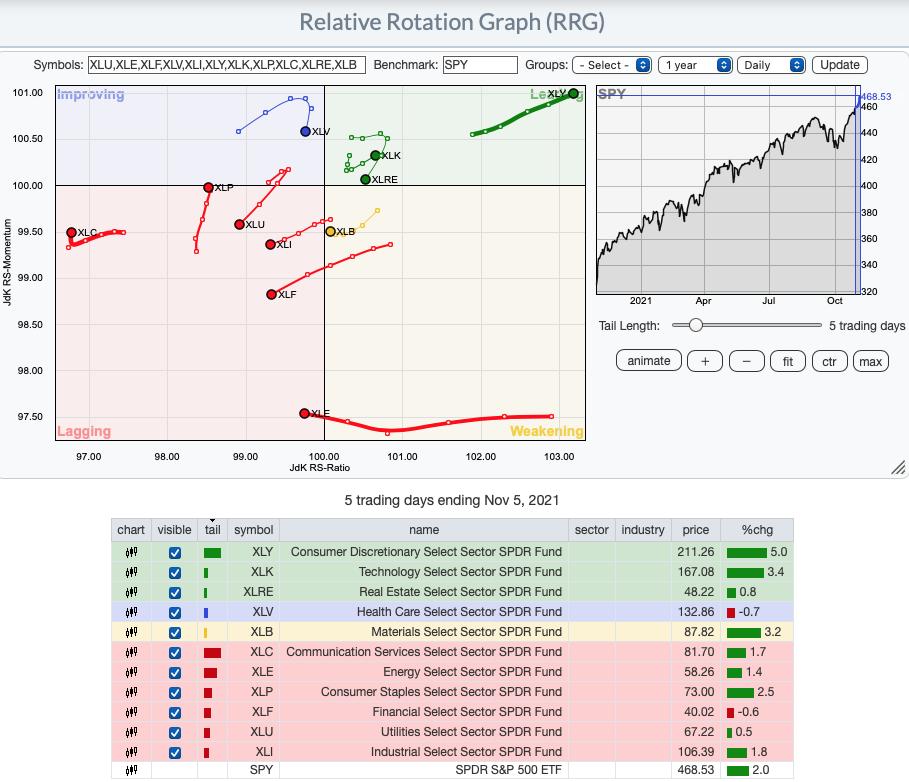
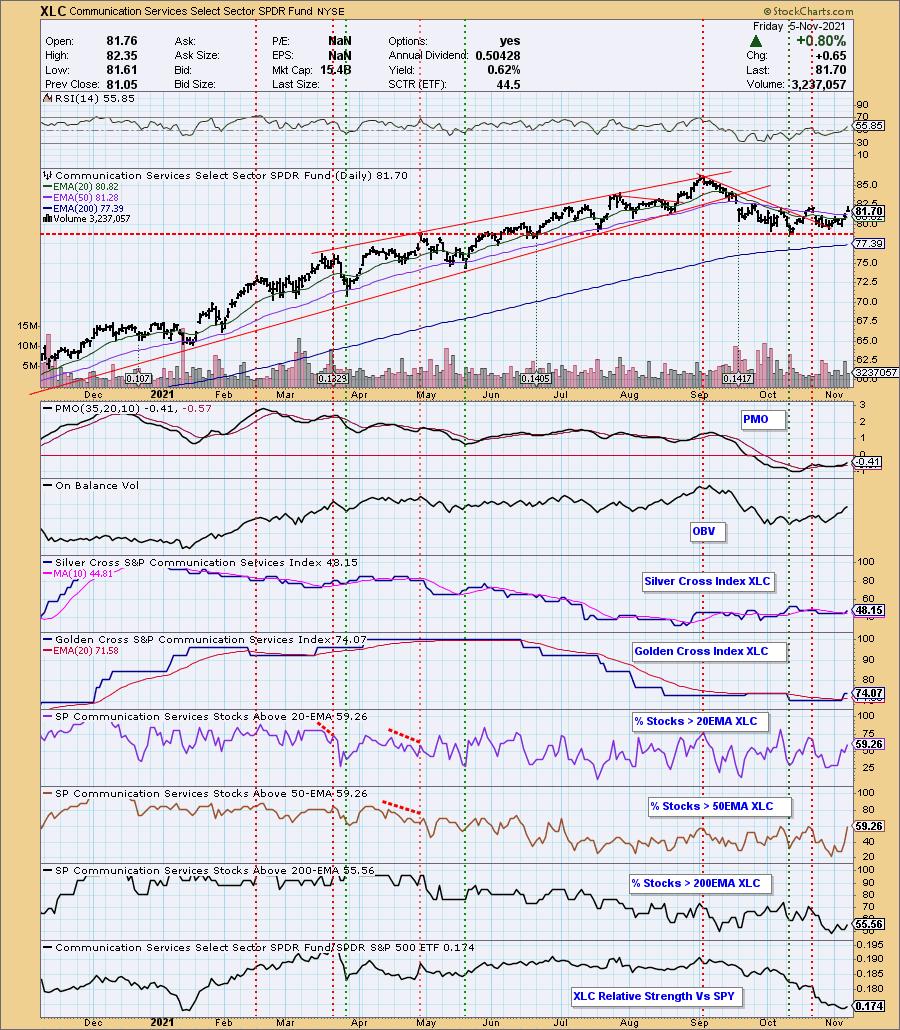
Short-term RRG: XLY continues to outperform and leave the SPY in the dust. XLK is also continuing to show strength. XLP should hit Improving soon and that was a runner-up for "sector to watch" this week. XLV as I noted in the opening, is seeing money rotate out and its direction on the RRG proves that out. Interestingly, the majority in the Diamond Mine voted for XLI as "sector to watch" but we didn't have the luxury of updated participation on the sector charts. XLC is the clear winner for me based on the improvement in participation and rising Silver Cross Index (SCI). XLC has switched directions and is headed north toward Improving.
Sector to Watch: Communication Services (XLC)
I think all of you will agree that this is a sector with new momentum. I would prefer that it had broken above resistance at the October highs, but we do have a rounded bottom which is a bullish basing pattern. The RSI has moved into positive territory and the PMO generated a crossover BUY signal this week. Volume is coming in strong. The SCI is rising and its percentage is much lower than %Stocks > 20/50-EMAs so we have a strong short-term bullish bias. We are even seeing some of the stocks move above their 200-EMAs. This is definitely a sector to watch next week!
Industry Group to Watch: Broadcasting & Entertainment ($DJUSBC)
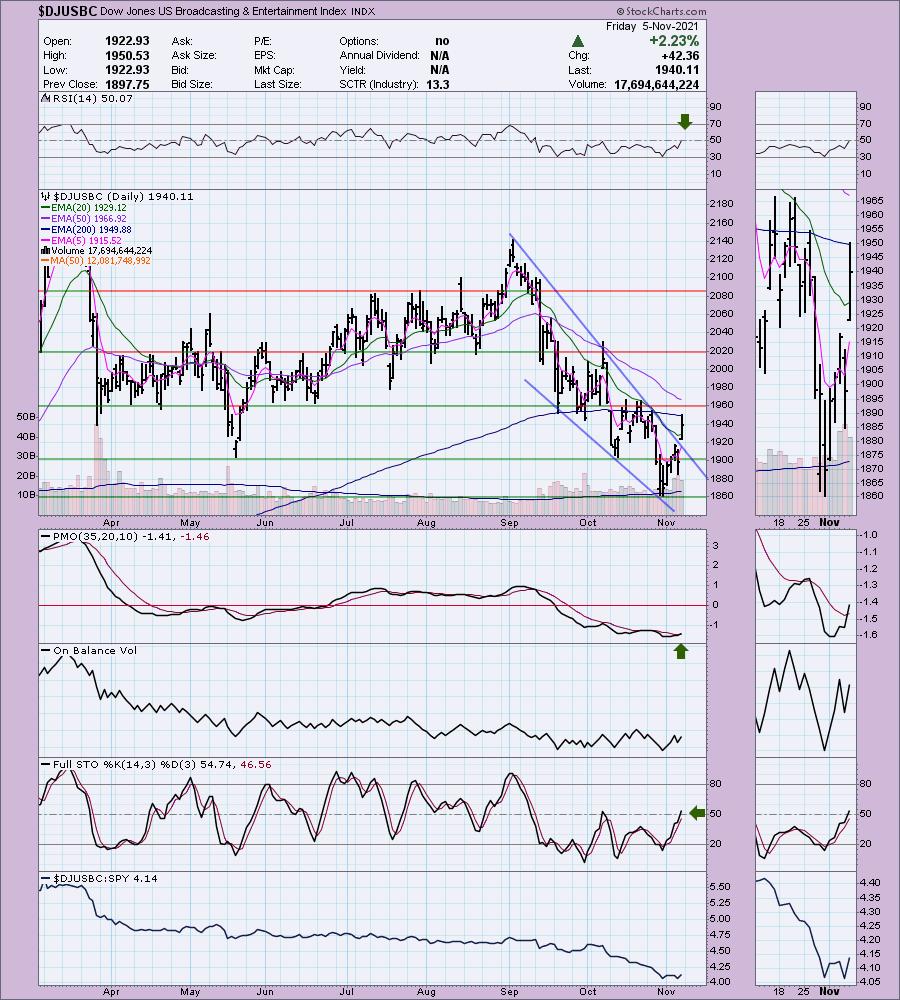
I love this chart as it is really only just beginning to look bullish. We have a breakout from a bullish falling wedge. The RSI just moved into positive territory. The PMO triggered a crossover BUY signal today and Stochastics are rising after reaching positive territory above net neutral (50). There are areas of overhead resistance that need to be dealt with. The 50/200-EMAs are two and resistance at the April-June lows. Given the bullish setup on the chart, I believe we will see that breakout.
Go to our Sector ChartList on DecisionPoint.com to get an in depth view of all the sectors.
Technical Analysis is a windsock, not a crystal ball.
Have a great weekend & Happy Charting! Next Diamonds Report is Tuesday 11/9.
- Erin
erin@decisionpoint.com
Full Disclosure: I'm about 85% exposed to the market.
Watch the latest episode of DecisionPoint with Carl & Erin Swenlin on Mondays 7:00p EST or on the DecisionPoint playlist on the StockCharts TV YouTube channel here!
NOTE: The stocks reported herein are from mechanical trading model scans that are based upon moving average relationships, momentum and volume. DecisionPoint analysis is then applied to get five selections from the scans. The selections given should prompt readers to do a chart review using their own analysis process. This letter is not a call for a specific action to buy, sell or short any of the stocks provided. There are NO sure things or guaranteed returns on the daily selection of "diamonds in the rough."
Helpful DecisionPoint Links:
DecisionPoint Shared ChartList and DecisionPoint Chart Gallery
Price Momentum Oscillator (PMO)
Swenlin Trading Oscillators (STO-B and STO-V)
(c) Copyright 2021 DecisionPoint.com