
The DecisionPoint Diamond scans were overflowing on today's strong upside move in the market. I did find a theme and after reviewing the chart of USO I decided to run with it today. I have plenty of "Stocks to Review" some of which are Crude Oil beneficiaries--stocks that should continue to rally as Oil prices begin to reverse upward.
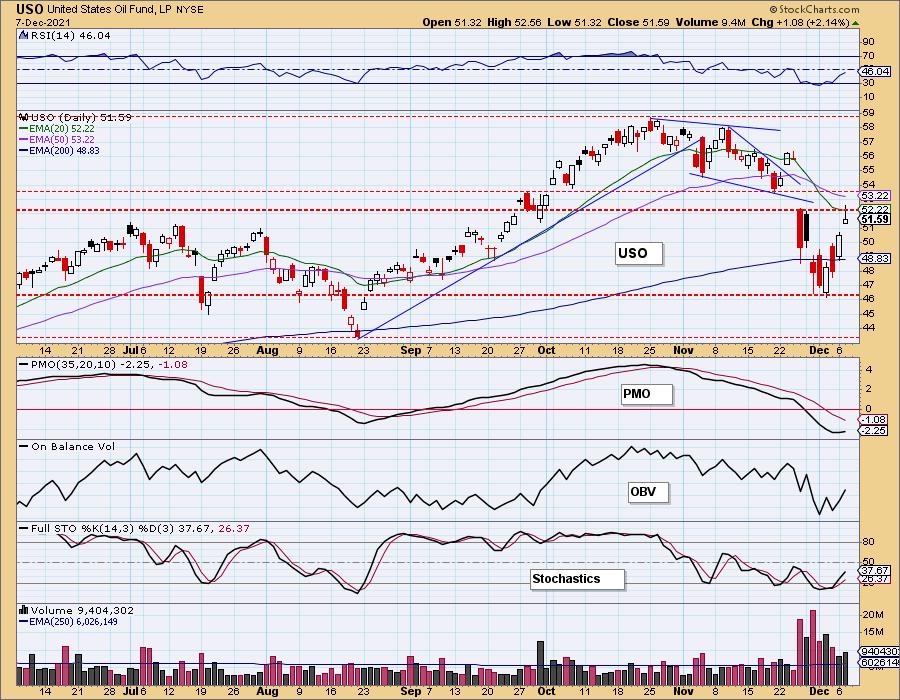
Below is the USO chart. Crude reversed after dipping below the 200-EMA. Yesterday and today's rallies has pushed USO to overhead resistance at the 20-EMA and gap resistance. The chart is beginning to improve with rising RSI and a PMO that is turning back up. Stochastics are rising out of oversold territory. It's somewhat early to know if this resistance level will hold or not, but the conditions are ripening. If price fails at this resistance level, it will temper the bullishness on today's "Diamonds in the Rough". I wouldn't be doing any overnight limit orders until we see how the Crude Oil performs tomorrow.
Today's "Diamonds in the Rough": BKR, BPMP and XES
"Stocks to Review": RC, BIP, DIN, ESTA, HWM, NOV, SCSC, PICK, TTE, SMRT, XOP and IEO.

RECORDING LINK Wednesday (12/3):
Topic: DecisionPoint Diamond Mine (12/3/2021) LIVE Trading Room
Start Time: Dec 3, 2021 09:00 AM
Meeting Recording Link.
Access Passcode: December*3
REGISTRATION FOR Friday 12/10 Diamond Mine:
When: Dec 10, 2021 09:00 AM Pacific Time (US and Canada)
Topic: DecisionPoint Diamond Mine (12/10/2021) LIVE Trading Room
Register in advance for this webinar HERE.
Save the registration confirmation email with login instructions in case Zoom doesn't notify you in time.

Free DP Trading Room (11/22) RECORDING LINK:
Topic: DecisionPoint Trading Room
Start Time: Dec 6, 2021 09:00 AM
Meeting Recording Link.
Access Passcode: December@6
For best results, copy and paste the access code to avoid typos.
Welcome to DecisionPoint Daily Diamonds, wherein I highlight ten "Diamonds in the Rough" per week. These are selected from the results of my DecisionPoint scans, which search for stocks that could benefit from the trend and condition of the market. Remember, these are not recommendations to buy or sell, but are the most interesting of the stocks that surfaced in my scans. My objective is to save you the work of the initial, tedious culling process, but you need to apply your own analysis to see if these stocks pique your interest as well. There are no guaranteed winners here!
Baker Hughes Company (BKR)
EARNINGS: 1/20/2022 (BMO)
Baker Hughes Co. is a holding company. The firm engages in the provision of oilfield products, services, and digital solutions. It operates through the following segments: Oilfield Services (OFS), Oilfield Equipment (OFE), Turbomachinery & Process Solutions (TPS) and Digital Solutions (DS). The OFS segment provides products and services for on and offshore operations across the lifecycle of a well, ranging from drilling, evaluation, completion, production, and intervention. The OFE segment provides a broad portfolio of products and services required to facilitate the safe and reliable flow of hydrocarbons from the subsea wellhead to the surface production facilities. The TPS segment provides equipment and related services for mechanical-drive, compression and power-generation applications. The DS segment provides operating technologies helping to improve the health, productivity, and safety of asset intensive industries and enable the Industrial Internet of Things. The company was founded in April, 1987 and is headquartered in Houston, TX.
Predefined Scans Triggered: New CCI Buy Signals.
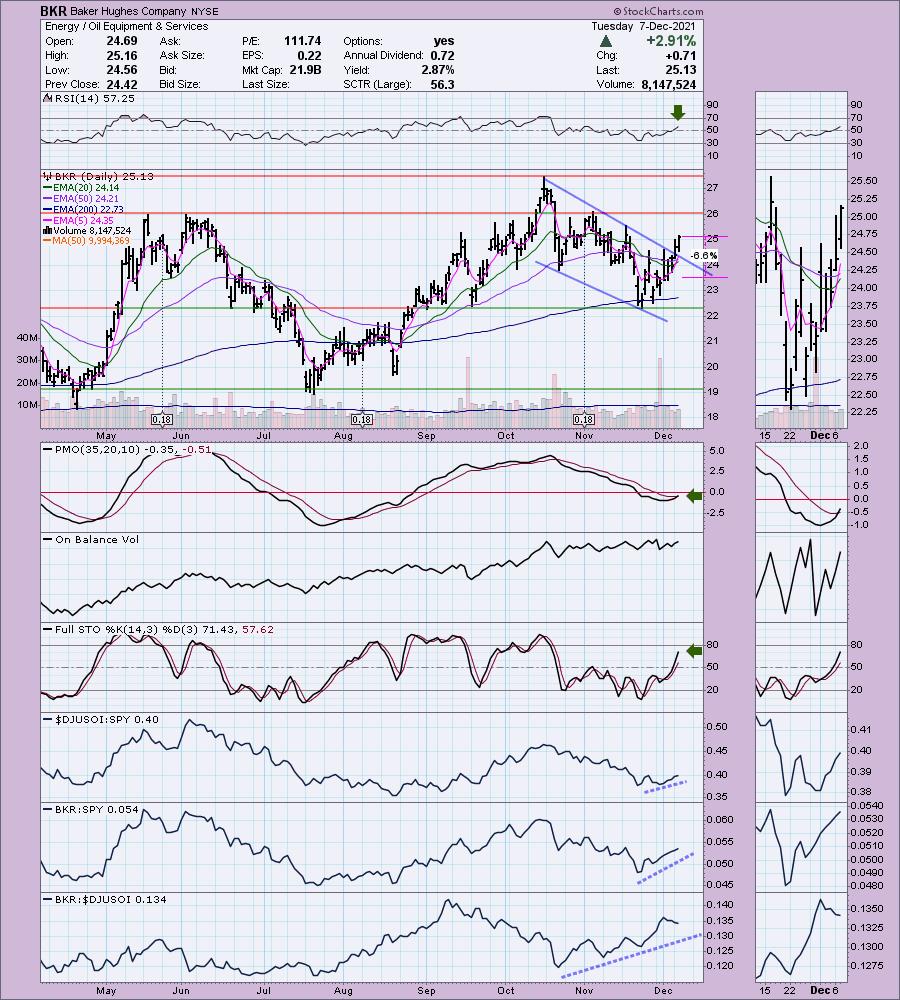
BKR is up +0.48% in after hours trading. Price pulled back to the 200-EMA and is now rallying past the key moving averages. This bounce also came off horizontal support at the mid-September low and late June lows. The 5-EMA crossed above the 20-EMA giving it a ST Trend Model BUY signal. The declining trend has now been broken with yesterday and today's rallies. That breakout also confirms the bullish falling wedge. The RSI is positive and the PMO just had a crossover BUY signal. Stochastics are bullish. Relative strength shows that this industry group has begun to outperform and BKR is a strong member of the group given its outperformance. The stop is set below the October lows.
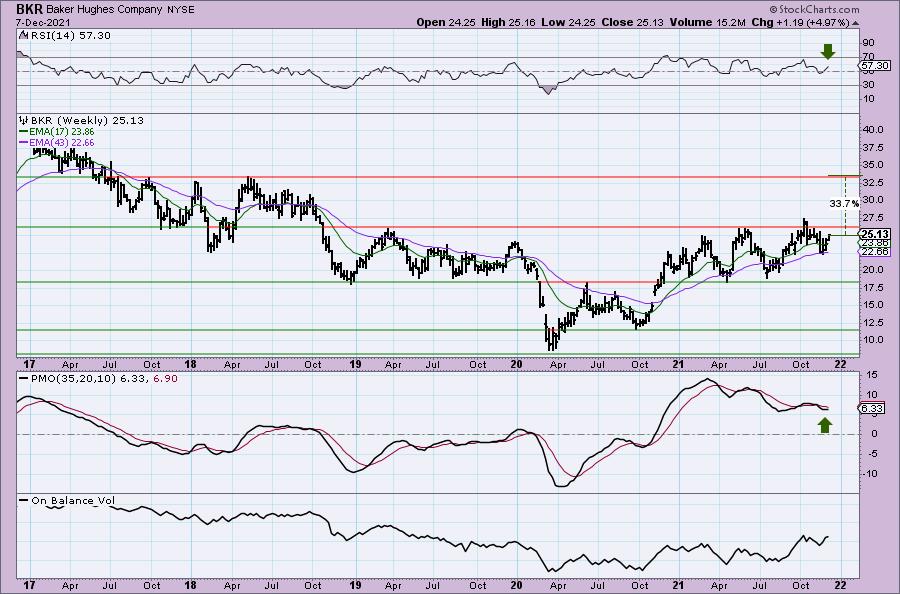
The weekly PMO is turning back up as price bounces off the 43-week EMA. This has been its personality since breaking out at the end of 2020. The weekly RSI is positive. If price can break above resistance, I expect to see an over 33% gain.
BP MidStream Partners LP (BPMP)
EARNINGS: 2/24/2022 (BMO)
BP Midstream Partners LP engages in the operation, development, and acquisition of pipelines and other midstream assets. Its assets consist of interests in entities that own crude oil, natural gas, refined products and diluent pipelines, and refined product terminals. The company was founded on May 22, 2017 and is headquartered in Houston, TX.
Predefined Scans Triggered: Elder Bar Turned Green, Bullish MACD Crossovers and Entered Ichimoku Cloud.
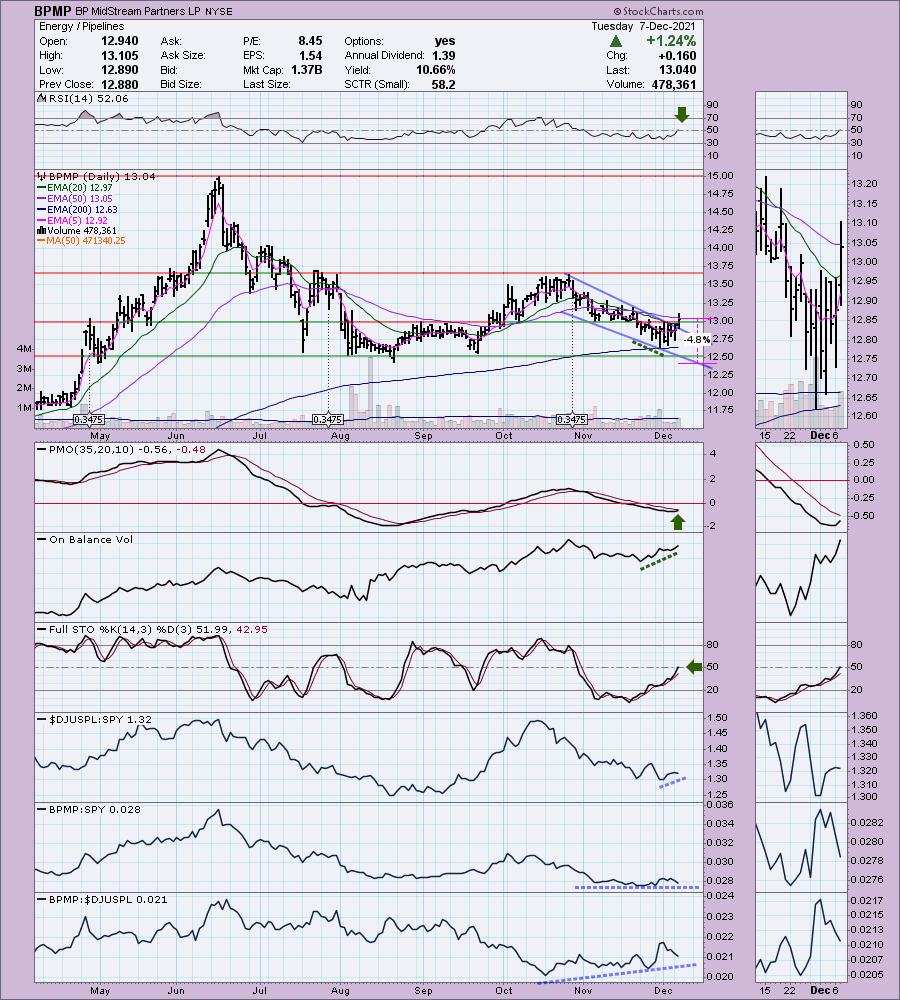
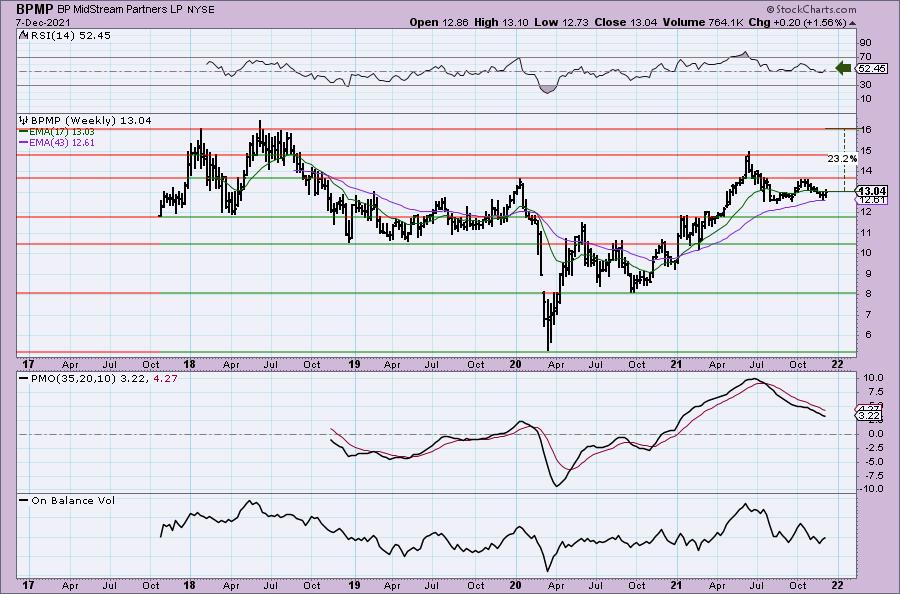
BPMP is down -0.31% in after hours trading. This is an "LP" and requires K-1 filing for taxes. My brokerage takes care of it so I don't find it to be a limitation. I love the breakout from this bullish falling wedge. The breakout also takes it above the 20-EMA which we haven't seen since it began its downtrend. The RSI just hit positive territory. The PMO has turned up and Stochastics are rising and also hit positive territory. There is an OBV positive divergence. Relative strength studies are respectable. The stop can be set thinly at 4.8%.
The weekly RSI has turned up in positive territory. I don't like the PMO, but I do like the bounce coming off the 43-week EMA. If overhead resistance is overcome, I think we could see this one test all-time highs.
SPDR S&P Oil & Gas Exploration & Production ETF (XOP)
EARNINGS: N/A
XOP tracks an equal-weighted index of companies in the US oil & gas exploration & production space.
Predefined Scans Triggered: Elder Bar Turned Green, Parabolic SAR Buy Signals and P&F Double Top Breakout.
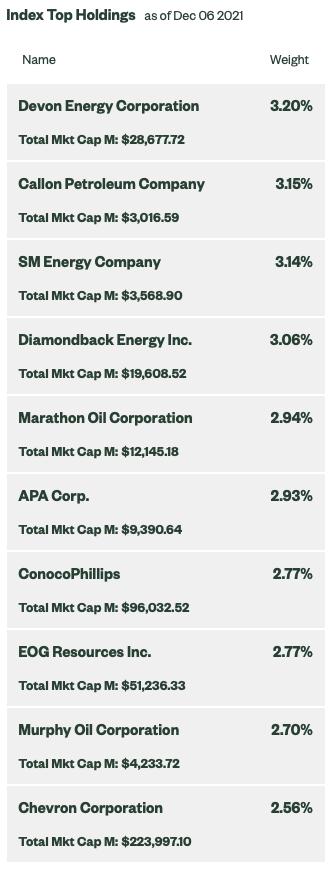
XOP is up +0.16% in after hours. You'll notice the top holding is DVN which I covered last week and was lukewarm about, well Joe, maybe you were ahead of the game with your request. Today, price broke out strongly above both the 20/50-EMAs. This rally also pushed XOP out of a steep declining trend channel. The RSI just hit positive territory and the PMO is turning up. Stochastics are rising again, but aren't yet in positive territory. They faked us out last time, so be careful. It hasn't been outperforming but it appears it is ready to given relative strength is beginning to turn back up. I have the stop set at gap support from the gap back in late September.
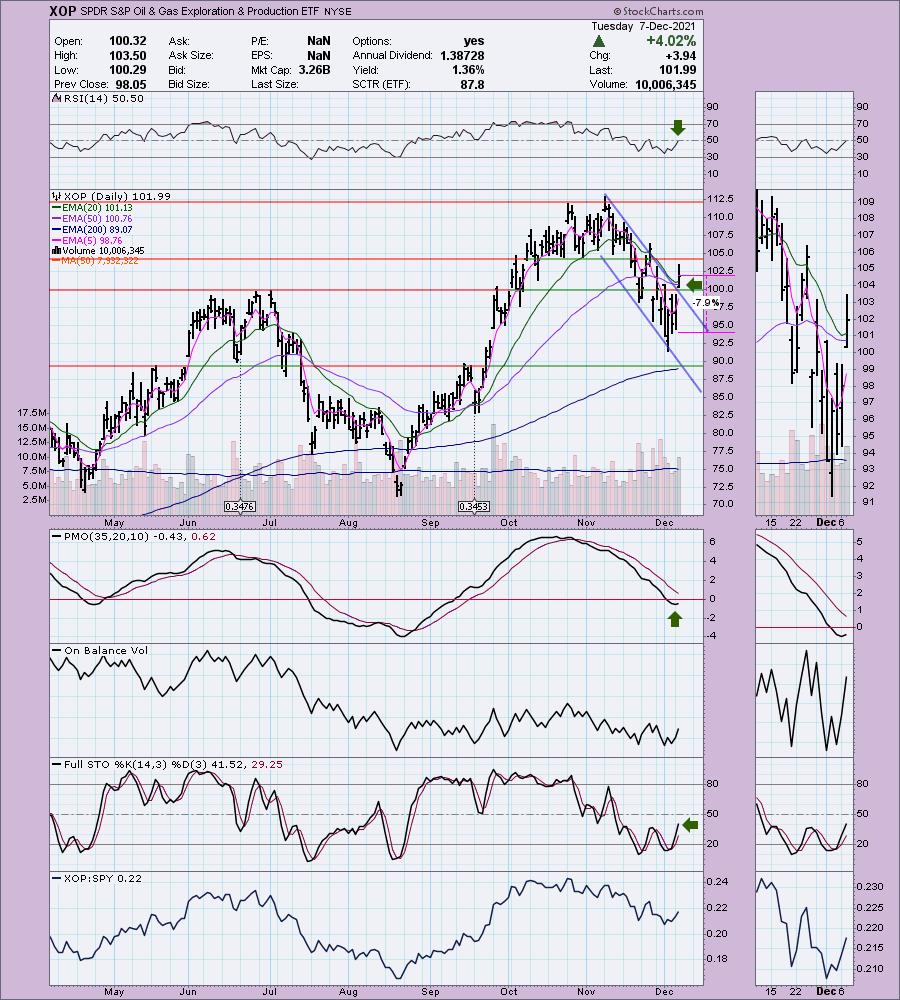
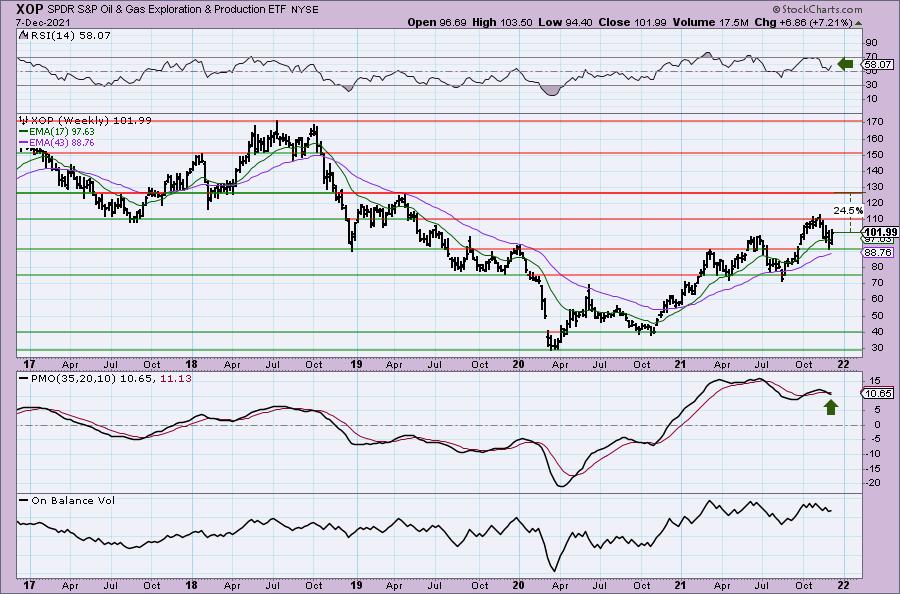
This was a very strong level of support, but conversely it is about to hit strong resistance at the 2017 low. The weekly PMO has decelerated and the weekly RSI has turned up in positive territory. Upside potential if it can reach the 2019 high is over 24%.
Don't forget, on Thursdays I look at reader-requested symbols, click HERE to shoot me an email. I read every email I receive and try to answer them all!
Current Market Outlook:
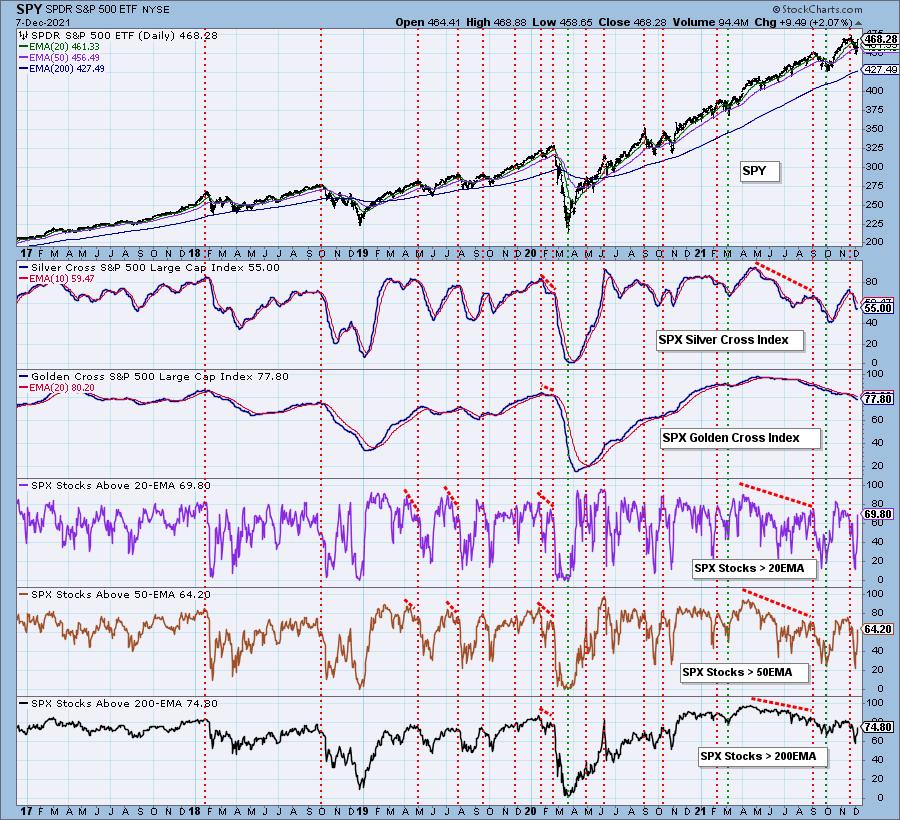
Market Environment: It is important to consider the odds for success by assessing the market tides. The following chart uses different methodologies for objectively showing the depth and trend of participation for intermediate- and long-term time frames.
- The Silver Cross Index (SCI) shows the percentage of SPX stocks on IT Trend Model BUY signals (20-EMA > 50-EMA)
- The Golden Cross Index (GCI) shows the percentage of SPX stocks on LT Trend Model BUY signals (50-EMA > 200-EMA)
Don't forget that as a "Diamonds" member, you have access to our GCI/SCI curated ChartList on DecisionPoint.com. You'll find it under "Members Only" links on the left side on the Blogs and Links Page.
Here is the current chart:
Full Disclosure: I'm 15% invested and 85% is in 'cash', meaning in money markets and readily available to trade with.
I'm required to disclose if I currently own a stock and/or may buy it within the next 72 hours.
Technical Analysis is a windsock, not a crystal ball.
Happy Charting!
- Erin
erin@decisionpoint.com
Watch the latest episode of DecisionPoint with Carl & Erin Swenlin on Mondays 7:00p EST or on the DecisionPoint playlist on the StockCharts TV YouTube channel here!
NOTE: The stocks reported herein are from mechanical trading model scans that are based upon moving average relationships, momentum and volume. DecisionPoint analysis is then applied to get five selections from the scans. The selections given should prompt readers to do a chart review using their own analysis process. This letter is not a call for a specific action to buy, sell or short any of the stocks provided. There are NO sure things or guaranteed returns on the daily selection of "Diamonds in the Rough."
Helpful DecisionPoint Links:
DecisionPoint Shared ChartList and DecisionPoint Chart Gallery
Price Momentum Oscillator (PMO)
Swenlin Trading Oscillators (STO-B and STO-V)
For more links, go to DecisionPoint.com