
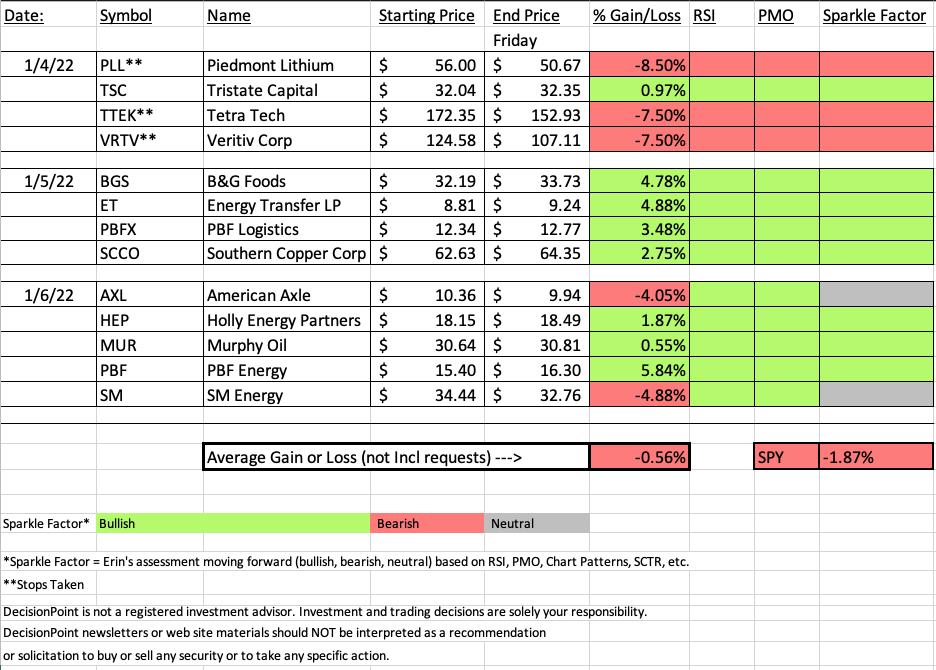
On Wednesday I presented my favorite high yield stocks as "Diamonds in the Rough". All four of those stocks finished higher with the biggest gain at +4.88% and lowest gain +2.75%. The move into value versus growth continues as the tech-heavy Nasdaq was creamed this week. The $COMPQ closed -4.53% lower this week and the $NDX closed down -4.46%. This is compared to the $SPX which finished lower by only -1.87%.
The bad news is that Tuesday's picks tanked. I went with two Industrials, a Materials stock and a Bank. The bank finished slightly higher, but the other three all were stopped out by today. You'll note the asterisks on the symbols in the spreadsheet. In this case, I use the stop level I posted as the loss for the week.
This week's "Darling" was yesterday's reader requested, PBF which was up +5.84% today. A close second were BGS and ET from Wednesday.
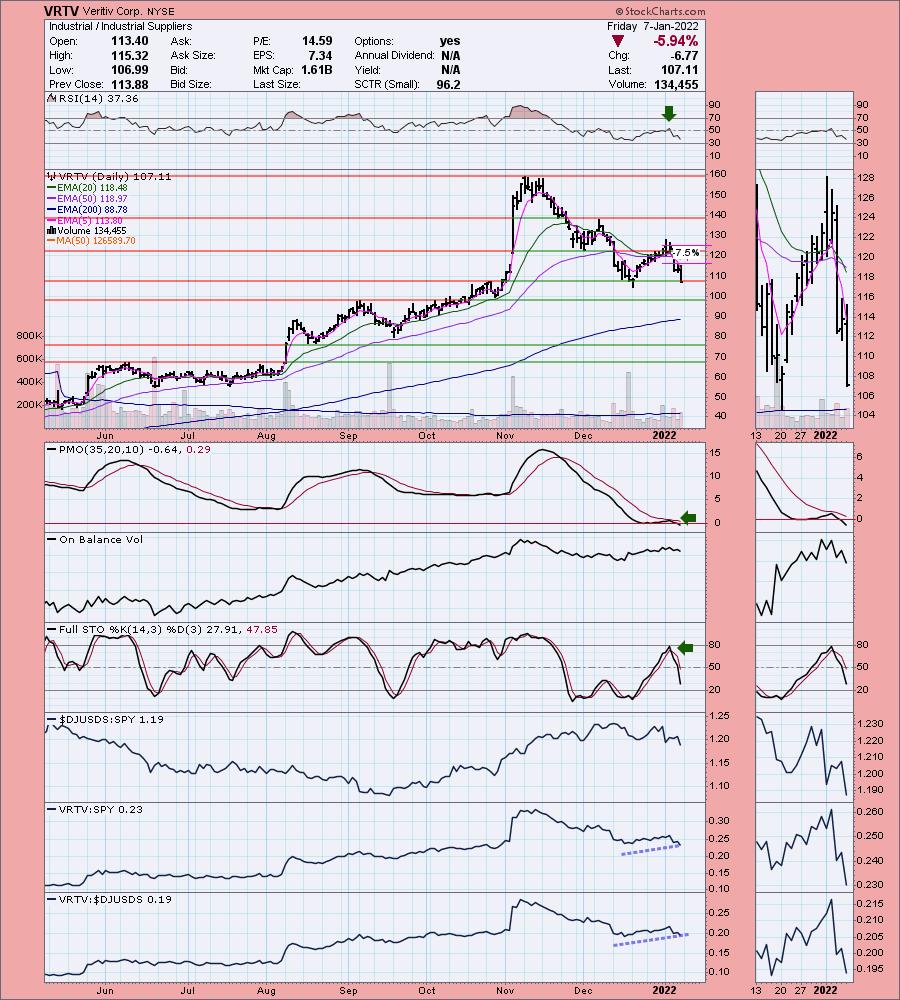
This week's "Dud" was difficult to choose since we had three stopped out. Ultimately the biggest loser was Veritiv Corp (VRTV) which finished the week -14.02%. As noted on the spreadsheet, I took the 7.5% stop I had listed for it.
I have picked my "sector to watch" and "industry group" to watch. I went with Financials, but Energy was a very close second. The Pipelines industry group is definitely my favorite right now, but Banks still look good too.
Below you'll find the latest Diamond Mine recording link.
Have a great weekend! The next Diamonds report will be on Tuesday of next week.

RECORDING LINK (1/7/2022):
Topic: DecisionPoint Diamond Mine (1/7/2022) LIVE Trading Room
Start Time: Jan 7, 2022 09:00 AM
Meeting Recording Link.
Access Passcode: January@7
REGISTRATION FOR 1/14 Diamond Mine:
When: Jan 14, 2022 09:00 AM Pacific Time (US and Canada)
Topic: DecisionPoint Diamond Mine (1/14/2022) LIVE Trading Room
Register in advance for this webinar HERE.
Save the registration confirmation email with login instructions in case Zoom doesn't notify you in time.

Free DP Trading Room (12/27) RECORDING LINK:
Topic: DecisionPoint Trading Room
Start Time: Jan 3, 2022 09:00 AM
Meeting Recording Link.
Access Passcode: January#3
For best results, copy and paste the access code to avoid typos.
A few items about the spreadsheet: I've put on the spreadsheet whether the RSI is positive (green) or negative (red). The PMO column tells you if it is rising (green) or falling (red). Finally I've added my own "Sparkle Factor" that gives you my assessment going forward, bullish (green), bearish (red) or neutral (gray). The Sparkle Factor is basically my thoughts on whether I expect it to rise or fall. A neutral means it could really go either way so it could be added to a watch list. If you're in a stock I consider "neutral" going forward, the ball is in your court.
Darling:
PBF Energy Inc. (PBF)
EARNINGS: 2/10/2022 (BMO)
PBF Energy, Inc. engages in the operation of a petroleum refiner and supplies unbranded transportation fuels, heating oil, petrochemical feed stocks, lubricants, and other petroleum products in the United States. It operates through the following segments: Refining and Logistics. The Refining segment refines crude oil and other feed stocks into petroleum products. The Logistics segment owns, leases, operates, develops, and acquires crude oil and refined petroleum products terminals, pipelines, storage facilities, and logistics assets. The company was founded on March 1, 2008 and is headquartered in Parsippany, NJ.
Predefined Scans Triggered: Elder Bar Turned Green, Moved Above Upper Keltner Channel, Moved Above Upper Bollinger Band, Moved Above Upper Price Channel, P&F Double Top Breakout and P&F Bearish Signal Reversal.
Below are the commentary and chart from yesterday (1/6):
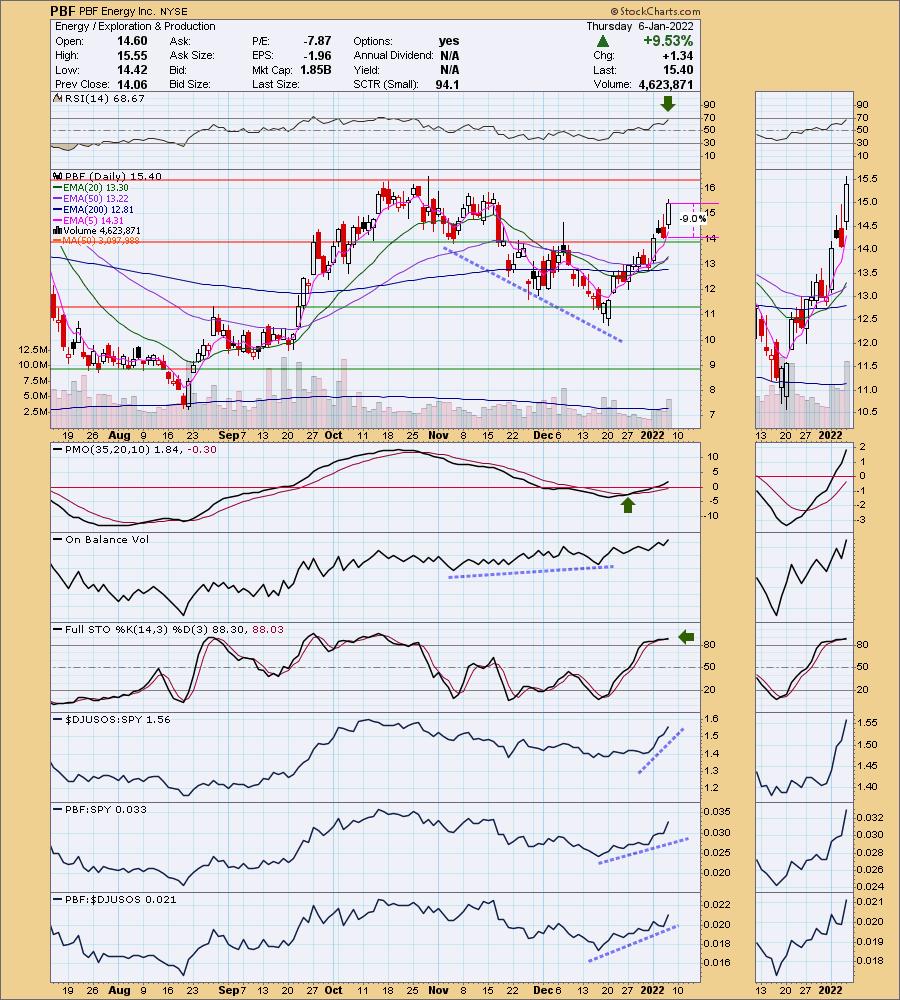
"PBF is up +0.65% in after hours trading. I covered PBF on May 6th 2021. The position was stopped out on the correction that began in late June 2021. We see a strong OBV positive divergence that led into this rally which suggests to me that it will continue past overhead resistance at the October top. Today saw an IT Trend Model "Silver Cross" BUY signal as the 20-day EMA crossed above the 50-day EMA. The PMO is on an oversold crossover BUY signal. The RSI is positive and Stochastics are rising above 80."
Here is today's chart:
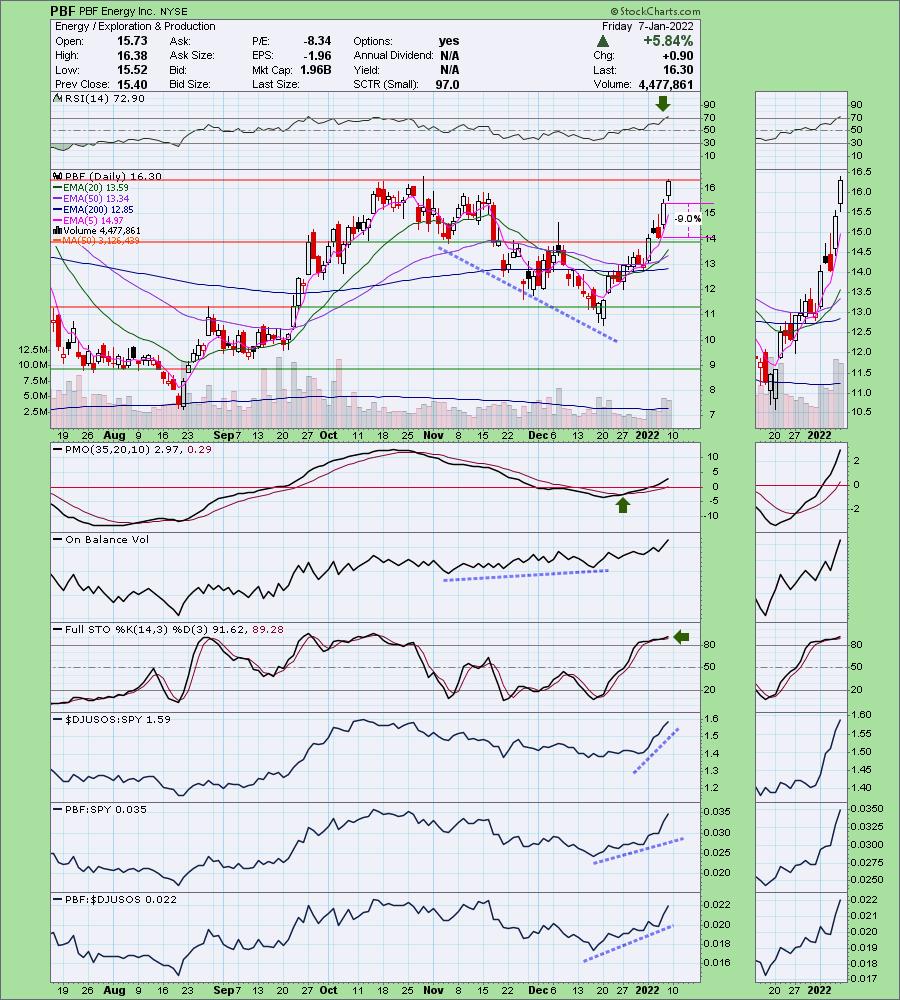
Price broke out today and is already challenging overhead resistance at the October highs. Relative performance is increasing. Given the very positive indicators, I believe there is more room to run on this stock.
Don't forget, on Thursdays I look at reader-requested symbols, so shoot me an email at erin@decisionpoint.com. I read every email I receive and try to answer them all!
Dud:
Veritiv Corp. (VRTV)
EARNINGS: 3/2/2022 (BMO)
Veritiv Corp. engages in business-to-business distributor of print, publishing, packaging, facility solutions, print and publishing products and services. The firm provides logistics and supply chain management solutions to its customers. It operates through the following segments: Print, Publishing, Packaging and Facility Solutions. The Print segment sells and distributes commercial printing, writing, copying, digital, wide format and specialty paper products, graphics consumables and graphics equipment primarily in the U.S., Canada and Mexico. The Publishing segment involves in sale and distribution of coated and uncoated commercial printing papers to publishers, retailers, converters, printers and specialty businesses for use in magazines, catalogs, books, directories, gaming, couponing, retail inserts and direct mail. The Packaging segment provides standard as well as custom and comprehensive packaging solutions for customers based in North America and in key global markets. The Facility Solutions segment sources and sells cleaning, break-room and other supplies such as towels, tissues, wipers and dispensers, can liners, commercial cleaning chemicals, soaps and sanitizers, sanitary maintenance supplies and equipment, safety and hazard supplies, and shampoos and amenities primarily in the U.S., Canada and Mexico. The company was founded in July 10, 2013 and is headquartered in Atlanta, GA.
Predefined Scans Triggered: None.
Below are the commentary and chart from Tuesday (1/4):
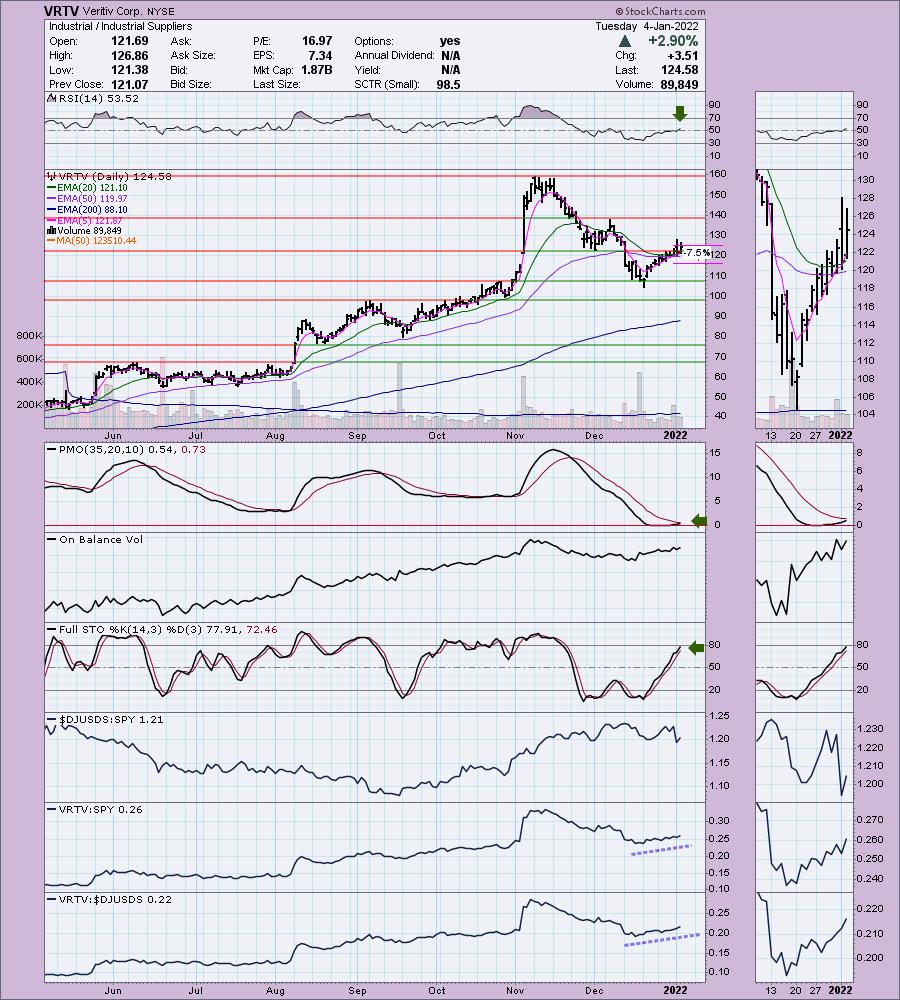
"VRTV is unchanged in after hours trading. The PMO turned around above the zero line and is nearing a crossover BUY signal. I always like to see a PMO BUY signal arrive just above the zero line. Stochastics are rising strongly and the RSI just hit positive territory above net neutral (50). The group's performance has been hit or miss over the past two months, but since mid-December VRTV has been outperforming both the group and the SPY. The stop is set just under prior gap resistance from early November. It is also aligned below the 20/50-day EMAs."
Below is today's chart:
This one really surprised me. The breakout looked solid and the indicators were lined up beautifully as the RSI had just turned positive and the PMO was about to trigger a crossover BUY signal. It's also an Industrial and that sector closed up this week. Support is now being compromised at the closing December low. This doesn't look like a reversal point, so steer clear.
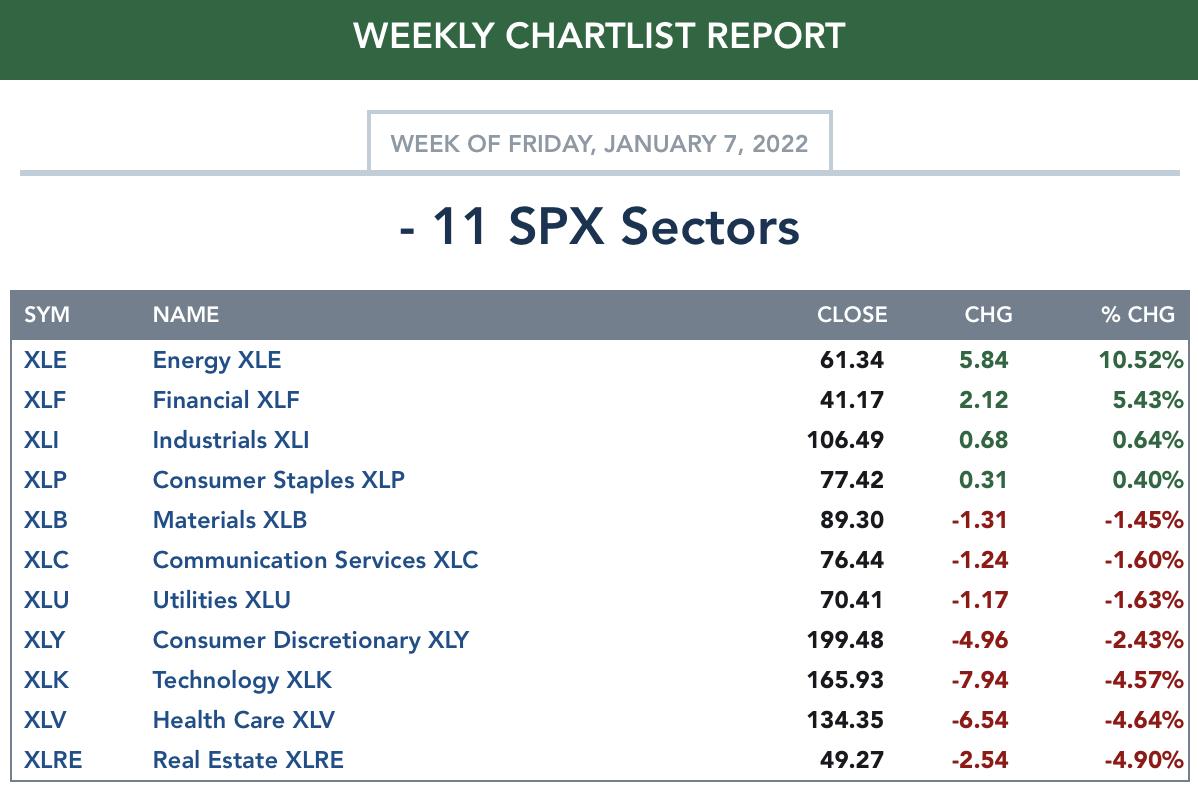
THIS WEEK's Sector Performance:
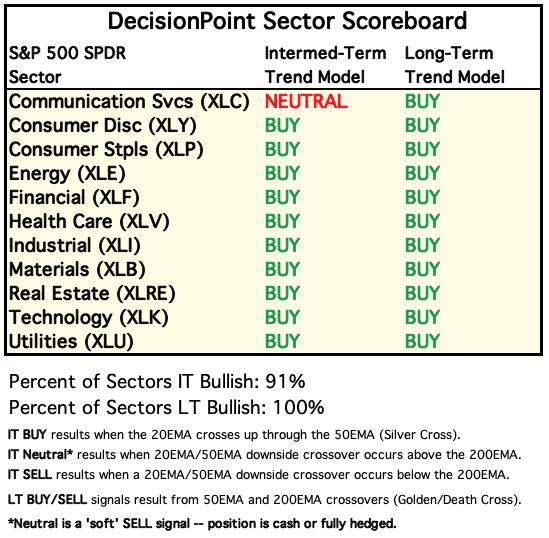
DecisionPoint Sector Scoreboard (Mechanical Trend Model Signals):
Click Hereto view Carl's annotated Sector ChartList!
Short-term (Daily) RRG: It is easy to see which sectors are the most bullish. XLE, XLI, XLF and XLB are all within Leading and continue to head in the bullish northeast direction. The defensive sectors are all residing in the Weakening quadrant, but both XLP and XLU have reversed direction and could see the Leading quadrant early next week. XLRE and XLV are still Weakening, but are looking bearish as they make their way toward Lagging. XLC and XLK are the clear short-term laggards. With the emphasis on value stocks, those two areas will likely suffer further. XLY is in Improving, but appears to be avoiding the Leading quadrant.
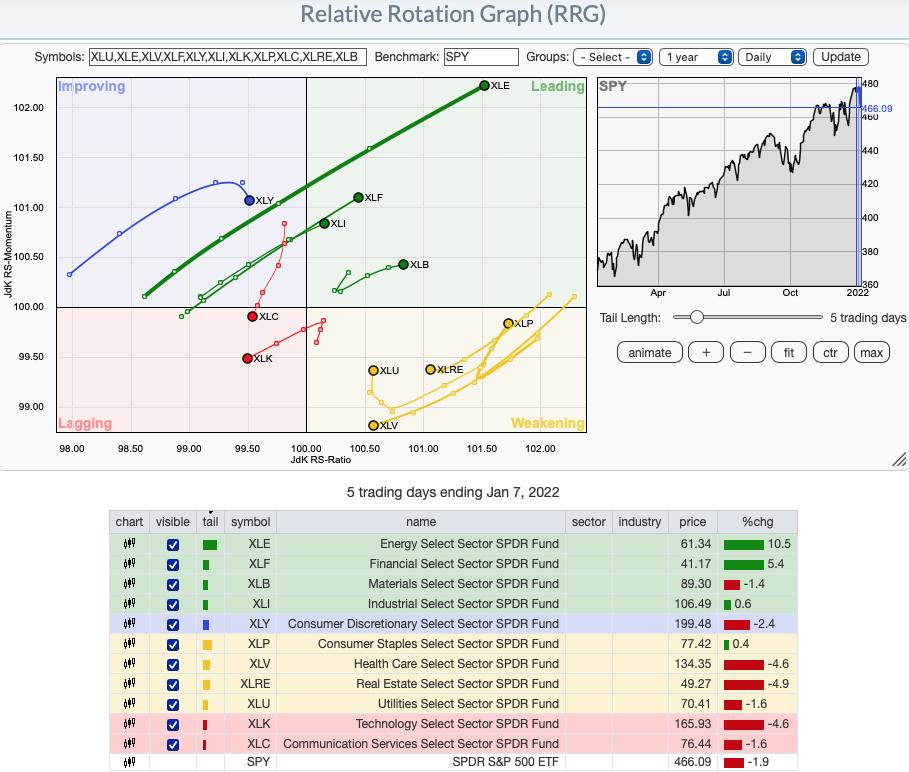
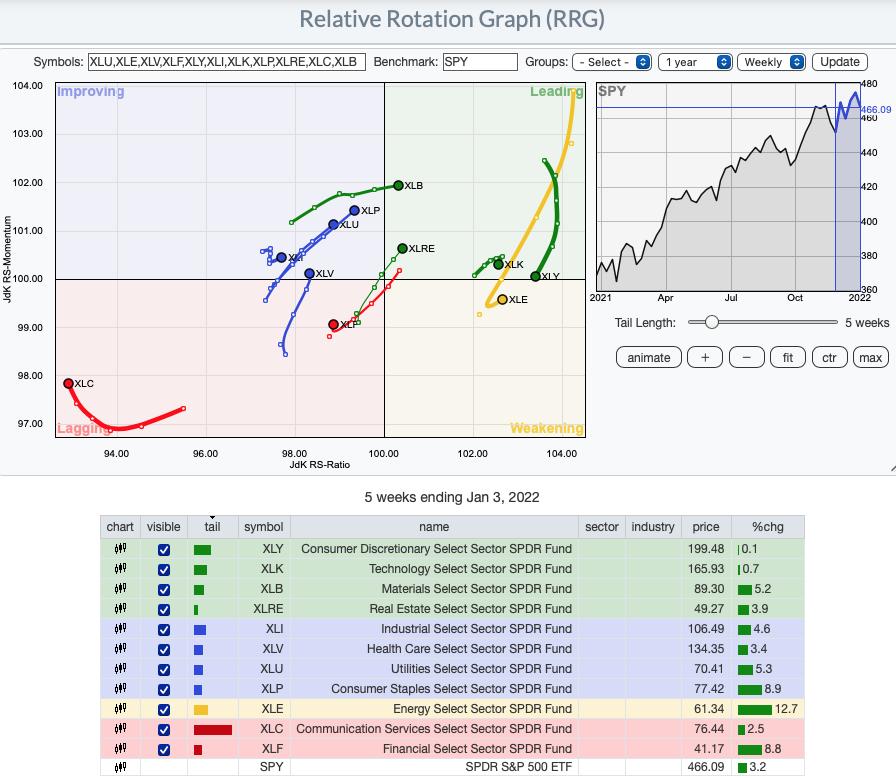
Intermediate-Term (Weekly) RRG: In the longer term, XLC is still Lagging, but it is at least not traveling in the bearish southwest direction. XLK may be in the Leading quadrant, but it has reversed course and is moving toward Weakening. XLY should hit Weakening next week. Interestingly, in the intermediate term, all sectors with the exception of XLC, XLK and XLY have bullish northeast headings. The most bullish is actually XLE which has reversed course and is hooking back toward Leading. That is the set up Julius de Kempenaer (creator of RRG) looks for--northeast hook from Weakening into Leading.
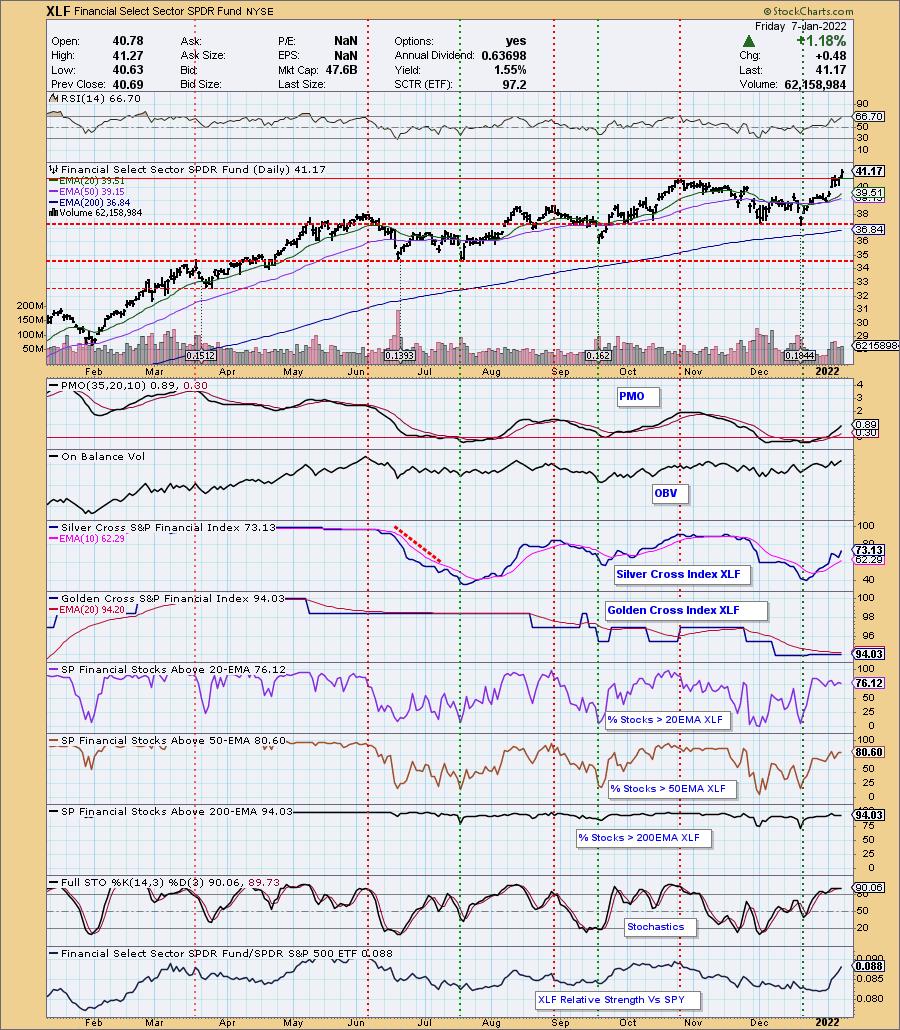
Sector to Watch: Financials (XLF)
The Energy sector (XLE) was a close second, but participation was 100% across the board which is good, but I want to find newer momentum. I was swayed to pick XLF due to its strong breakout today. Rising rates tend to help this sector and with rates headed higher quickly, I believe this is the winning sector. The RSI is positive and rising. The PMO is rising on an oversold BUY signal and has reached above zero. The SCI has a bottom above its signal line which is especially bullish. Participation of stocks > 20/50-day EMAs is strong and only somewhat overbought. Long term, The GCI is very healthy with %stocks > 200-EMA with the same reading. Stochastics are above 80 and oscillating suggesting internal strength. Finally, that relative strength line is very bullish.
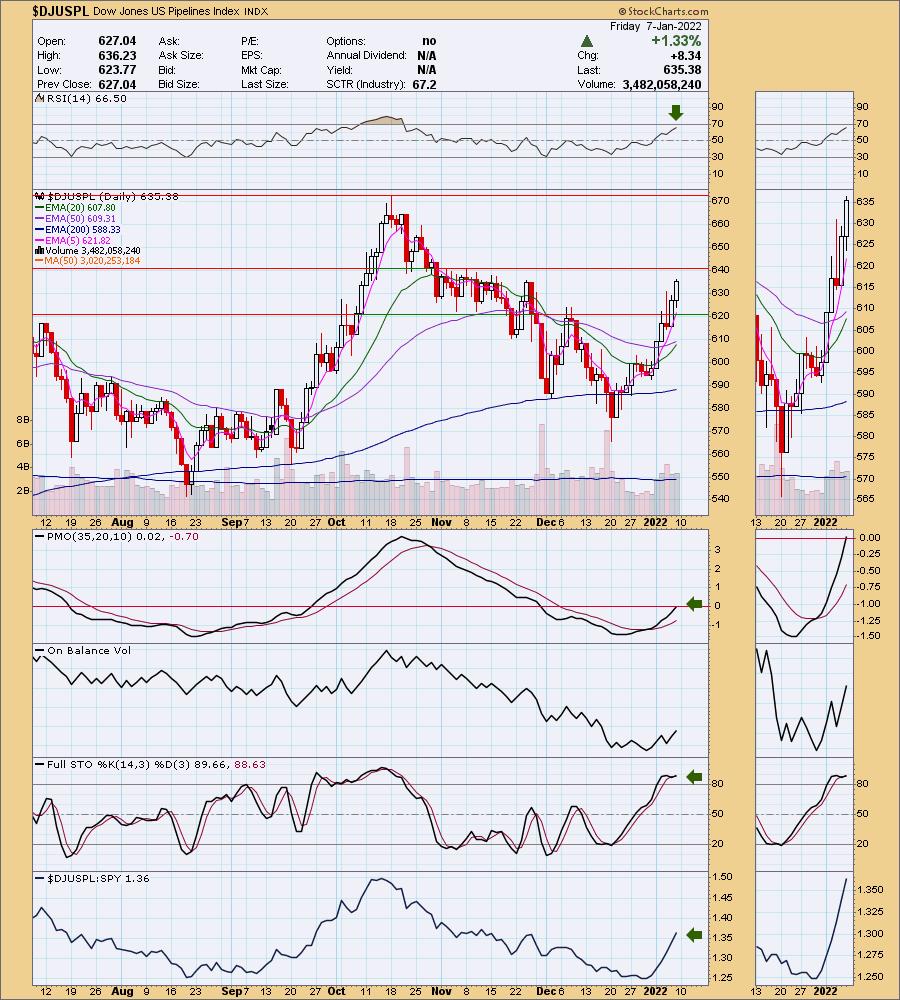
Industry Group to Watch: Miners ($DJUSPL)
The group has been on fire, but the chart isn't showing overbought readings. The RSI is positive and today, the PMO hit positive territory above the zero line. Stochastics are oscillating above 80 and it has really begun to outperform the SPY by a mile.
Go to our Sector ChartList on DecisionPoint.com to get an in depth view of all the sectors.
Technical Analysis is a windsock, not a crystal ball.
Have a great weekend! The next Diamonds Report is Tuesday 1/11.
- Erin
erin@decisionpoint.com
Full Disclosure: I'm about 15% exposed to the market. I added "Diamond in the Rough" HEP to my portfolio this morning and bolstered another position already in my portfolio.
Watch the latest episode of DecisionPoint with Carl & Erin Swenlin on Mondays 7:00p EST or on the DecisionPoint playlist on the StockCharts TV YouTube channel here!
NOTE: The stocks reported herein are from mechanical trading model scans that are based upon moving average relationships, momentum and volume. DecisionPoint analysis is then applied to get five selections from the scans. The selections given should prompt readers to do a chart review using their own analysis process. This letter is not a call for a specific action to buy, sell or short any of the stocks provided. There are NO sure things or guaranteed returns on the daily selection of "diamonds in the rough."
Helpful DecisionPoint Links:
DecisionPoint Shared ChartList and DecisionPoint Chart Gallery
Price Momentum Oscillator (PMO)
Swenlin Trading Oscillators (STO-B and STO-V)
(c) Copyright 2021 DecisionPoint.com