
It's Reader Request Day and clearly y'all are having trouble finding stocks as well given there were not many requests at all. Still, I think the ones I chose have potential.
It appears Financials (XLF) has triggered an IT Trend Model "Dark Cross" Neutral Signal today. The sector is struggling. Typically a rising rate environment works well for Financials, but it isn't right now. This could be related to new sanctions on Russian banks... I don't know. The point is this sector isn't as favorable as it usually is in this economic environment.
Agricultural stocks in general took flight today. One reader mentioned these to me yesterday and I did let you know about the stocks I found interesting. Since requests were slim, I'm covering both an agricultural fund and Sugar.
Most of the agricultural stock charts have giant filled black candlesticks. Those are bearish going into trading tomorrow, but the stocks still look very strong. Filled black candlesticks tell us that price, while it closed up from the day before, closed below its open. This many times means that bears now hold the reigns and we should look for a decline. If we do not see them pullback after these candlesticks it will just be proof to me that commodities are a good place to hide out. Crude Oil related stocks also look pretty good.
Don't forget to register for tomorrow's Diamond Mine trading room! The link is below and right HERE.
Today's "Diamonds in the Rough": CANE, HESM, HII, RJA and TELL.

RECORDING LINK (2/18/2022):
Topic: DecisionPoint Diamond Mine (2/18/2022) LIVE Trading Room
Start Time: Feb 18, 2022 09:00 AM
Meeting Recording Link.
Access Passcode: February#18
REGISTRATION FOR Friday 2/25 Diamond Mine:
When: Feb 25, 2022 09:00 AM Pacific Time (US and Canada)
Topic: DecisionPoint Diamond Mine (2/25/2022) LIVE Trading Room
Register in advance for this webinar HERE.
Save the registration confirmation email with login instructions in case Zoom doesn't notify you in time.

Topic: DecisionPoint Trading Room
Start Time: Feb 22, 2022 09:00 AM
Meeting Recording Link.
Access Passcode: Feb#22nd
For best results, copy and paste the access code to avoid typos.
Welcome to DecisionPoint Daily Diamonds, wherein I highlight ten "Diamonds in the Rough" per week. These are selected from the results of my DecisionPoint Scans, which search for stocks that could benefit from the trend and condition of the market. Remember, these are not recommendations to buy or sell, but are the most interesting of the stocks that surfaced in my scans. My objective is to save you the work of the initial, tedious culling process, but you need to apply your own analysis to see if these stocks pique your interest as well. There are no guaranteed winners here!
"Predefined Scans Triggered" are taken from StockCharts.com using the "Symbol Summary" option instead of a "SharpChart" on the workbench.
Teucrium Sugar Fund (CANE)
EARNINGS: N/A
CANE tracks an index of sugar futures contracts. It reflects the performance of sugar by holding ICE Futures US sugar futures contracts with three different expiration dates.
For more information on this Fund click HERE.
Predefined Scans Triggered: Filled Black Candles, P&F Double Top Breakout and P&F Bearish Signal Reversal.
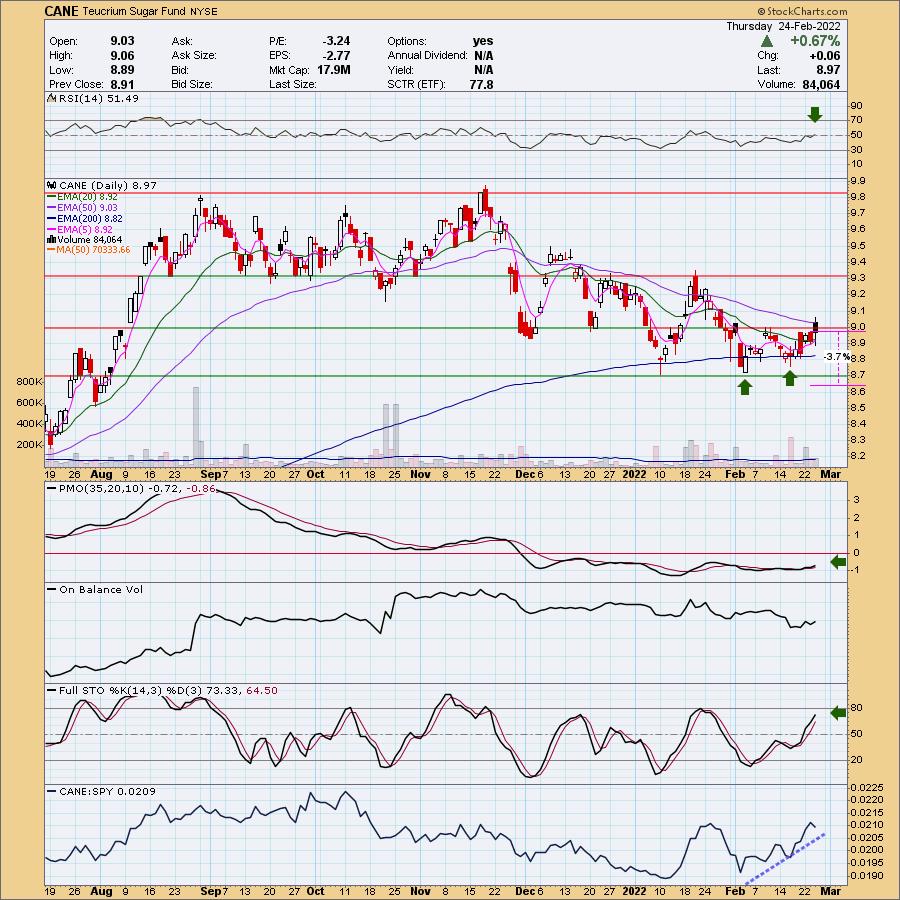
CANE is up +0.33% in after hours trading. There is a confirmed bullish double-bottom formation. "Confirmed" because price managed to break above the confirmation line. However, we did see price fail to hold that level, closing below the confirmation line. I still like the chart. The RSI just hit positive territory above net neutral (50). There is a new PMO crossover BUY signal and Stochastics are rising strongly. The ETF has been performing better than the SPY since the beginning of this month. The stop is extremely thin but this one isn't that volatile.
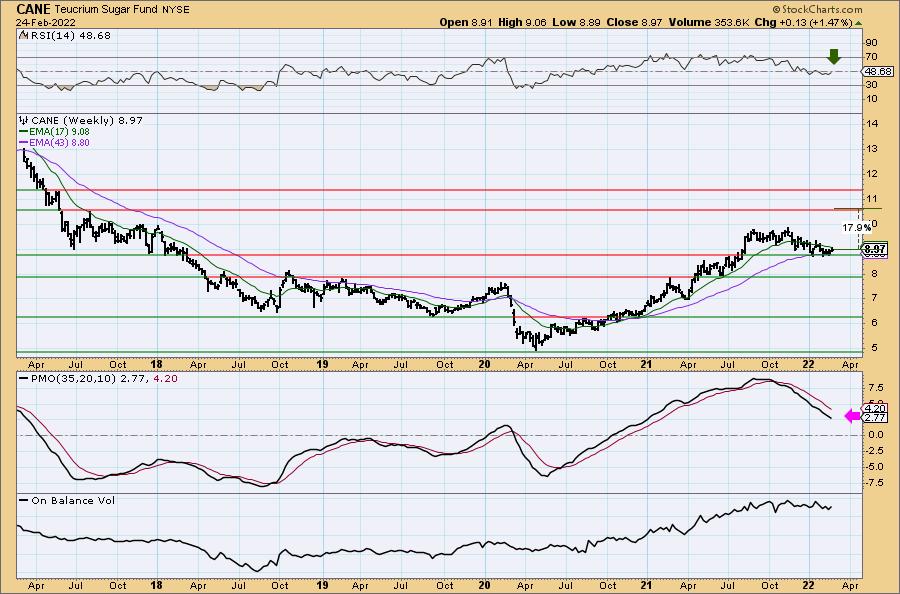
The weekly chart is mixed. While price is holding above the 43-week EMA and late 2017 lows, the weekly PMO is in decline. The weekly RSI did manage to move above net neutral (50), but price is struggling to get above the 17-week EMA. I checked the monthly chart and $10.50 is the next level of resistance and hence my upside target.
Hess Midstream Partners LP (HESM)
EARNINGS: 4/27/2022 (BMO)
Hess Midstream LP engages in the ownership, development, and acquisition of midstream assets to provide services to third-party crude oil and natural gas producers. It operates through the following segments: Gathering, Processing and Storage, and Terminaling and Export. The Gathering segment consists of natural gas and crude oil gathering and compression. The Processing and Storage segment includes the Tioga gas plant, equity investment in the Little Missouri (LM4) joint venture and mentor storage terminal. The Terminaling and Export segment consists of the Ramberg terminal facility, Tioga rail terminal, crude oil rail cars and Johnson's corner header system. The company was founded on January 17, 2014 and is headquartered in Houston, TX.
Predefined Scans Triggered: New CCI Buy Signals, New 52-week Highs, Parabolic SAR Buy Signals, P&F Ascending Triple Top Breakout and P&F Double Top Breakout.
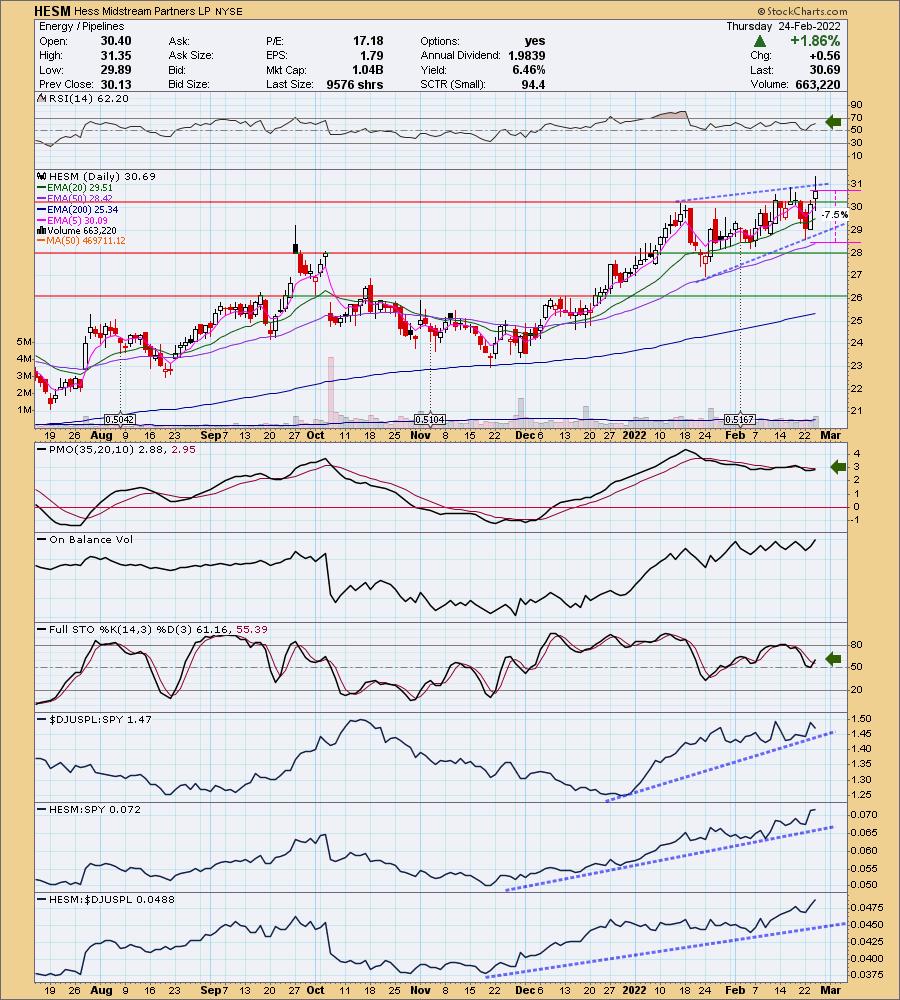
HESM is up +0.03% in after hours trading. This is a beneficiary of higher Oil prices. Price broke out and traded mostly above resistance at the January high. The RSI is positive and Stochastics reversed in positive territory. The PMO is nearing a crossover BUY signal. Based on the OBV, price is following volume which confirms the rising trend. The one problem I see is the bearish rising wedge. Relative strength looks very bullish for HESM. I set the stop around the 50-day EMA and below this week's intraday low.
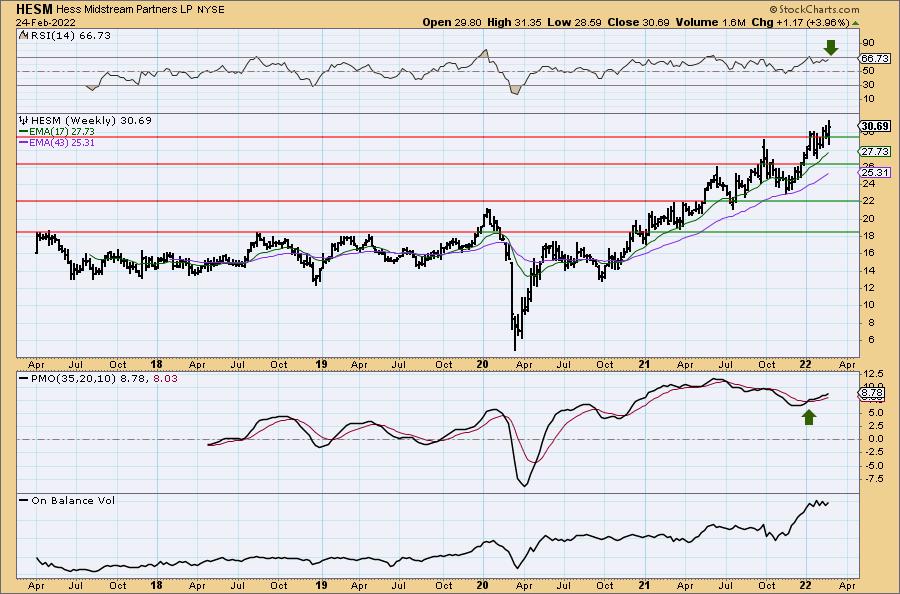
The weekly RSI is positive, rising and not overbought. The PMO is on a BUY signal and rising. Additionally, the weekly PMO is not overbought. HESM is at all-time highs so consider an upside target of 15% at around $35.30.
Huntington Ingalls Industries Inc. (HII)
EARNINGS: 5/5/2022 (BMO)
Huntington Ingalls Industries, Inc. engages in the shipbuilding business. It operates through the following business segments: Ingalls, Newport News, and Technical Solutions. The Ingalls segment develops and constructs non-nuclear ships, assault ships, and surface combatants. The Newport News segment designs, builds, and maintains nuclear-powered ships which include aircraft carriers and submarines. The Technical Solutions segment provides professional services, including fleet support, integrated missions solutions, nuclear and environmental, and oil and gas services. The company was founded on August 4, 2010, and is headquartered in Newport News, VA.
Predefined Scans Triggered: New CCI Buy Signals, Moved Above Upper Bollinger Band, Moved Above Ichimoku Cloud, P&F Double Top Breakout and P&F Bearish Signal Reversal.
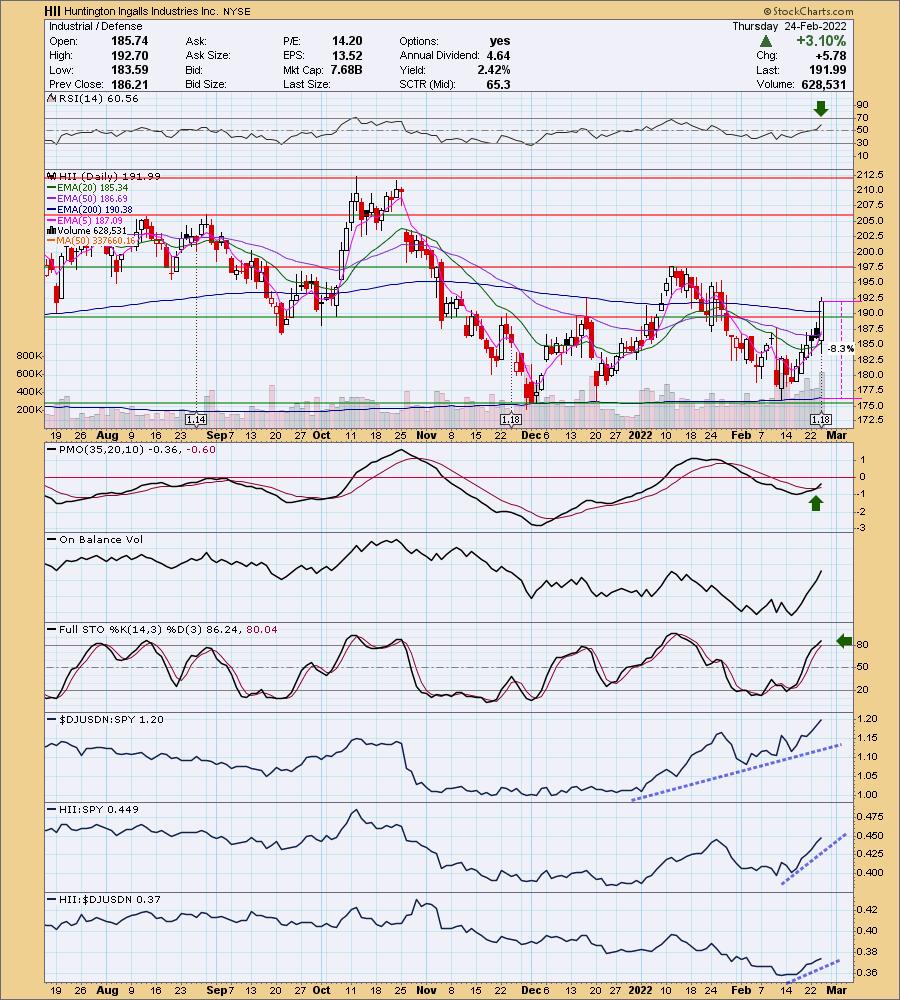
HII is unchanged in after hours trading. I thought this was a great reader request as I've been stalking the Aerospace and Defense industry groups due to the Russian invasion of Ukraine. No idea if that will actually impact price, but it seems investors are interested. HII formed a giant bullish engulfing candlestick. Price not only vaulted overhead resistance at the July/September lows and November/December tops, it closed above the 200-day EMA. This looks like a loose "V" bottom pattern. It suggests we should see a breakout above the January high. The RSI is positive, rising and not overbought yet. The PMO is on a new crossover BUY signal and is headed toward positive territory above the zero line. Stochastics are rising and above 80. Volume is coming in like crazy and relative performance is strong for the group and HII which is beginning to outperform the group. The stop is rather deep but is set around the February low.
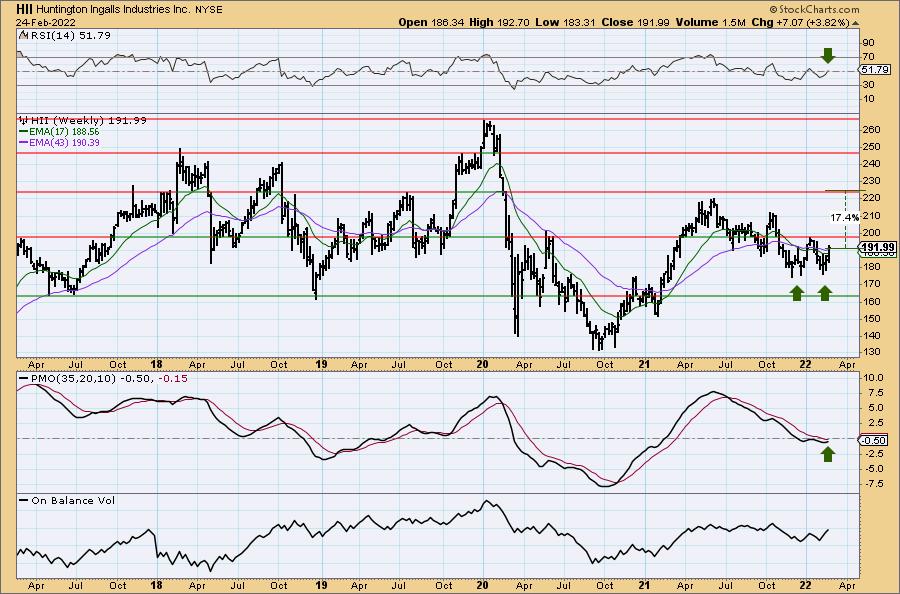
There is a bullish double-bottom on the weekly chart. That implies that price should at least reach overhead resistance at the 2021 high. The weekly PMO is turning back up just below the zero line and the weekly RSI just hit positive territory.
ELEMENTS Rogers International Commodity Index - Agriculture Total Return ETN (RJA)
EARNINGS: N/A
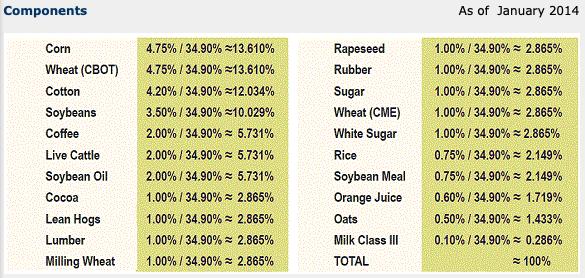
RJA tracks a consumption-based index of agricultural commodities chosen by the RICI committee. It gains exposure using front-month futures contracts.
For more information click HERE.
Predefined Scans Triggered: Filled Black Candles, Parabolic SAR Buy Signals and P&F Low Pole.
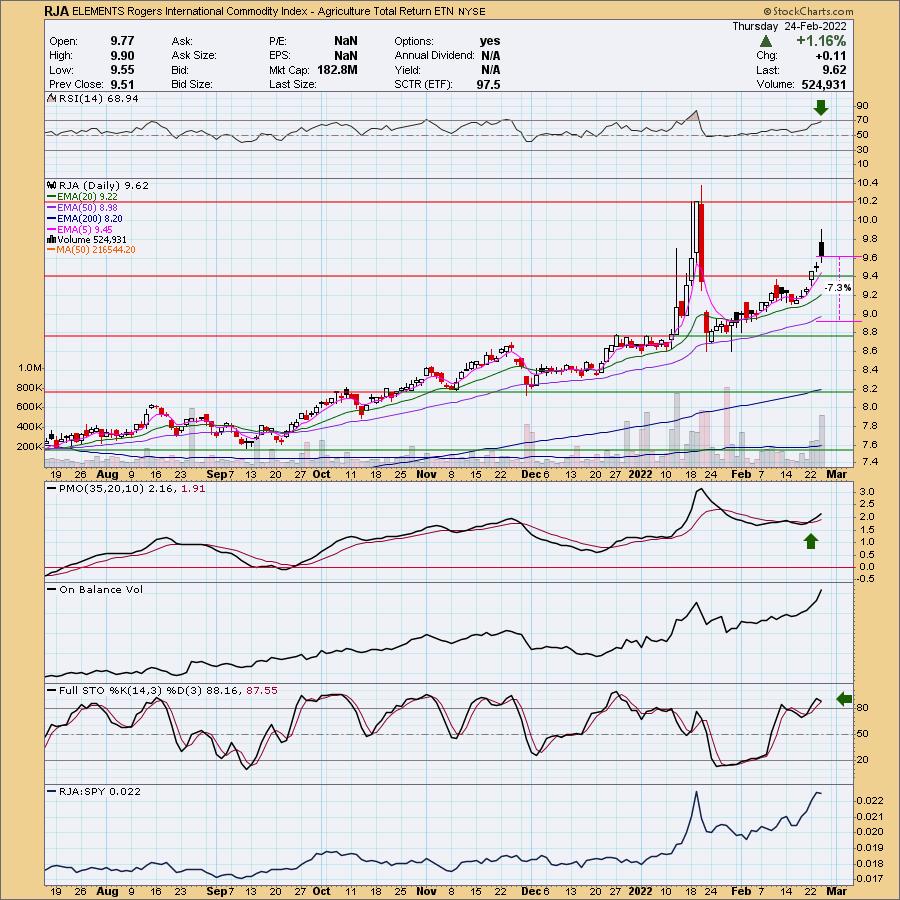
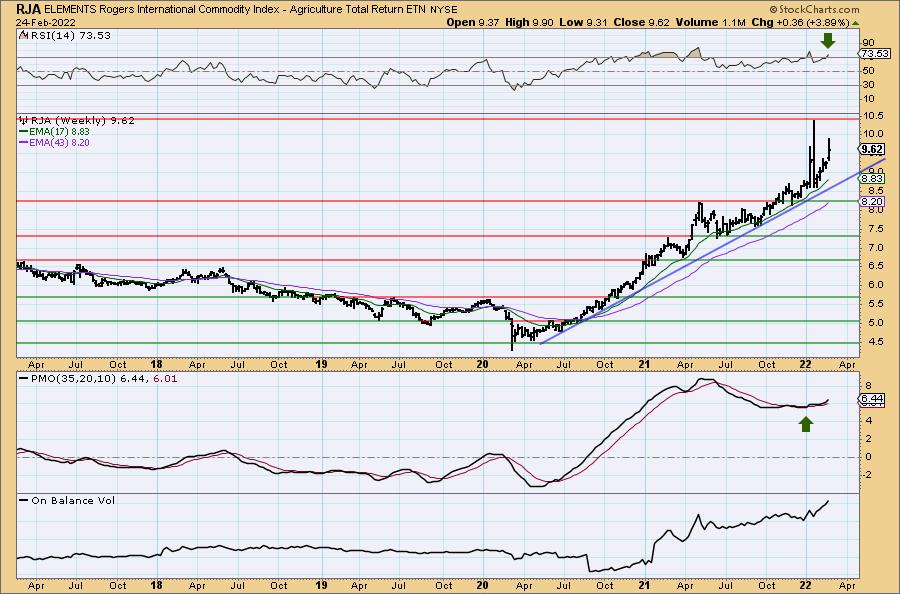
RJA is up +2.60% in after hours trading so I don't think the bearish black candlestick is going to be a problem. The RSI is positive although getting somewhat overbought. The PMO is accelerating higher on a crossover BUY signal. This ETF has been in a bull market for almost six months. The OBV shows us the new interest from investors. Stochastics are above 80, although they did top. As long as they stay above 80 we're good. The stop is set below the 50-day EMA.
We can see that in actuality RJA has been in a bull market since 2020. It holds a strong rising trend. The weekly RSI is overbought, but I would point you to early 2021 where it remained overbought for over four months. It is at all-time highs so consider a 15% upside target around $11.06.
Tellurian Inc. (TELL)
EARNINGS: 2/23/2022 (BMO) ** REPORTED YESTERDAY **
Tellurian, Inc. engages in producing natural gas and investing in natural gas projects. It develops a portfolio of natural gas production, LNG marketing, and infrastructure assets that includes an LNG terminal facility and an associated pipeline in southwest Louisiana. The company was founded by Charif Souki and Martin Houston in 1957 and is headquartered in Houston, TX.
Predefined Scans Triggered: Moved Above Upper Keltner Channel, Stocks in a New Uptrend (Aroon) and Entered Ichimoku Cloud.
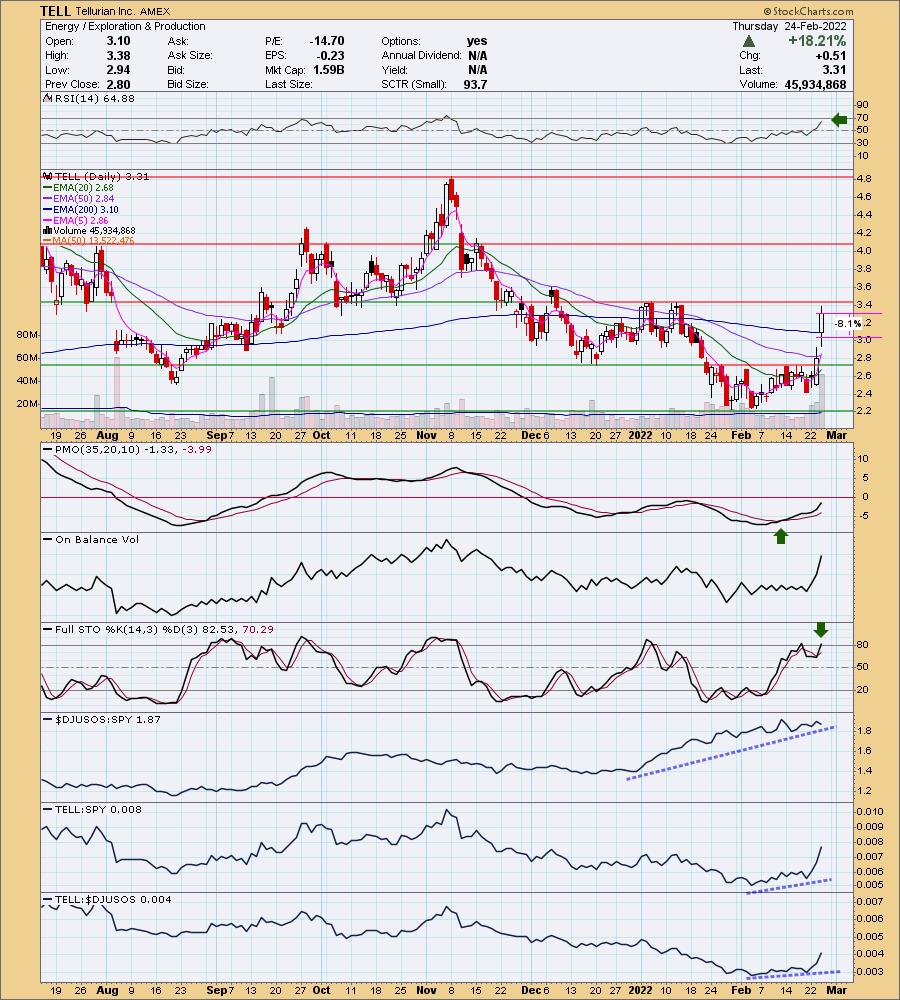
TELL is down -2.12% in after hours trading. They reported earnings yesterday and it saw a gap up today after a great looking bullish engulfing candlestick. I'm not surprised it is pulling back in after hours trading given its giant 18%+ move today. Normally I don't pick "Diamonds in the Rough" that are up more than 10% in a day, but this is a reader request and truth be told, I think it does have more upside ahead. Even before today big move, the PMO had triggered a crossover BUY signal and the RSI had moved into positive territory. Stochastics have reversed and are now reading above 80 again. This should continue to be a productive industry group and TELL is beginning to really outperform the group and the SPY (mostly due to today's giant rally, but still bullish). The stop is set below the 200-day EMA and today's open.
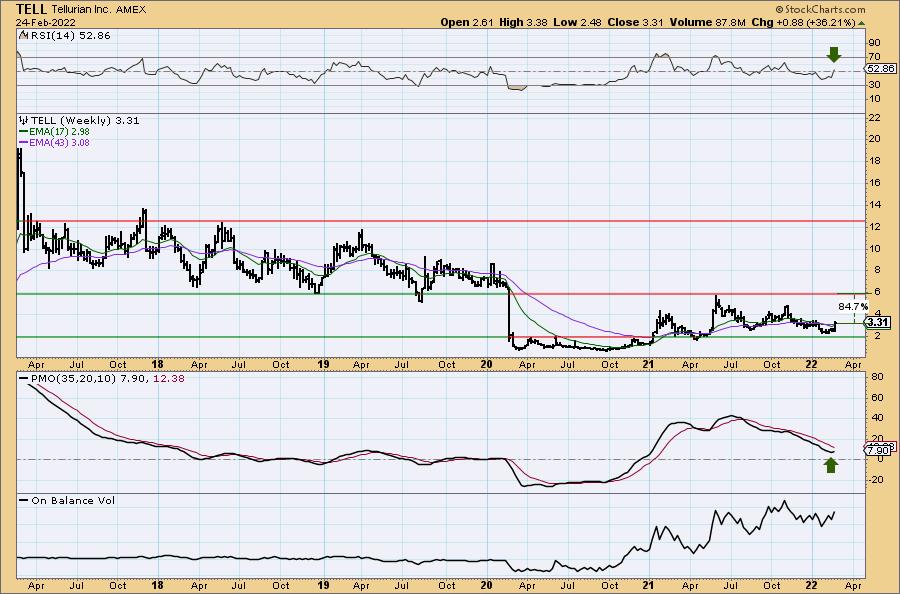
This weekly chart is very enticing. The weekly RSI just hit positive territory and the weekly PMO has turned back up. Amazingly, there is a huge gain to be had and that wouldn't even have it challenging 2019 highs. I would consider this for your watch list and when it does pullback some of today's gains, I'd then consider entry.
Don't forget, on Thursdays I look at reader-requested symbols, click HERE to shoot me an email. I read every email I receive and try to answer them all!
Current Market Outlook:
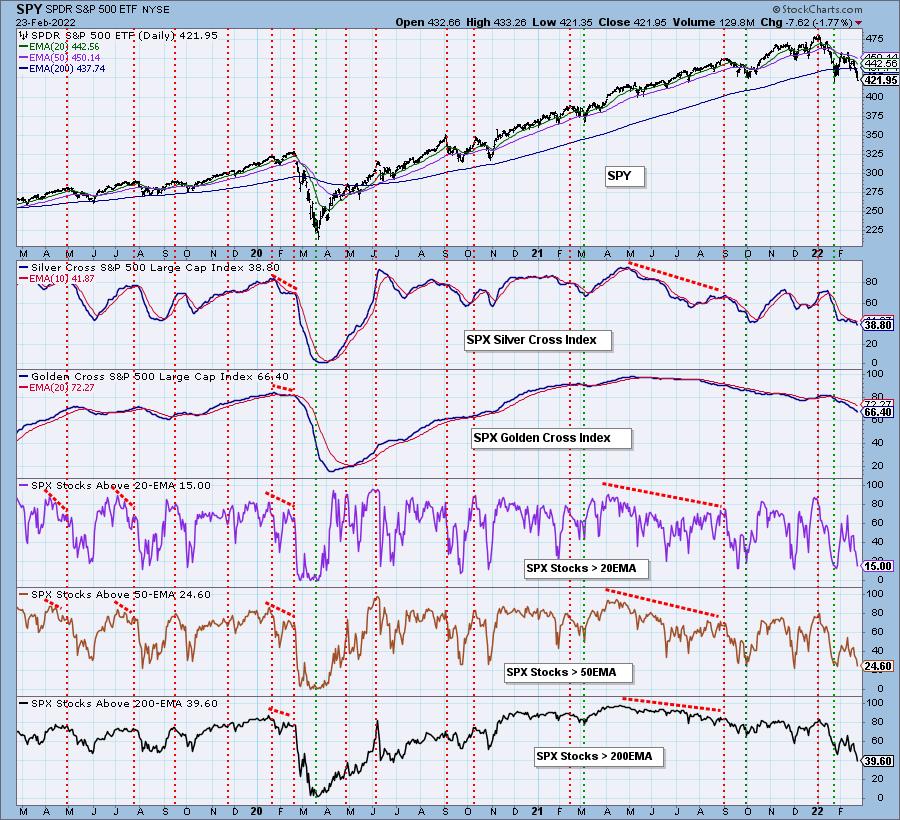
Market Environment: It is important to consider the odds for success by assessing the market tides. The following chart uses different methodologies for objectively showing the depth and trend of participation for intermediate- and long-term time frames.
- The Silver Cross Index (SCI) shows the percentage of SPX stocks on IT Trend Model BUY signals (20-EMA > 50-EMA)
- The Golden Cross Index (GCI) shows the percentage of SPX stocks on LT Trend Model BUY signals (50-EMA > 200-EMA)
Don't forget that as a "Diamonds" member, you have access to our GCI/SCI curated ChartList on DecisionPoint.com. You'll find it under "Members Only" links on the left side on the Blogs and Links Page.
Here is the current chart:
Full Disclosure: I'm 8% invested and 92% is in 'cash', meaning in money markets and readily available to trade with. Contemplating RJA.
I'm required to disclose if I currently own a stock and/or may buy it within the next 72 hours.
Good Luck and Good Trading!
- Erin
"Technical Analysis is a windsock, not a crystal ball." - Carl Swenlin
(c) Copyright 2022 DecisionPoint.com
Watch the latest episode of DecisionPoint with Carl & Erin Swenlin on Mondays 7:00p EST or on the DecisionPoint playlist on the StockCharts TV YouTube channel here!
NOTE: The stocks reported herein are from mechanical trading model scans that are based upon moving average relationships, momentum and volume. DecisionPoint analysis is then applied to get five selections from the scans. The selections given should prompt readers to do a chart review using their own analysis process. This letter is not a call for a specific action to buy, sell or short any of the stocks provided. There are NO sure things or guaranteed returns on the daily selection of "Diamonds in the Rough."
Helpful DecisionPoint Links:
DecisionPoint Shared ChartList and DecisionPoint Chart Gallery
Price Momentum Oscillator (PMO)
Swenlin Trading Oscillators (STO-B and STO-V)
For more links, go to DecisionPoint.com