
Today as the title says, I came up with zero results when I ran five of my primary DP scans. I did have an exception to that rule and funny enough, it was an inverse ETF. It's time to start looking at shorting opportunities for the active trader. I prefer to be out rather than short, but I want to offer you something and longs are not likely to serve you well.
A few notes:
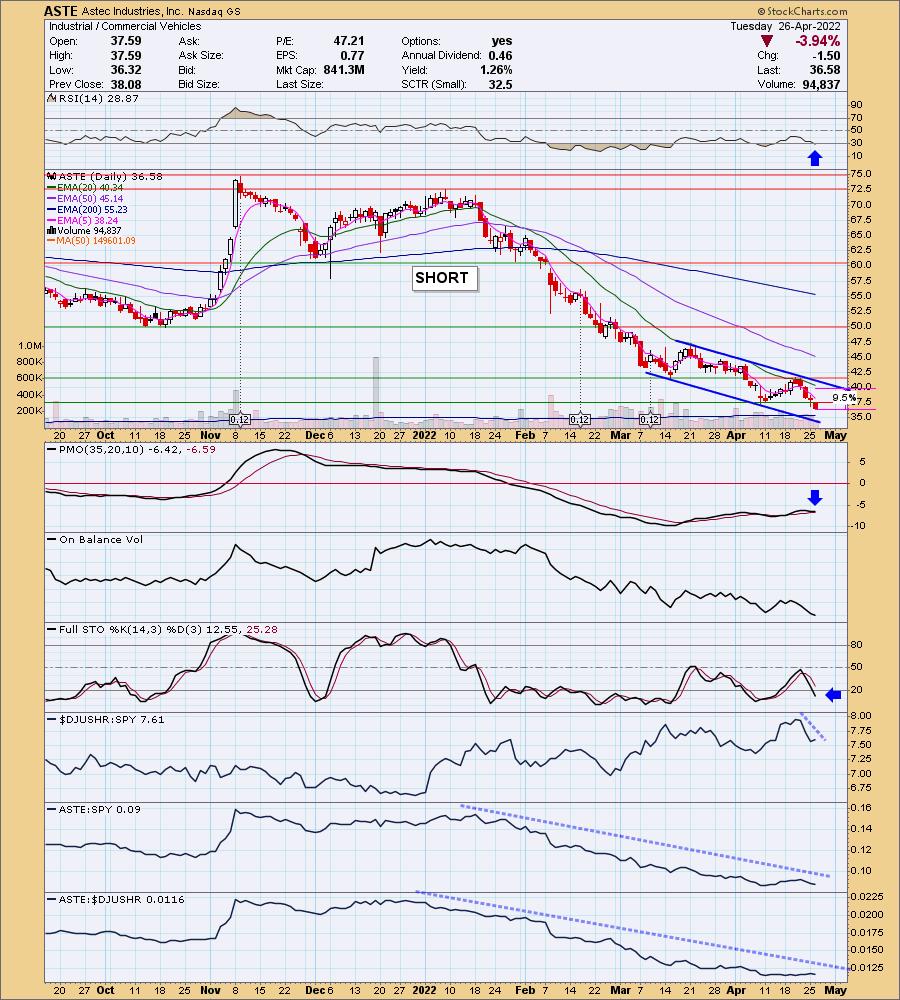
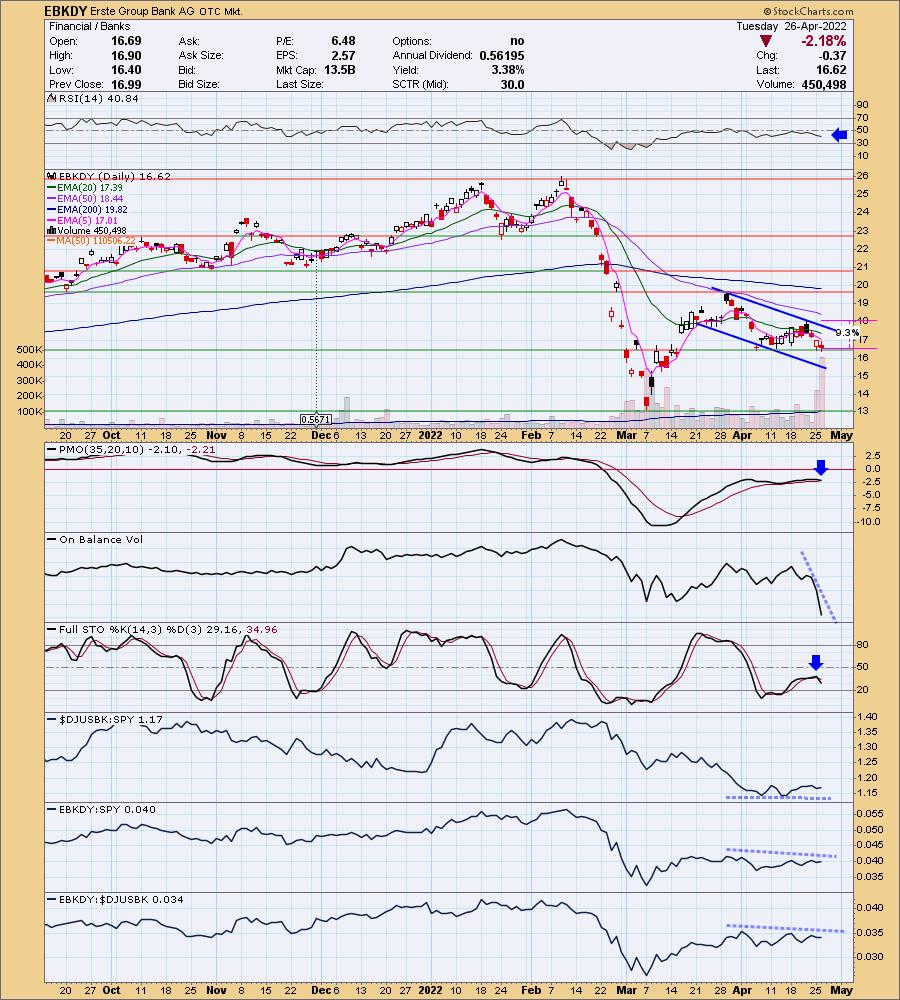
Since two of the positions today are shorts, understand that on the daily chart I'm giving you a "stop" level that is higher than today's current price. We are shorting, so we need to determine how far we will let it rally before covering the short.
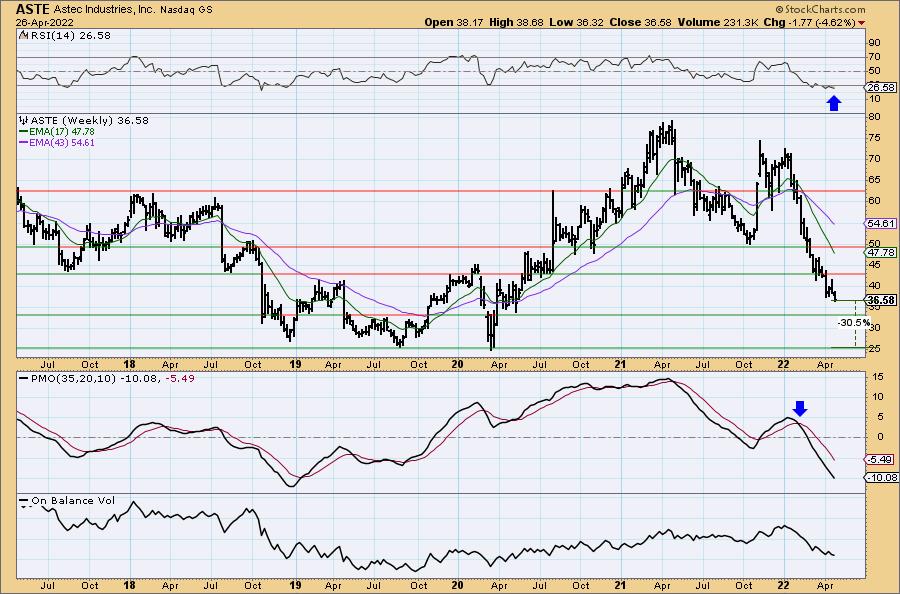
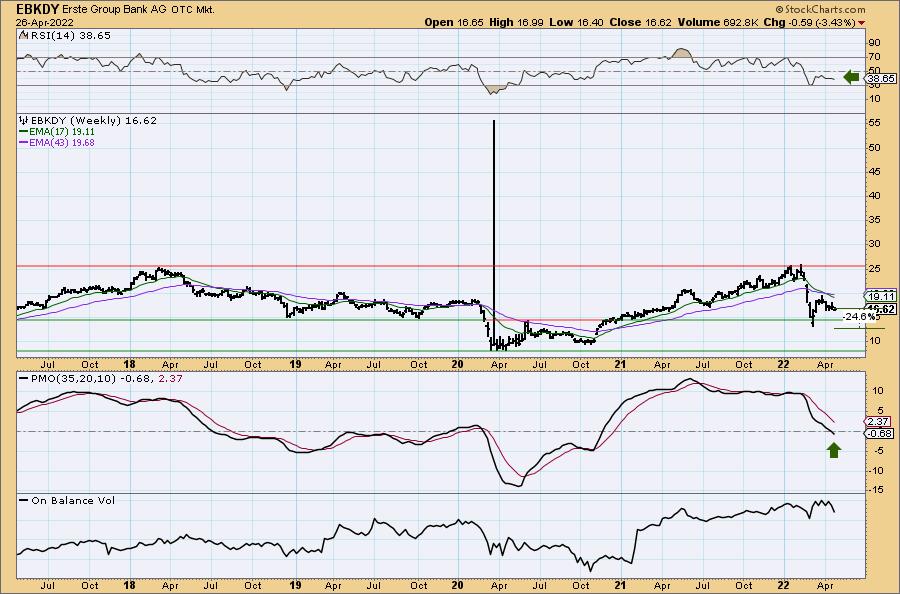
On the weekly chart the "targets" are downside targets, not upside targets as I normally do.
I consider a stock a shorting opportunity if strong support has been broken and/or price is far away from the next support level. I want bearish chart patterns if possible. I want to see volume flying out of the stock/ETF.
Today's "Diamonds in the Rough": ASTE (Short), EBKDY (Short) and SRS.
Stocks to Review: UTHR (Short) and ROAD (Short).

Diamond Mine RECORDING LINK (4/22/2022):
Topic: DecisionPoint Diamond Mine (4/22/2022) LIVE Trading Room
Start Time: Apr 22, 2022 09:00 AM
Meeting Recording Link.
Access Passcode: April%22
REGISTRATION FOR 4/29 Diamond Mine:
When: Apr 29, 2022 09:00 AM Pacific Time (US and Canada)
Topic: DecisionPoint Diamond Mine (4/29/2022) LIVE Trading Room
Register in advance for this webinar HERE.
** Save the registration confirmation email with login instructions in case Zoom doesn't notify you in time.**

Free DP Trading Room (4/25) RECORDING LINK:
Topic: DecisionPoint Trading Room
Start Time: Apr 25, 2022 09:00 AM
Meeting Recording Link.
Access Passcode: April@25
For best results, copy and paste the access code to avoid typos.
Welcome to DecisionPoint Daily Diamonds, wherein I highlight ten "Diamonds in the Rough" per week. These are selected from the results of my DecisionPoint Scans, which search for stocks that could benefit from the trend and condition of the market. Remember, these are not recommendations to buy or sell, but are the most interesting of the stocks that surfaced in my scans. My objective is to save you the work of the initial, tedious culling process, but you need to apply your own analysis to see if these stocks pique your interest as well. There are no guaranteed winners here!
"Predefined Scans Triggered" are taken from StockCharts.com using the "Symbol Summary" option instead of a "SharpChart" on the workbench.
Astec Industries, Inc. (ASTE) - SHORT
EARNINGS: 5/4/2022 (BMO)
Astec Industries, Inc. engages in the manufacture of equipment and components for the infrastructure, and aggregate and mining industries. It operates through the following segments: Infrastructure Solutions, Material Solutions, and Corporate. The Infrastructure Solutions segment markets line of asphalt plants and related components, asphalt pavers, screeds, milling machines, material transfer vehicles, stabilizers, and related ancillary equipment. The Material Solutions segment focuses on designing and manufacturing heavy processing equipment, as well as servicing and supplying parts for the aggregate, metallic mining, recycling, ports, and bulk handling markets. The Corporate segment includes the firm's parent company and Astec Insurance Co. The company was founded by J. Don Brock in 1972 and is headquartered in Chattanooga, TN.
Predefined Scans Triggered: P&F Descending Triple Bottom Breakdown, Moved Below Lower Price Channel, New 52-week Lows, P&F Double Bottom Breakout and Moved Below Lower Keltner Channel.
ASTE is unchanged in after hours trading. As soon as I saw the price pattern, I knew I needed to check if it was a falling wedge (bullish) or declining trend channel (bearish). It is a bearish declining trend channel (turns out I visualized it correctly as being bearish. Since this is short, we have to determine how much upside we will give it. The "stop" or "limit" is 9.5% which is definitely on the high side. Ultimately what I'd look for is a breakout from the declining trend. If that were to happen I would leave a bearish position. The RSI is falling and entered oversold territory.The PMO is considering a crossover SELL signal. Stochastics have dropped below 20 and are still falling. The group is underperforming the SPY and ASTE is performing in line with a bearish industry group and SPY.
"Downside" potential looks promising at 30%+, my only caveat is that support will arrive around $32.50. That support level isn't nearly as strong as $25, but it still worth noting. It would be a just under 10% gain if it reaches that level, but I'm looking at $25 as the target for this short. The weekly PMO is on a SELL signal and the RSI is negative and falling. Volume has been pouring out all year based on the OBV.
Erste Group Bank AG (EBKDY) - SHORT
EARNINGS: N/A
Erste Group Bank AG engages in the provision of banking and financial services. It operates through the following business segments: Retail, Corporates, Group Markets, Asset/Liability Management & Local Corporate Center, Savings Banks, and Group Corporate Center. The Retail segment comprises the business with private individuals, micros, and free professionals within the responsibility of account managers in the retail network. The Corporates segment consists of business activities with corporate customers of different turnover size as well as commercial real estate and public sector business. The Group Markets segment is involved in trading and markets services, as well as customer business with financial institutions. The Asset/Liability Management & Local Corporate Center segment is composed of all asset and liability management functions, local and of Erste Group Bank AG (Holding), and local corporate centers such as internal service providers. The Savings Banks segment includes savings banks, which are members of the Haftungsverbund of the Austrian savings banks sector. The Group Corporate Center segment covers mainly centrally managed activities and items that are not directly allocated to other segments. The company was founded in 1819 and is headquartered in Vienna, Austria.
Predefined Scans Triggered: Strong Volume Decliners.
EBKDY doesn't trade after hours as it is part of the OTC (Over the Counter) market. It also didn't include an earnings date, so it may not report earnings. I apologize if this one doesn't offer a way to short it, but I think knowing my rationale for why this is a terrible chart is instructive none the less.
Price is currently in a short-term declining trend channel. It failed to overcome the 50-day EMA in March, but this time it failed to overcome the 20-day EMA. The RSI is firmly negative and trending lower. The PMO has topped for the second time below the zero line and should trigger a crossover SELL signal very soon. Volume has poured out of this stock quickly based on the OBV's vertical drop. Relative strength is on par with the SPY which is a problem given the SPY is in a bear market. Again the "stop" or upside limit is a high percentage. Mainly you don't want to see a breakout from this declining trend channel.
The weekly chart displays a very negative weekly RSI and a weekly PMO that just dropped below the zero line and is not oversold. If price just challenges this year's low it would be a nearly 25% gain.
ProShares UltraShort Real Estate (SRS)
EARNINGS: N/A
SRS provides 2x inverse exposure to a market-cap-weighted index of large US real estate companies, including REITs.
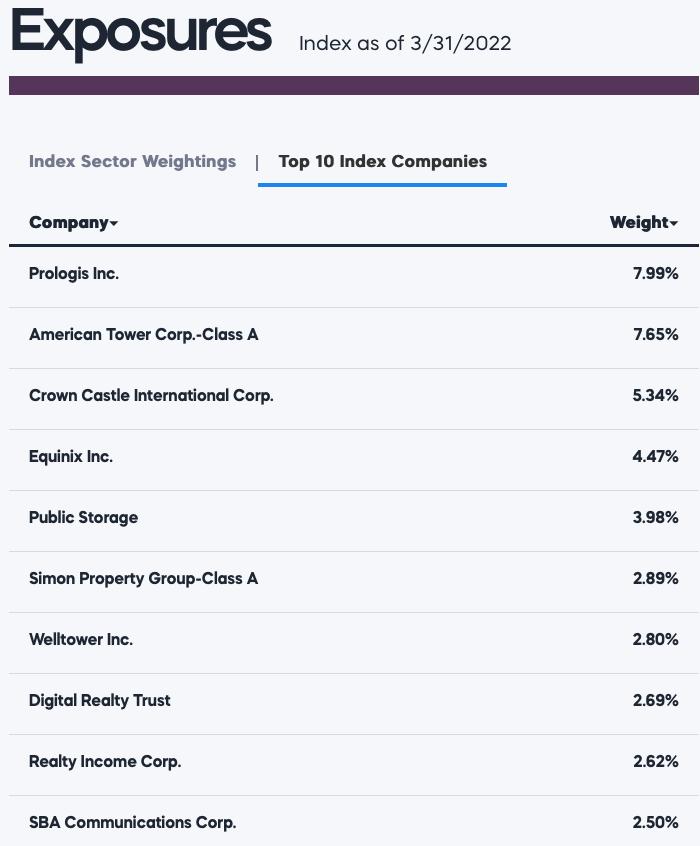
Predefined Scans Triggered: Improving Chaikin Money Flow, New CCI Buy Signals and P&F Double Bottom Breakout.
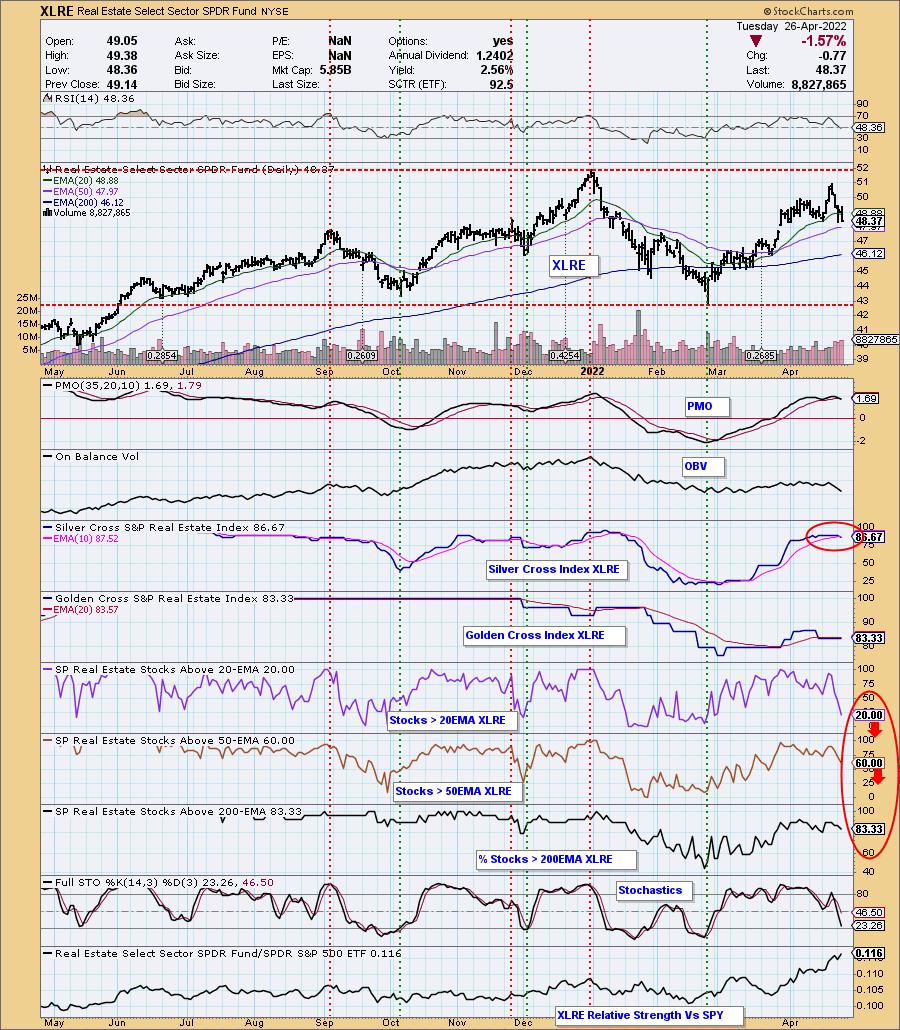
SRS is up 1.06% in after hours trading. First off, this is a "juiced" ETF, meaning it is two times exposure (some will be 3x even!), so you better have some conviction before investing in them. I like the set up here and I do expect to see it continue higher. Here's why. First, when I look at my XLRE sector chart, I see that participation is poor and getting poorer.
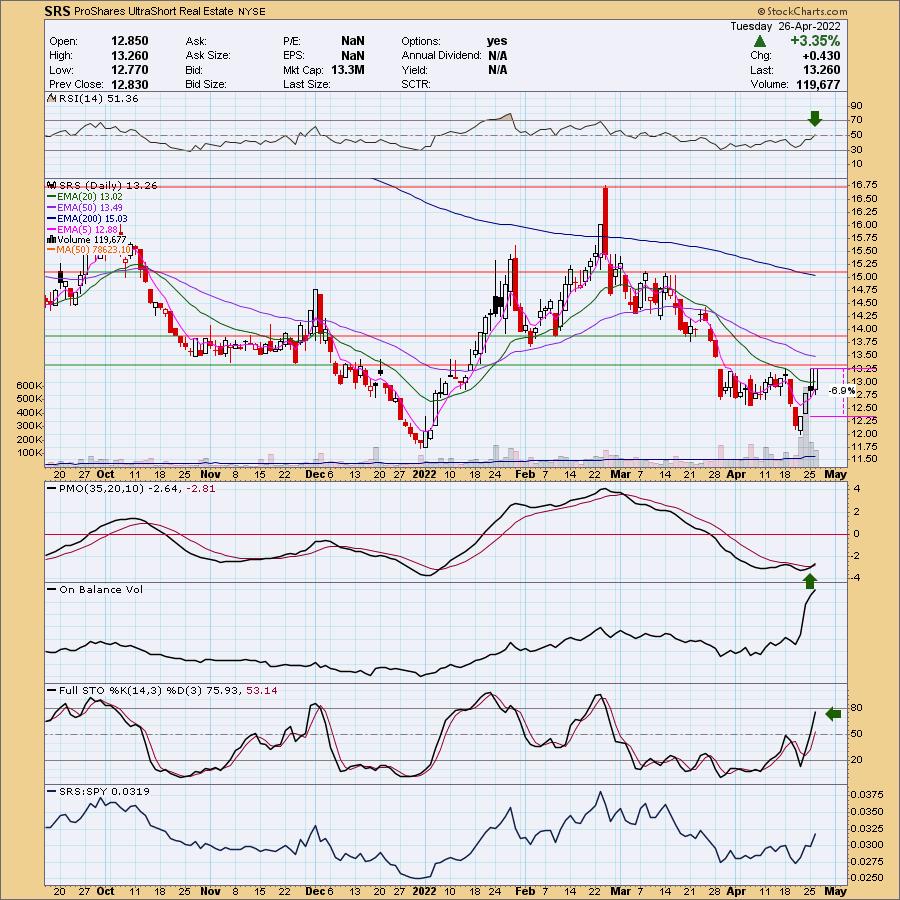
The chart for SRS looks good, my only concern is it is currently up against overhead resistance. The RSI is now positive and the PMO has just triggered and oversold crossover BUY signal. Volume is POURING in on this one. That OBV is something else with its vertical rise. One problem with that... all of that volume should be pushing price higher than it is, it's a reverse divergence. Still, Stochastics are rising and nearing 80. The ETF is beginning to really outperform the SPY. The stop is set below the trading range lows in late March/early April.
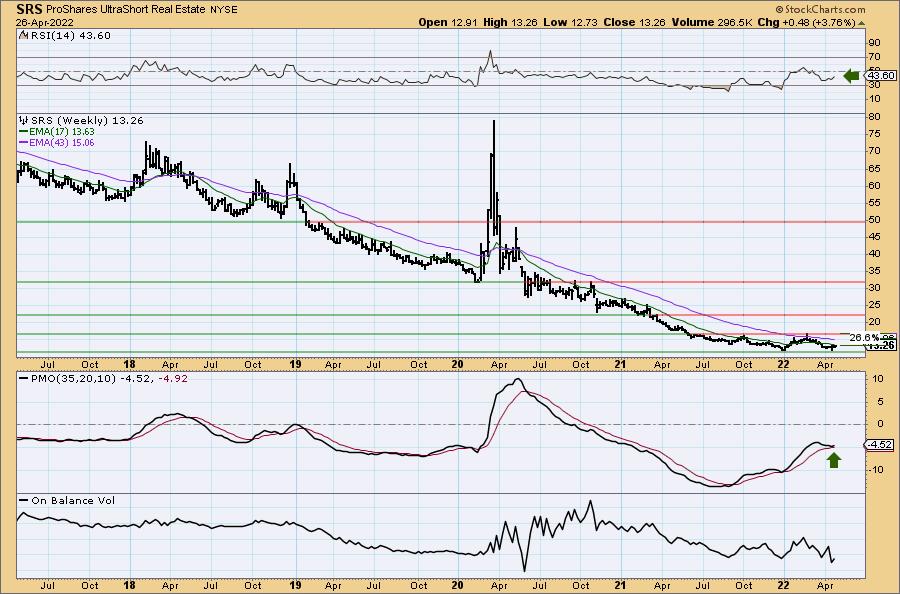
The weekly chart is improving. The weekly RSI is negative, but it is rising. The weekly PMO is in the process of bottoming above its signal line which is very bullish. If it can just reach the 2022 highs, it would be an over 26.6% gain.
Don't forget, on Thursdays I look at reader-requested symbols, click HERE to shoot me an email. I read every email I receive and try to answer them all!
Current Market Outlook:
Market Environment: It is important to consider the odds for success by assessing the market tides. The following chart uses different methodologies for objectively showing the depth and trend of participation for intermediate- and long-term time frames.
- The Silver Cross Index (SCI) shows the percentage of SPX stocks on IT Trend Model BUY signals (20-EMA > 50-EMA)
- The Golden Cross Index (GCI) shows the percentage of SPX stocks on LT Trend Model BUY signals (50-EMA > 200-EMA)
Don't forget that as a "Diamonds" member, you have access to our GCI/SCI curated ChartList on DecisionPoint.com. You'll find it under "Members Only" links on the left side on the Blogs and Links Page.
Here is the current chart:
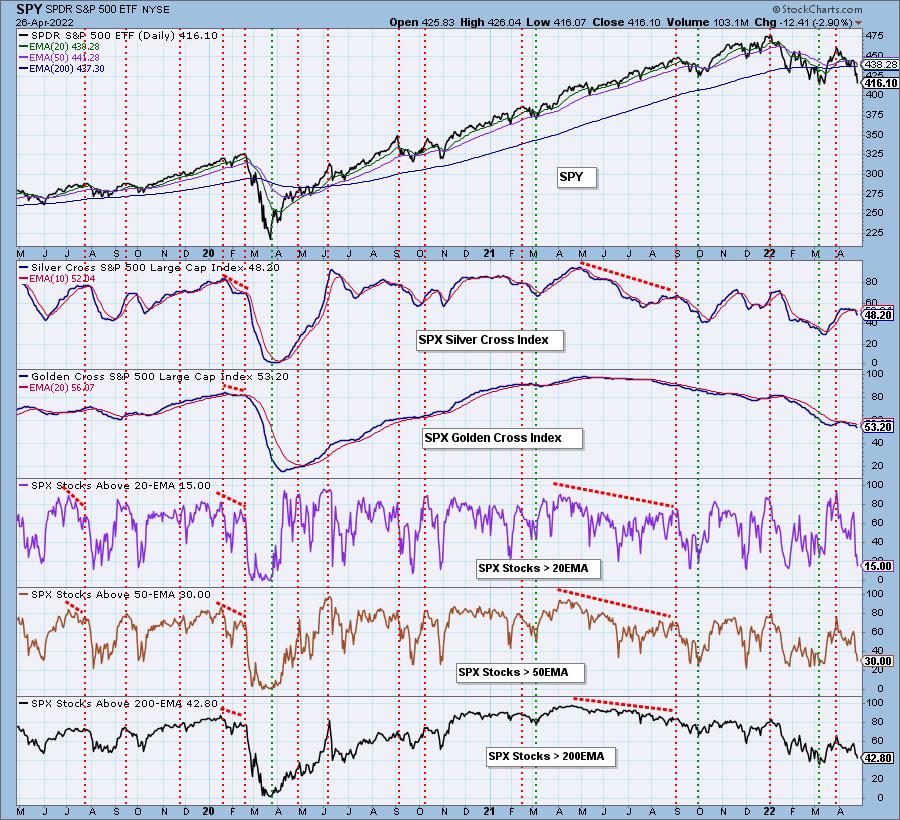
Full Disclosure: I'm 20% invested and 80% is in 'cash', meaning in money markets and readily available to trade with. Amazingly, my stops have not triggered. Looks like my positions are getting a second wind.
I'm required to disclose if I currently own a stock and/or may buy it within the next 72 hours.
Good Luck and Good Trading!
- Erin
"Technical Analysis is a windsock, not a crystal ball." - Carl Swenlin
(c) Copyright 2022 DecisionPoint.com
Watch the latest episode of DecisionPoint with Carl & Erin Swenlin on Mondays 7:00p EST or on the DecisionPoint playlist on the StockCharts TV YouTube channel here!
NOTE: The stocks reported herein are from mechanical trading model scans that are based upon moving average relationships, momentum and volume. DecisionPoint analysis is then applied to get five selections from the scans. The selections given should prompt readers to do a chart review using their own analysis process. This letter is not a call for a specific action to buy, sell or short any of the stocks provided. There are NO sure things or guaranteed returns on the daily selection of "Diamonds in the Rough."
Helpful DecisionPoint Links:
DecisionPoint Shared ChartList and DecisionPoint Chart Gallery
Price Momentum Oscillator (PMO)
Swenlin Trading Oscillators (STO-B and STO-V)
For more links, go to DecisionPoint.com