
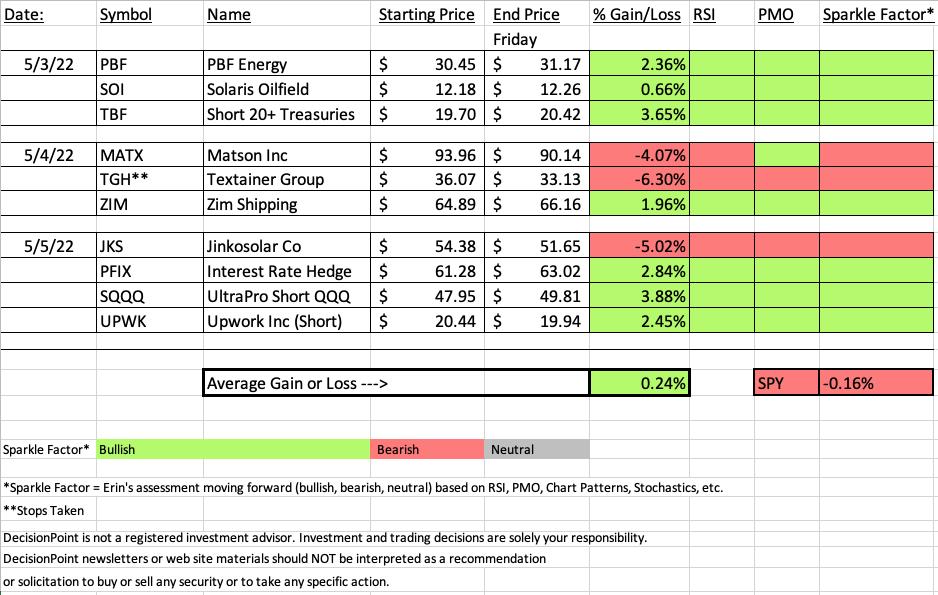
It was a positive finish overall for "Diamonds in the Rough" this week with the best performers coming from the Energy sector and inverse ETFs. The losing positions were Transports.
Stock picking is getting more difficult which is why will continue to exploit the strength in the Energy sector and investigate more inverse ETFs as we move forward. In that vein, the "Darling" this week was the inverse ETF for the Nasdaq. It is "juiced" so it enjoyed a nice rally today.
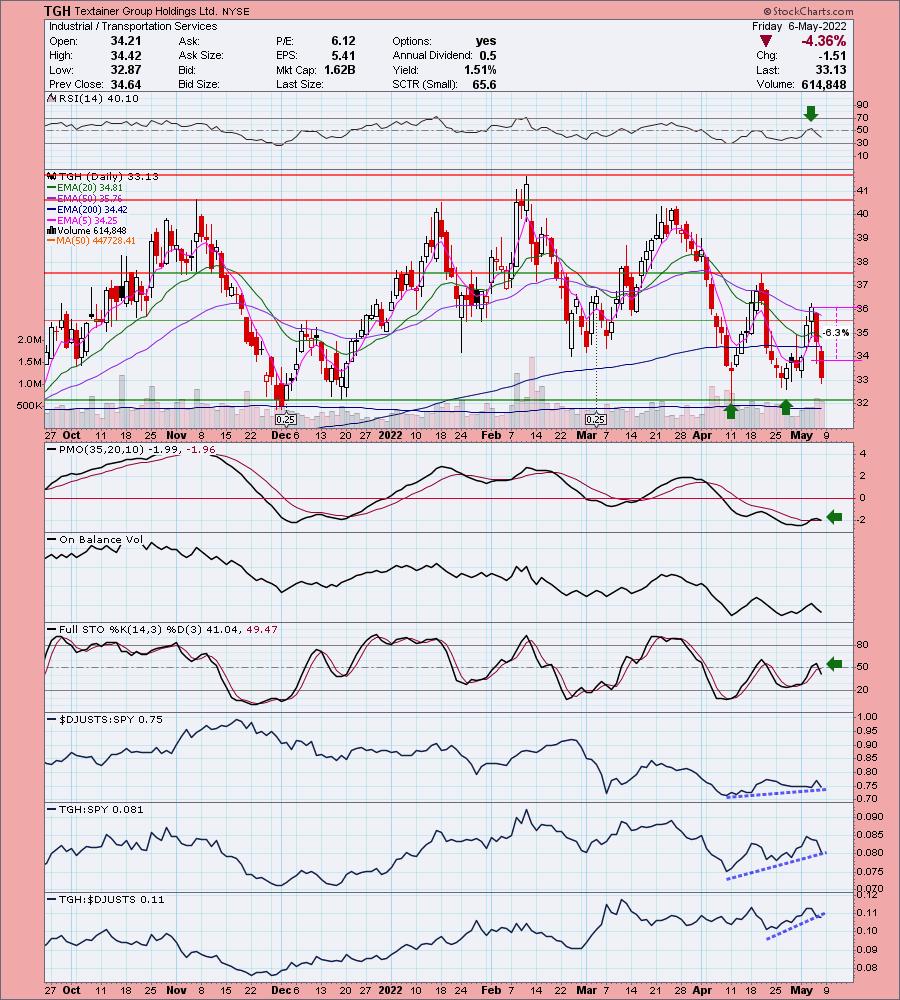
The Diamond PMO Scan failed on Wednesday. Themes coming from Wednesday's scans were Transports and Banks. I should have been suspect of the Transports given I had zero faith in Banks. Consequently we had one stop trigger from that group with one down over 4%, but the other up 1.96%.
You'll be getting a mailing soon, but I wanted to let you know that I have a last minute presentation thisd Thursday at 11:15a ET. Join me on Traders Corner for a Special Live Trading Event. I will be one of the 8 Expert Traders on the panel. We will be sharing a diversity of techniques, software, and trading strategies with you. This information packed seminar is designed to help you hedge inflation, grow your trading account, and make you a consistently profitable trader! My presentation will be a reprise of "Under the Hood" Indicators, but I'll be concentrating on sector analysis. All registrants will receive a copy of the recording. Register HERE.
Have a great weekend! See you in Monday's free trading room! Next Diamonds report will be on Tuesday, 5/10.
Erin

RECORDING LINK (5/6/2022):
Topic: DecisionPoint Diamond Mine (5/6/2022) LIVE Trading Room
Start Time: May 6, 2022 09:00 AM
Meeting Recording Link.
Access Passcode: @Maythe5th
REGISTRATION FOR Friday 5/13 Diamond Mine:
When: May 13, 2022 09:00 AM Pacific Time (US and Canada)
Topic: DecisionPoint Diamond Mine (5/13/2022) LIVE Trading Room
Register in advance for this webinar HERE.
Save the registration confirmation email with login instructions in case Zoom doesn't notify you in time.

Free DP Trading Room (5/2/2022) RECORDING LINK:
Topic: DecisionPoint Trading Room
Start Time: May 2, 2022 09:00 AM
Meeting Recording Link.
Access Passcode: May#the2nd
For best results, copy and paste the access code to avoid typos.
A few items about the spreadsheet: I've put on the spreadsheet whether the RSI is positive (green) or negative (red). The PMO column tells you if it is rising (green) or falling (red). Finally I've added my own "Sparkle Factor" that gives you my assessment going forward, bullish (green), bearish (red) or neutral (gray). The Sparkle Factor is basically my thoughts on whether I expect it to rise or fall. A neutral means it could really go either way so it could be added to a watch list. If you're in a stock I consider "neutral" going forward, the ball is in your court.
Darling:
ProShares UltraPro Short QQQ (SQQQ)
EARNINGS: N/A
SQQQ provides (-3x) inverse exposure to a modified market-cap-weighted index of 100 of the largest non-financial firms listed on the NASDAQ.
Predefined Scans Triggered: Elder Bar Turned Green and Moved Above Ichimoku Cloud.
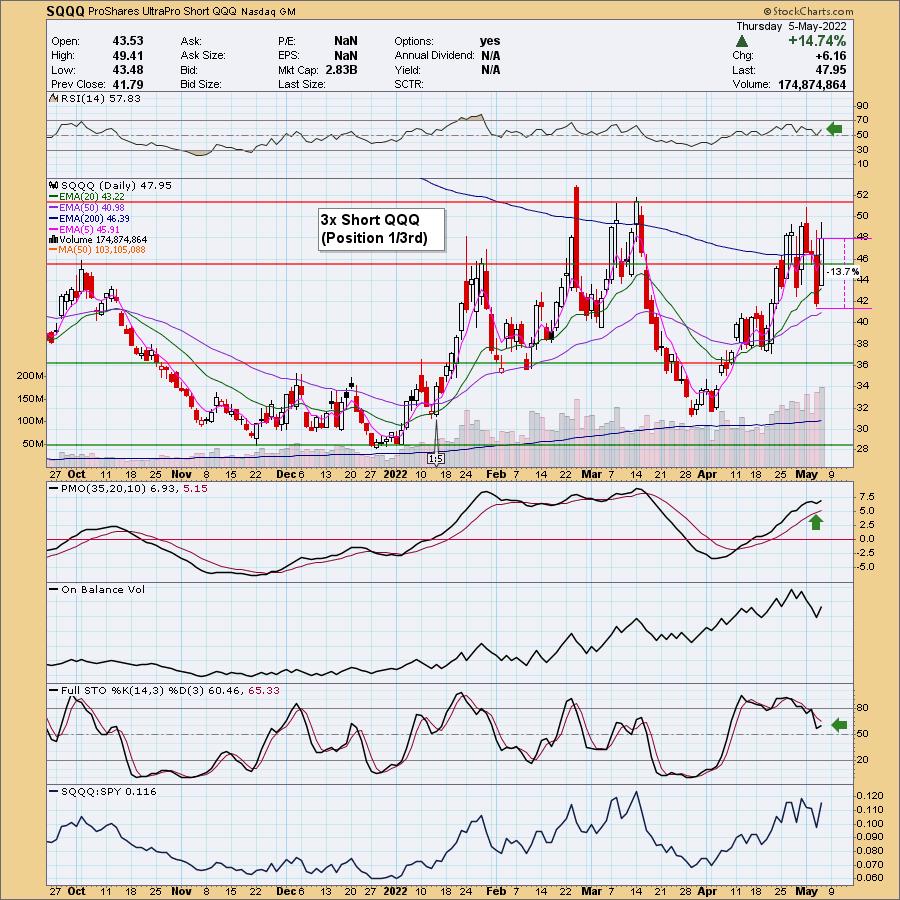
Below are the commentary and chart from yesterday (5/5):
"SQQQ is down -0.08% in after hours trading. I'm very bearish on the Nasdaq, but I always hesitate on these juiced ETFs. As noted in the opening, I've listed the stop deep at the 50-day EMA, but in actuality, it may require more risk tolerance than that. The RSI is positive and rising. The PMO just bottomed above its signal line which is especially bullish. Stochastics are in positive territory above 50 and are rising as of today's giant bounce."
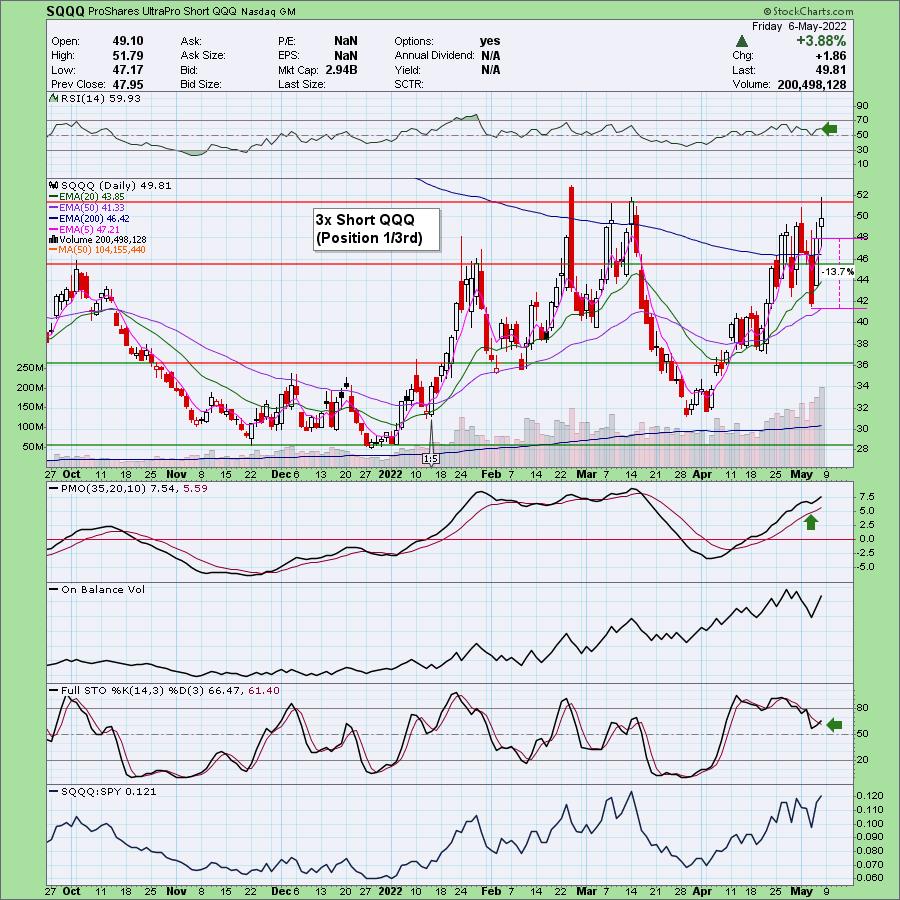
Here is today's chart:
Last week's darling was LABU, the ultrashort of the Biotechs. This week's it is another ultrashort ETF that was the winner. It almost seems unfair that these "ultra" ETFs come out winning given they are leveraged at 3x, but it also tells us that inverse ETFs and short positions are where you will likely make money. We still don't have the breakout above resistance, but given the chart keeps on getting more bullish, it is a matter of time. Stochastics are moving a bit slowly which doesn't make me happy, but other than that, it is looking good moving forward.
Don't forget, on Thursdays I look at reader-requested symbols, so shoot me an email at erin@decisionpoint.com. I read every email I receive and try to answer them all!
Dud:
Textainer Group Holdings Ltd. (TGH)
EARNINGS: 5/5/2022 (BMO) ** REPORTS TOMORROW! **
Textainer Group Holdings Ltd. engages in the purchase, management, leasing, and resale of a fleet of marine cargo containers. It operates through the following segments: Container Ownership, Container Management, and Container Resale. The Container Ownership segment composed primarily of standard dry freight containers and also includes special-purpose containers. The Container Management segment manages a fleet of containers for and on behalf of owners. The Container Resale segment consists of purchases and leases or resells of containers from shipping line customers, container traders, and other sellers. The company was founded in 1979 and is headquartered in Hamilton, Bermuda.
Predefined Scans Triggered: Ichimoku Cloud Turned Green and Parabolic SAR Buy Signals.
Below are the commentary and chart from Wednesday (5/4):
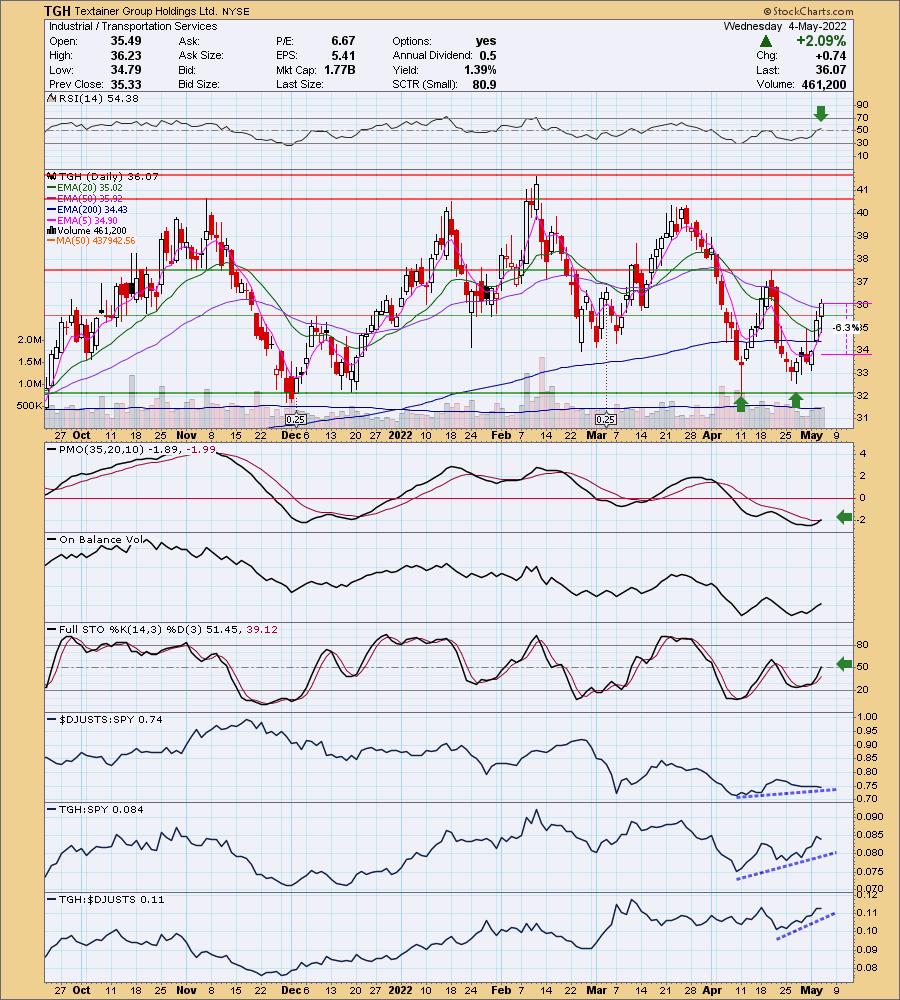
"TGH is unchanged in after hours trading so we don't have any hints as to how earnings will go tomorrow. They report before the market opens, so you'll have the advantage of deciding whether this is worth it based on the reaction to earnings. Like MATX, we have a double-bottom pattern that will be confirmed when price gets above $37.50. The RSI just turned positive and the PMO had a new crossover BUY signal today. Stochastics are rising and have moved above 50. Relative strength for the group hasn't been that impressive, but at least TGH has been outperforming both the group and market. The stop is set below support at the 200-day EMA and $34."
Here is today's chart:
The timing clearly couldn't have been worse on this pick, but I did note all of the positive that were going for this chart. The big problem was that it reported earnings after we picked it and obviously investors weren't happy with the report. I did warn that it was reporting earnings. It's often a good idea to wait a day or two have the report before entering a position. I think I will avoid pre-earnings selections.
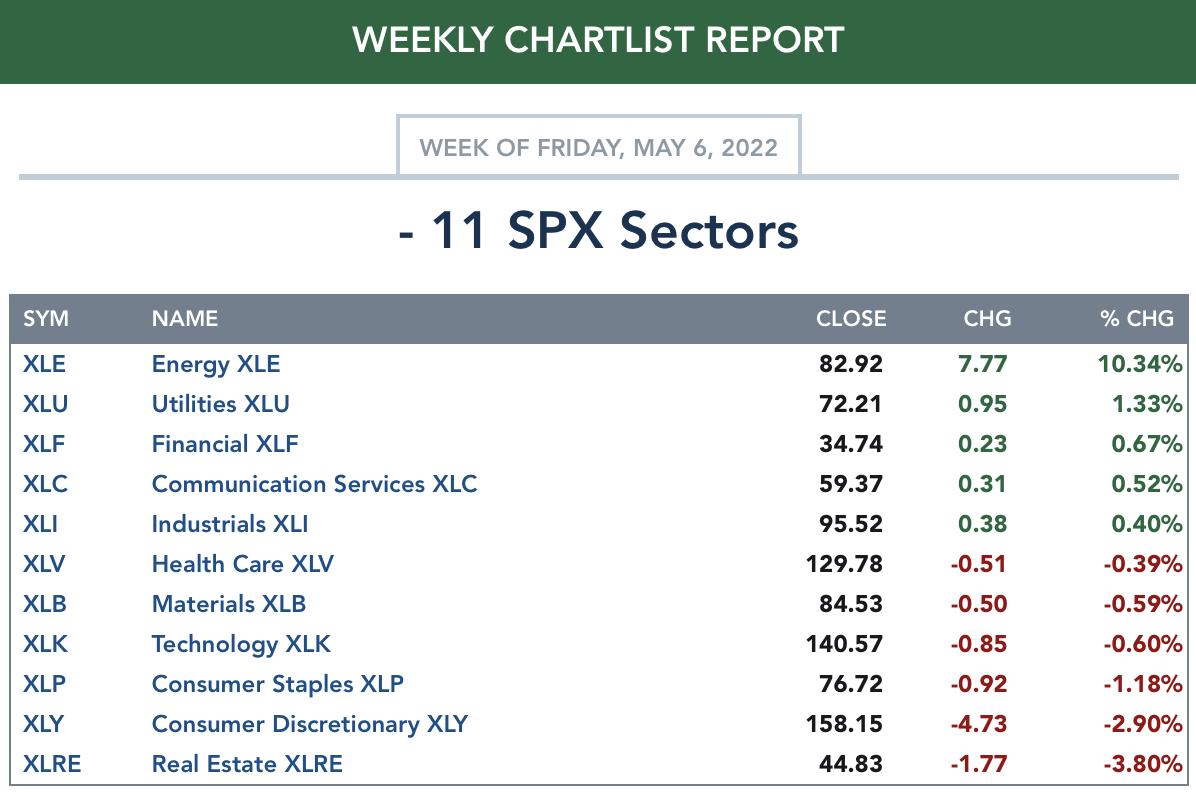
TODAY'S Sector Performance:
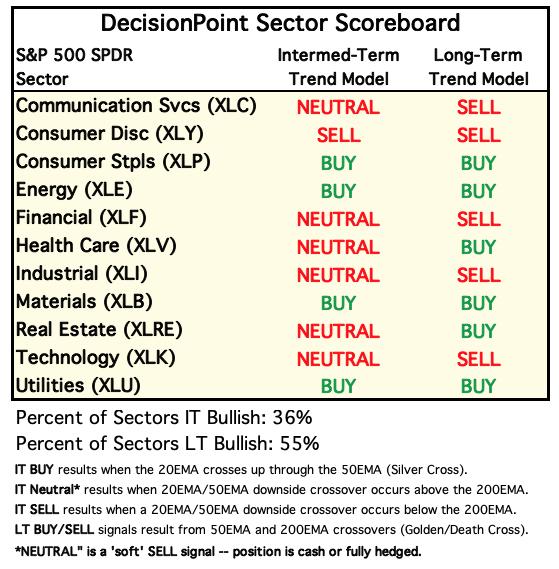
DecisionPoint Sector Scoreboard (Mechanical Trend Model Signals):
Click Here to view Carl's annotated Sector ChartList!
$ONE is the current benchmark on the RRGs:
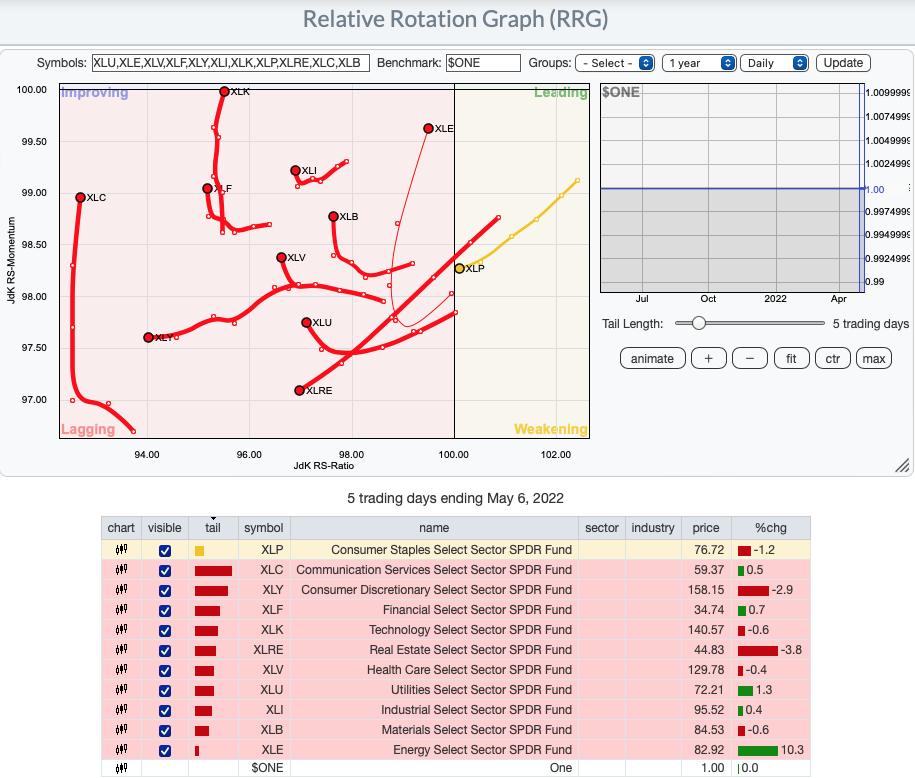
It occurred to Carl and I that using the SPY as a benchmark is useless right now. The SPY is in a bear market so sectors could be moving lower, but still outperform the SPY. This is why on the RRG with the benchmark of SPY, we see XLK getting ready to enter the Leading quadrant and improvement on XLC. These sectors are far from healthy. One way to get around this problem is to use $ONE was the benchmark. By using $ONE, you get to see ACTUAL performance in relation to other sectors. The picture is completely different, but far more accurate.
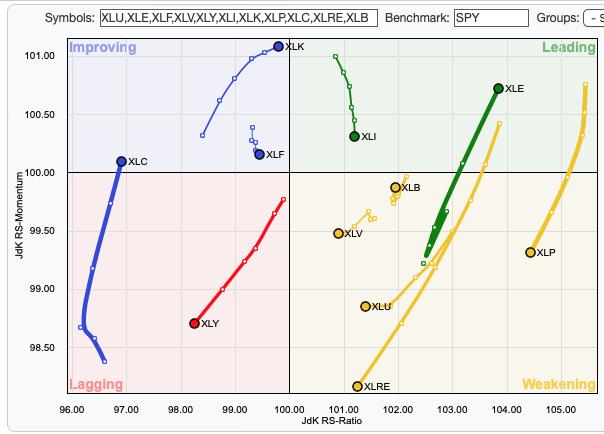
Additionally, I have decided to only use the Weekly version of the RRG. I believe it is more accurate as to the market environment.
Note in the difference between the daily and weekly $ONE benchmark RRGs. Here's the Daily version. I'll write about the Weekly version:
Intermediate-Term (Weekly) $ONE RRG:
This absolutely the best representation of what is currently happening within the market. The weakest sectors are those in the Lagging quadrant. Not only are they lagging, they all have switched into bearish southwest headings! It is no surprise that the aggressive sectors, XLC, XLK, XLY and XLF are part of this. XLI is a little surprising, but given the breakdown of the Dow Industrials ($INDU), maybe it isn't.
XLP is the only member of the Weakening quadrant. It was headed toward Leading, but it has put on the brakes.
XLE is the most bullish sector by far. It had been headed toward the Weakening quadrant, but has reversed into a bullish northeast heading. It's distance from the center point of the graph tells us it is also the best overall performer.
The remainder of sectors are in the Leading quadrant, but they are starting to show deterioration of their headings which are pulling them toward the Improving or Weakening quadrants. XLU is actually more healthy than all of the sectors based on its location which is distant from the center of the graph and distance away from the Weakening quadrant.
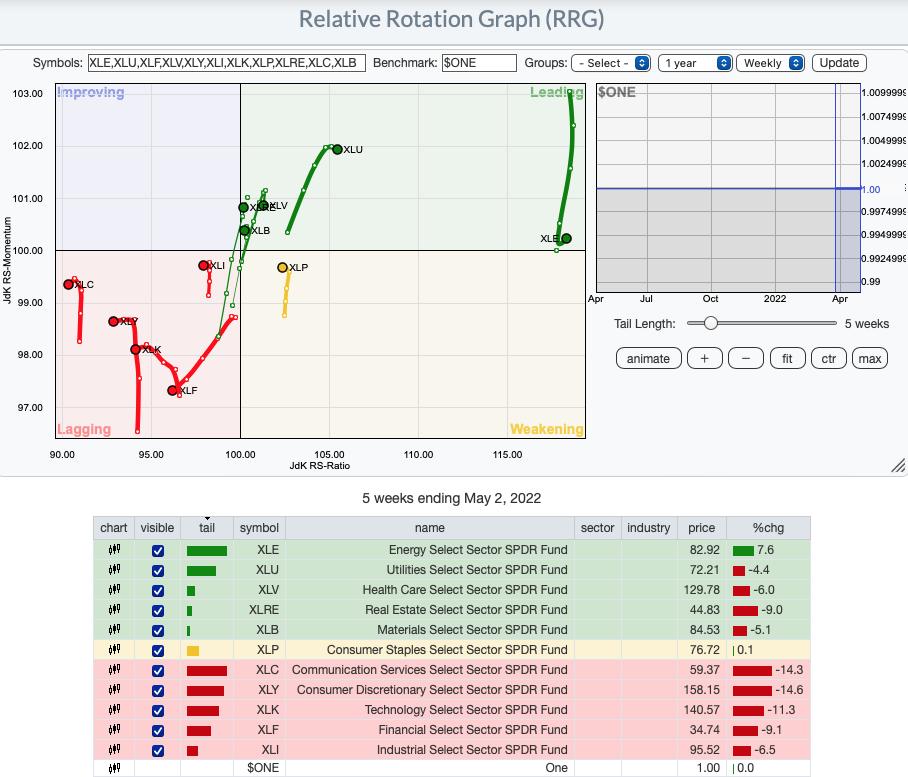
RRG® charts show you the relative strength and momentum for a group of stocks. Stocks with strong relative strength and momentum appear in the green Leading quadrant. As relative momentum fades, they typically move into the yellow Weakening quadrant. If relative strength then fades, they move into the red Lagging quadrant. Finally, when momentum starts to pick up again, they shift into the blue Improving quadrant.
CLICK HERE for an animated version of the RRG charts.
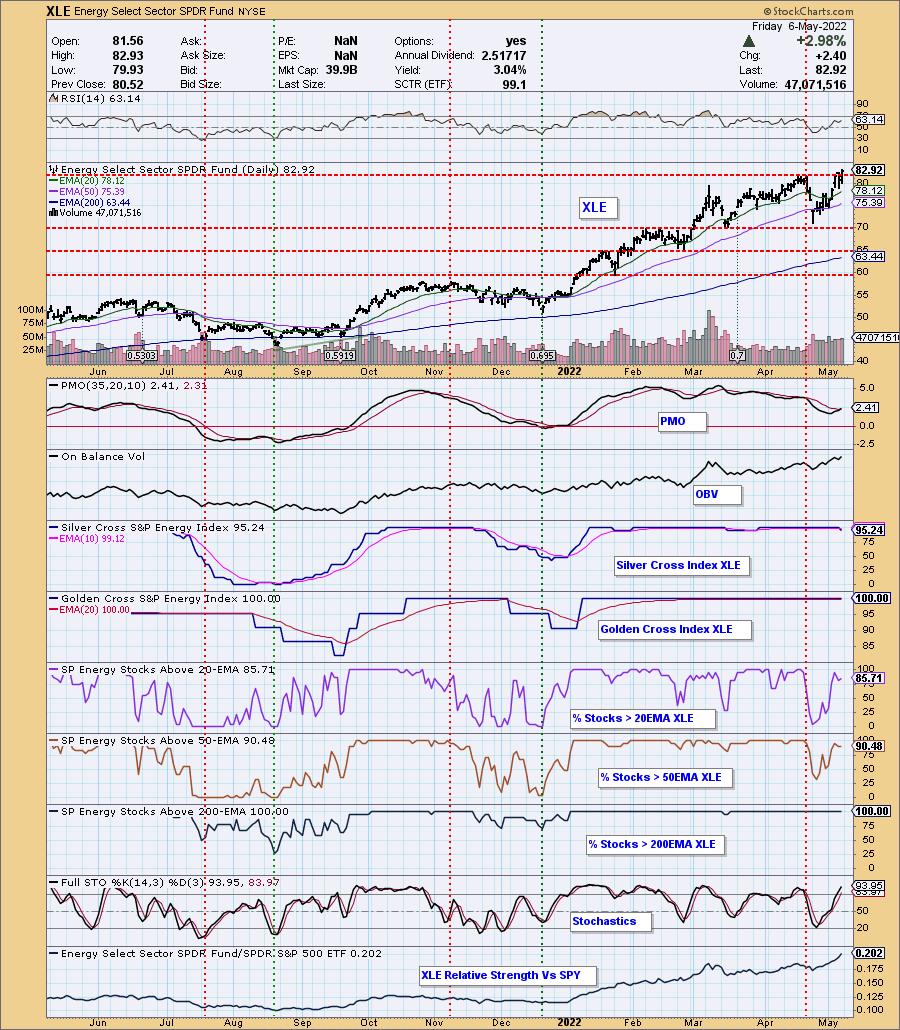
Sector to Watch: Energy (XLE)
Energy is the clear winner when it came to picking a "sector to watch". It is the only one with rising momentum and today it broke to new all-time highs. The RSI is positive and far from overbought. Similarly, the PMO is on a crossover BUY signal and not overbought. Stochastics are rising above 80 and participation percentages are top-notch.
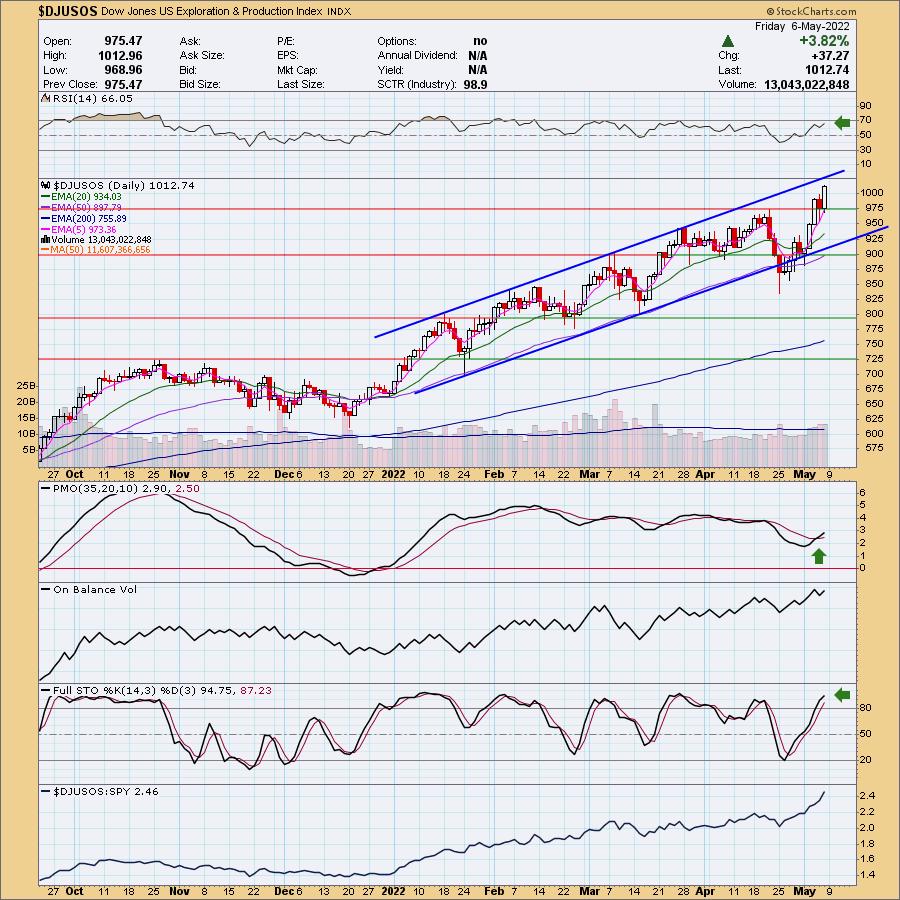
Industry Group to Watch: Exploration & Production ($DJUSOS)
There was a tie between this industry group and Integrated Oil & Gas ($DJUSOL). I picked this one because I liked the strong rising trend with a decline that brought indicators out of overbought conditions. Wednesday the group broke out and the next day had a small pullback toward the breakout area. This was followed by today's strong rally. Diamonds, PBF and SOI are within both those industry groups. EOG and DVN are showing incredible strength. Other prior Diamonds worth consideration are PXD and MRO.
Go to our Sector ChartList on DecisionPoint.com to get an in-depth view of all the sectors.
Good Luck & Good Trading!
- Erin
erin@decisionpoint.com
Full Disclosure: I'm 15% exposed to the market, but plan to add an inverse ETF or two, barring a bear market rally.
Watch the latest episode of DecisionPoint with Carl & Erin Swenlin on Mondays 7:00p EST or on the DecisionPoint playlist on the StockCharts TV YouTube channel here!
Technical Analysis is a windsock, not a crystal ball. --Carl Swenlin
NOTE: The stocks reported herein are from mechanical trading model scans that are based upon moving average relationships, momentum and volume. DecisionPoint analysis is then applied to get five selections from the scans. The selections given should prompt readers to do a chart review using their own analysis process. This letter is not a call for a specific action to buy, sell or short any of the stocks provided. There are NO sure things or guaranteed returns on the daily selection of "diamonds in the rough."
Helpful DecisionPoint Links:
DecisionPoint Shared ChartList and DecisionPoint Chart Gallery
Price Momentum Oscillator (PMO)
Swenlin Trading Oscillators (STO-B and STO-V)
(c) Copyright 2022 DecisionPoint.com