
It was a pretty positive day for the market and that generally means more scan results. Rather than the typical 20 or 30 stocks to look at, today I had about 80 in total from my primary scans. Themes were Energy, Utilities and Healthcare, specifically Healthcare Providers. After sifting through the results I found two Energy stocks with excellent potential and two Consumer Staples stocks in Food Products.
Consumer Staples is an interesting area. After the Target debacle, stocks that got caught up in its vortex are now starting to come back to life. I was impressed with the two that I saw in my scans.
Remember we are still in a bear market environment so consider all investments short-term. Limiting exposure or applying hedges is a good idea. Currently I am still at 20% exposed with a 10% hedge. Given I'm on vacation I've refrained from adding new positions, but there are now pockets of strength that I am tempted to dabble in.
Would love some symbol requests for tomorrow! If you have something you're eyeing or a position you're uncertain about, send it in!
Thank you for your patience as my publishing schedule is different due to travel in Seattle.
Good Luck & Good Trading,
Erin
Today's "Diamonds in the Rough": ADM, BG, NBR and OVV.
Stocks to Review: ANTM, DTE, GOGO, SRE, ATO and NRGV.

RECORDING LINK (5/20/2022):
Topic: DecisionPoint Diamond Mine (5/20/2022) LIVE Trading Room
Start Time: May 20, 2022 09:00 AM
MeetingRecording Link.
Access Passcode: May#the20th
REGISTRATION FOR Friday 5/27 Diamond Mine:
When: May 27, 2022 09:00 AM Pacific Time (US and Canada)
Topic: DecisionPoint Diamond Mine 5/27/2022) LIVE Trading Room
Register in advance for this webinar HERE.
** Save the registration confirmation email with login instructions in case Zoom doesn't notify you in time.**

Free DP Trading Room (5/23) RECORDING LINK:
Topic: DecisionPoint Trading Room
Start Time: May 23, 2022 09:00 AM
Meeting Recording Link.
Access Passcode: MayDP@23
For best results, copy and paste the access code to avoid typos.
Welcome to DecisionPoint Daily Diamonds, wherein I highlight ten "Diamonds in the Rough" per week. These are selected from the results of my DecisionPoint Scans, which search for stocks that could benefit from the trend and condition of the market. Remember, these are not recommendations to buy or sell, but are the most interesting of the stocks that surfaced in my scans. My objective is to save you the work of the initial, tedious culling process, but you need to apply your own analysis to see if these stocks pique your interest as well. There are no guaranteed winners here!
"Predefined Scans Triggered" are taken from StockCharts.com using the "Symbol Summary" option instead of a "SharpChart" on the workbench.
Archer Daniels Midland Co. (ADM)
EARNINGS: 7/26/2022 (BMO)
Archer-Daniels-Midland Co. engages in the production of oilseeds, corn, wheat, cocoa, and other agricultural commodities. It operates through the following segments: Ag Services and Oilseeds, Carbohydrate Solutions, Nutrition, Other, and Corporate. The Ag Services and Oilseeds segment includes activities related to the origination, merchandising, crushing, and further processing of oilseeds, such as soybeans, and soft seeds, such as cottonseed, sunflower seed, canola, rapeseed, and flaxseed, into vegetable oils and protein meals. The Carbohydrate Solutions segment consists of corn and wheat wet and dry milling and other activities. The Nutrition segment serves various end markets including food, beverages, nutritional supplements, and feed and premix for livestock, aquaculture, and pet food. The Corporate segment represents results of early-stage start-up companies within ADM Ventures. The company founded in 1902 and is headquartered in Chicago, IL.
Predefined Scans Triggered: None.
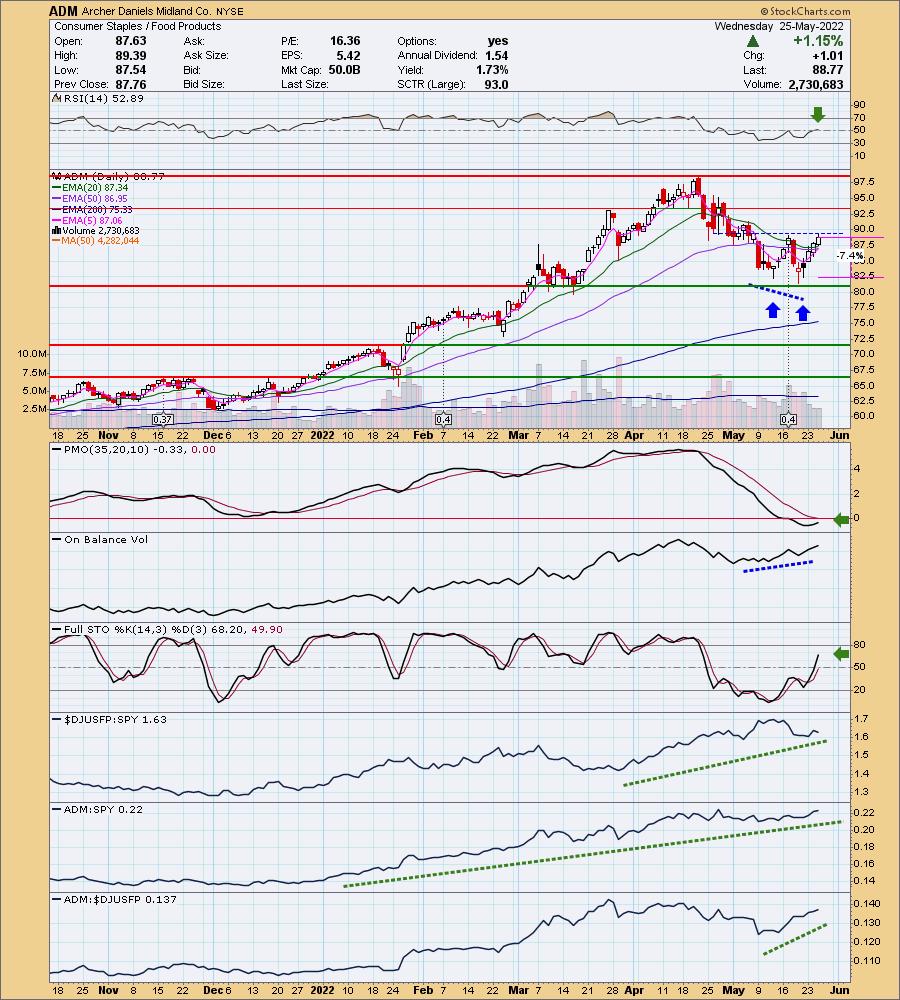
ADM is down -0.18% in after hours trading. Price has formed a bullish double-bottom that set up a positive OBV divergence. Price hasn't confirmed the pattern as it must break above the confirmation line. Indicators suggest it will. The RSI is in positive territory and not overbought. The PMO has bottomed and is headed for a crossover BUY signal. Stochastics are rising strongly and relative strength lines are in rising trends. The stop is set below the lowest closing price in the second bottom.
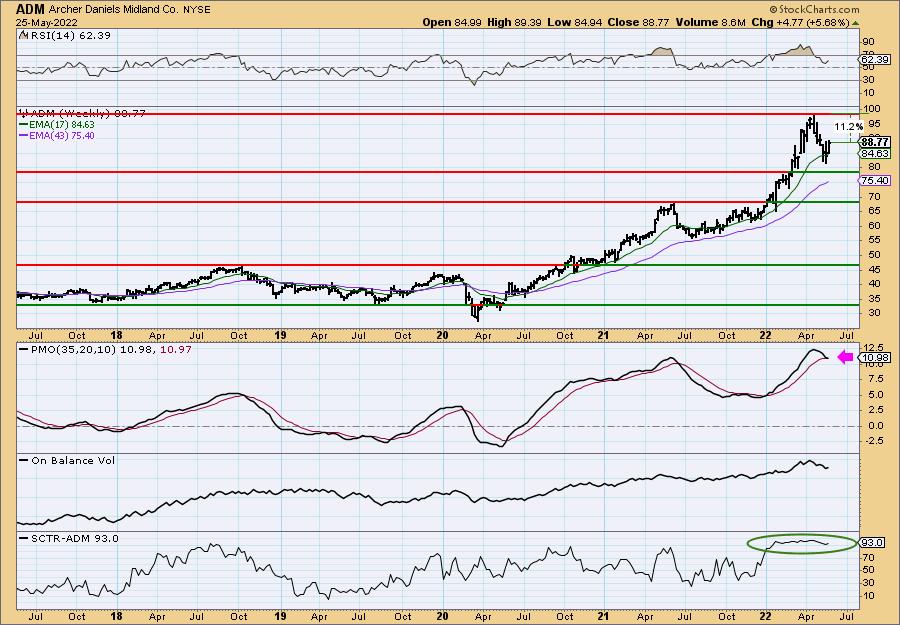
I didn't annotate it, but there is a pretty clear bull flag on the weekly chart. The weekly RSI is positive and rising. The weekly PMO is suspect, but it has so far avoided a negative crossover. Given the correction, I'm not surprised to see it reacting as it is. Upside potential if it reaches its all-time high is over 11%. I think we will see follow-through after a breakout based on the flag.
Bunge Ltd. (BG)
EARNINGS: 7/27/2022 (BMO)
Bunge Ltd. operates as a holding company. engages in the supply and transportation of agricultural commodities. It operates through the following segments: Agribusiness, Refined and Specialty Oils, Milling, and Sugar and Bioenergy. The Agribusiness segment is involved in the purchase, storage, transportation, processing, and sale of agricultural commodities and commodity products. The Refined and Specialty Oils segment engages in the processing, production, and marketing of products derived from vegetable oils. The Milling segment consists of the processing, production, and marketing of products derived primarily from wheat and corn. The Sugar and Bioenergy segment includes the manufacture and marketing of sugar and ethanol derived from sugarcane, as well as energy derived from the sugar and ethanol production process. The company was founded by Johann Peter Gottlieb Bunge in 1818 and is headquartered in St. Louis, MO.
Predefined Scans Triggered: None.
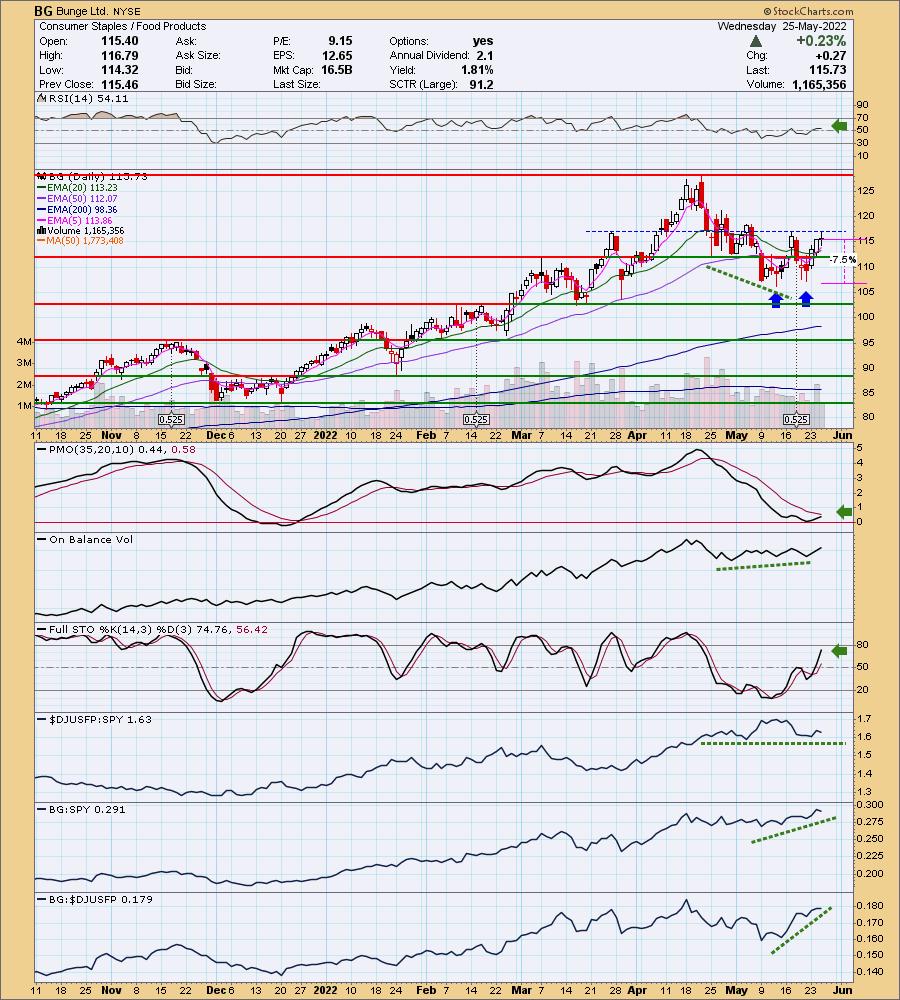
BG is up +1.10% in after hours trading. The chart is similar to ADM with a double-bottom and the need to break out above the confirmation line. The RSI is positive and the PMO is nearing a crossover BUY signal in oversold territory. There is a positive OBV divergence. Stochastics are rising strongly and are nearing 80. Relative strength hasn't been great for the group, but BG itself is showing outperformance against the SPY and group. The stop is set below the lowest closing price on the first bottom.
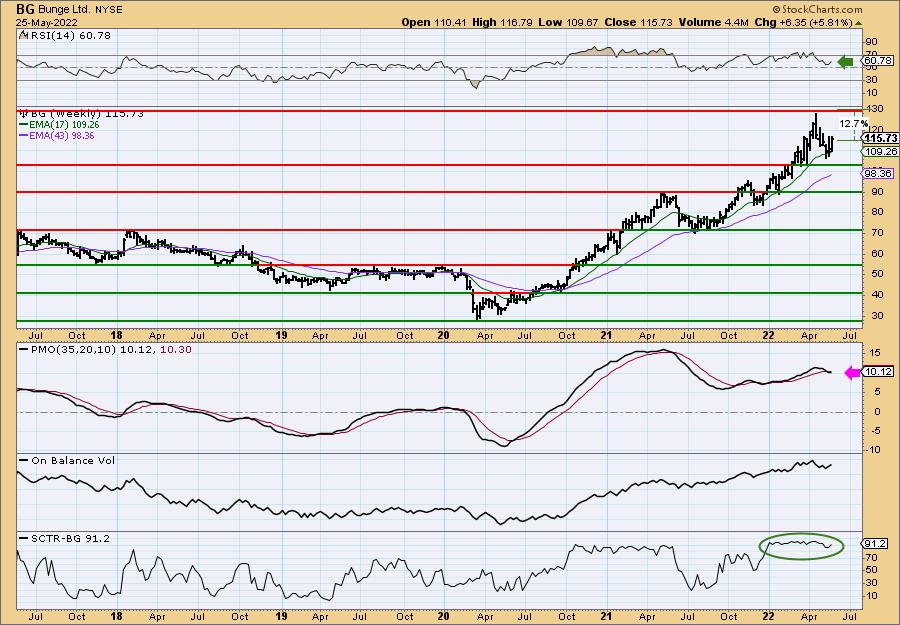
There is a bull flag on the weekly chart. The weekly RSI is rising in positive territory. The weekly PMO is on a SELL signal which isn't surprising given the correction in price. It does appear to be flattening. The SCTR is strong which tells us it has excellent internal strength overall. The upside target is more than 12%.
Nabors Industries, Inc. (NBR)
EARNINGS: 7/26/2022
Nabors Industries Ltd. engages in the provision of platform work over and drilling rigs. It operates through the following segments: U.S. Drilling, Canada Drilling, International Drilling, Drilling Solutions, and Rig Technologies. The U.S. Drilling segment includes land drilling activities in the lower 48 states and Alaska, as well as offshore operations in the Gulf of Mexico. The Canada segment consists of land-based drilling rigs in Canada. The International segment focuses in maintaining a footprint in the oil and gas market, most notably in Saudi Arabia, Algeria, Argentina, Colombia, Kazakhstan, and Venezuela. The Drilling Solutions segment offers drilling technologies, such as patented steering systems and rig instrumentation software systems that enhance drilling performance and wellbore placement. The Rig Technologies segment comprises Canrig, which manufactures and sells top drives, catwalks, wrenches, drawworks, and drilling related equipment, such as robotic systems and downhole tools. The company was founded by Clair Nabors in 1952 and is headquartered in Hamilton, Bermuda.
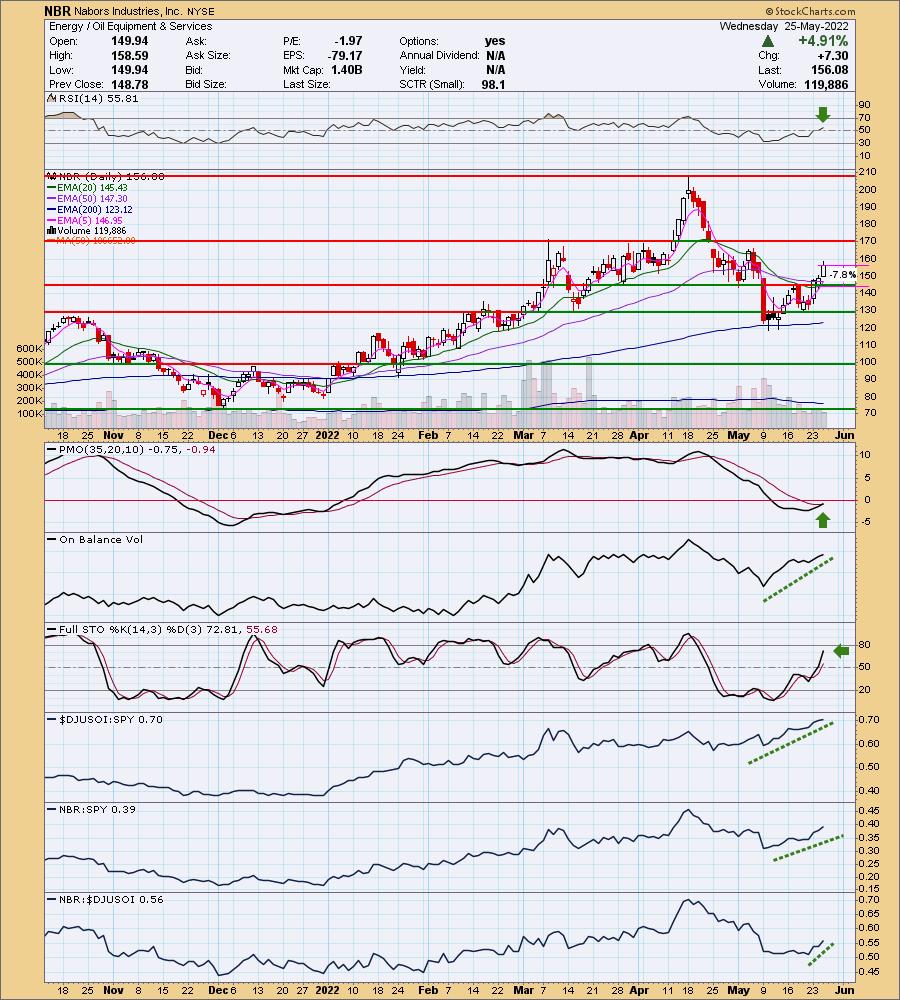
Predefined Scans Triggered: P&F Ascending Triple Top Breakout and P&F Double Top Breakout.
NBR is up +5.07% in after hours trading, so I think I'm onto something here. Finding somewhat beat down stocks in the strong Energy sector is a reversal that I'm willing to present in this bear market. Price broke out above the 5/20/50-day EMAs after bouncing off the 200-day EMA. The RSI is now positive and not overbought. Today saw a PMO crossover BUY signal. Volume is coming in based on the OBV rising strongly. Stochastics are rising and nearing 80. Relative strength is favorable for the group and NBR. It is also picking up strength among its peers. The stop is set below the key moving averages and last May top.
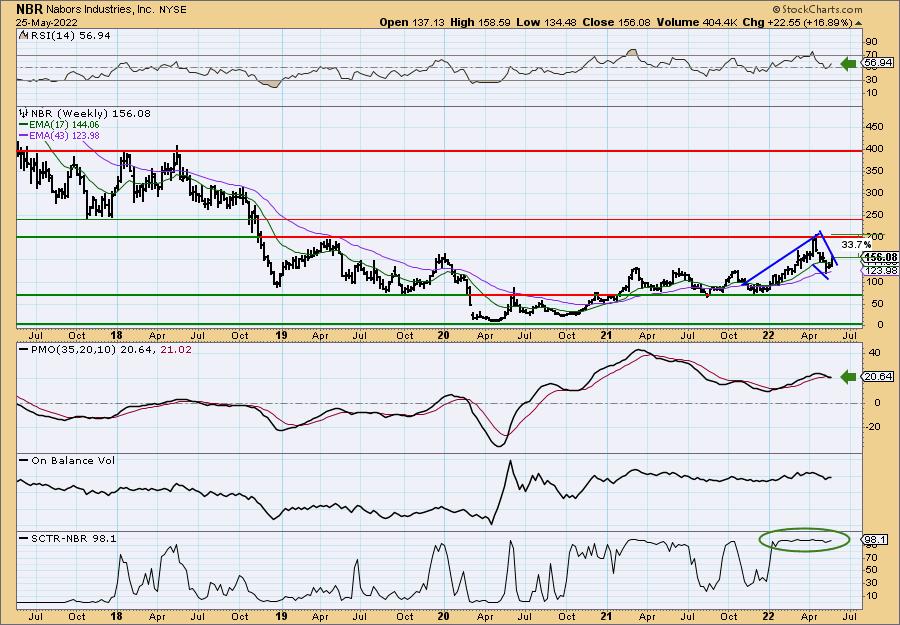
We have a bull flag on the weekly chart and a positive weekly RSI that is rising. The weekly PMO is suspect as it sits on a crossover SELL signal, but it is flattening out already. The SCTR tells us that this has been a top performer and that internal strength is excellent. If it can challenge this year's high, that would be an over 33% gain.
Ovintiv Inc (OVV)
EARNINGS: 7/27/2022 (AMC)
Ovintiv, Inc. engages in the production and development of oil, natural gas liquids and natural gas producing plays. The firm operates through the following segments: Canadian Operations, USA Operations and Market Optimization. The Canadian Operations segment includes the exploration for, development of, and production of oil, NGLs, natural gas and other related activities within Canada. The USA Operations segment includes the exploration for, development of, and production of oil, NGLs, natural gas and other related activities within the United States. The Market Optimization segment's activities are managed by the Midstream, Marketing & Fundamentals team, which is responsible for the sale of the company's proprietary production to third party customers. The company was founded in 1881 and is headquartered in Denver, CO.
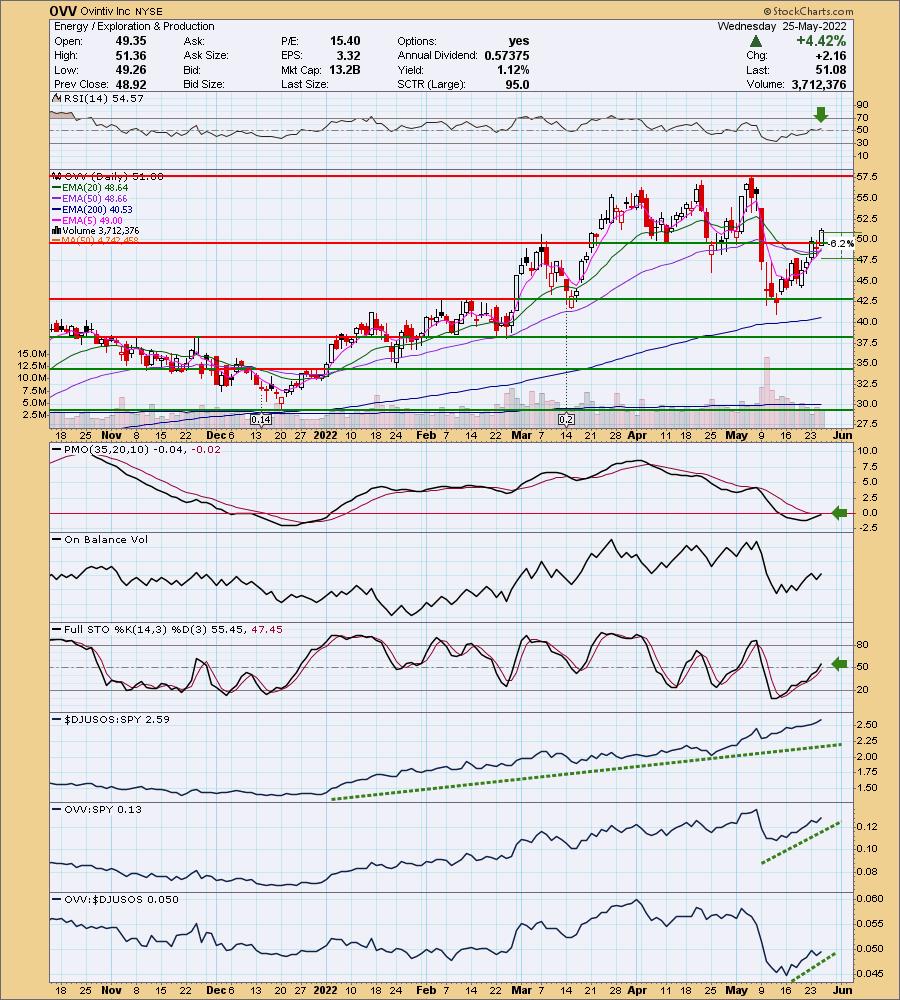
Predefined Scans Triggered: Moved Above Ichimoku Cloud, Parabolic SAR Buy Signals and P&F Double Top Breakout.
OVV is up +0.76% in after hours trading. Here is another beat down Energy stock that is reversing. Price broke above strong resistance today. The RSI is positive and rising. The PMO is nearing a crossover BUY signal. Stochastics are rising and relative strength is positive across the board.The stop can be set thinly below the key moving averages. I opted to put it below the April closing low.
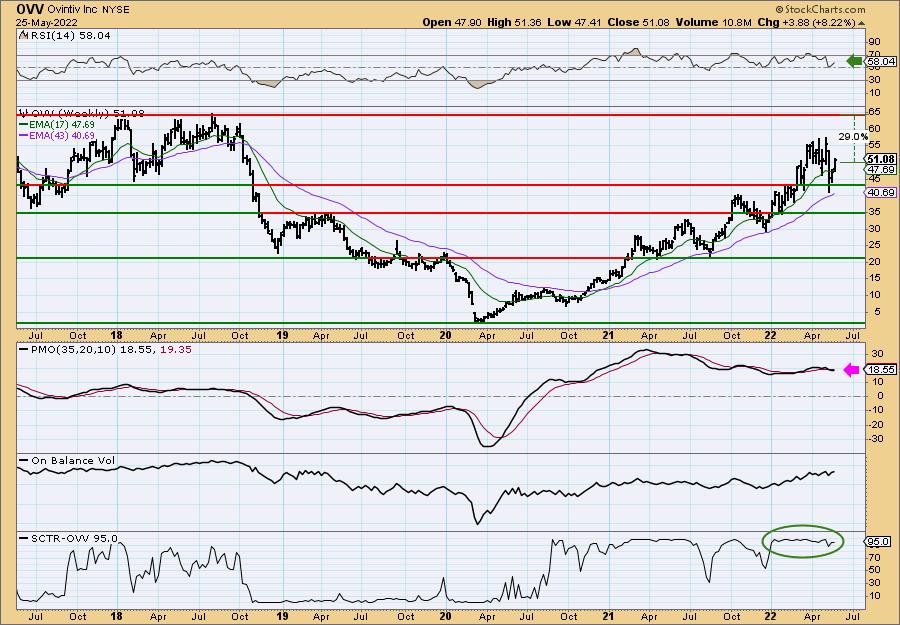
Price bounced off long-term support and the 43-week EMA. The weekly RSI is positive and rising. The weekly PMO is on a SELL signal, but it is flattening. The SCTR has been very strong all year. Upside potential is tasty at 29%.
Don't forget, on Thursdays I look at reader-requested symbols, click HERE to shoot me an email. I read every email I receive and try to answer them all!
Current Market Outlook:
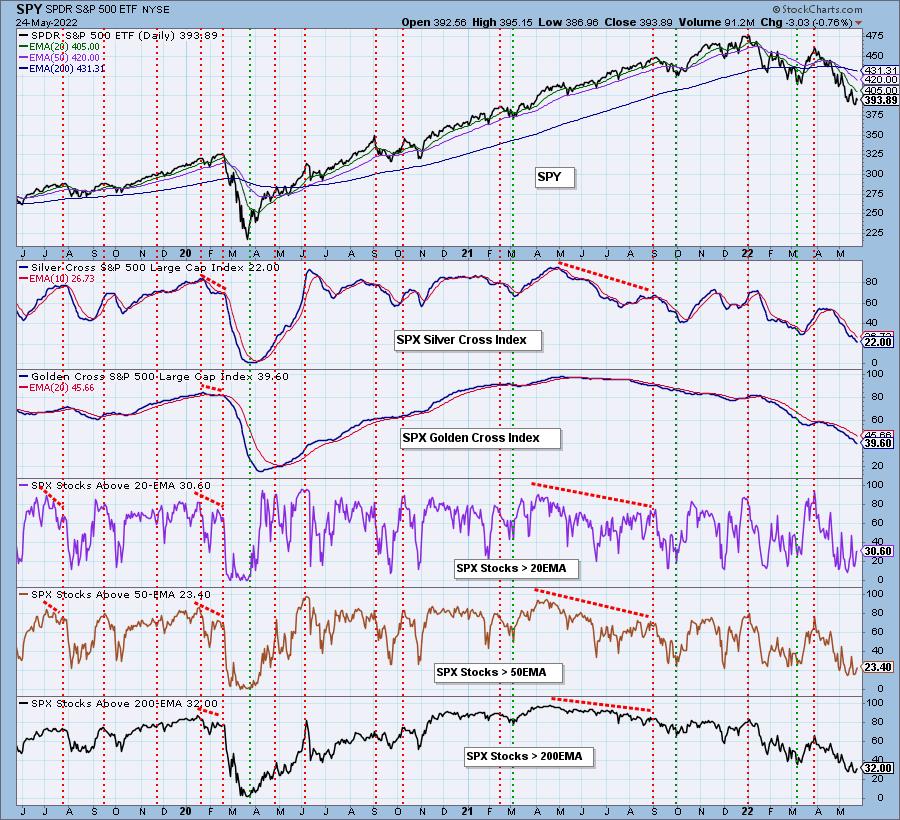
Market Environment: It is important to consider the odds for success by assessing the market tides. The following chart uses different methodologies for objectively showing the depth and trend of participation for intermediate- and long-term time frames.
- The Silver Cross Index (SCI) shows the percentage of SPX stocks on IT Trend Model BUY signals (20-EMA > 50-EMA)
- The Golden Cross Index (GCI) shows the percentage of SPX stocks on LT Trend Model BUY signals (50-EMA > 200-EMA)
Don't forget that as a "Diamonds" member, you have access to our GCI/SCI curated ChartList on DecisionPoint.com. You'll find it under "Members Only" links on the left side on the Blogs and Links Page.
Here is the current chart:
Full Disclosure: I'm 20% exposed with 10% hedge. I'm considering a purchase of AT&T (T).
I'm required to disclose if I currently own a stock and/or may buy/short it within the next 72 hours.
"Technical Analysis is a windsock, not a crystal ball." - Carl Swenlin
(c) Copyright 2022 DecisionPoint.com
Watch the latest episode of DecisionPoint with Carl & Erin Swenlin on Mondays 7:00p EST or on the DecisionPoint playlist on the StockCharts TV YouTube channel here!
NOTE: The stocks reported herein are from mechanical trading model scans that are based upon moving average relationships, momentum and volume. DecisionPoint analysis is then applied to get five selections from the scans. The selections given should prompt readers to do a chart review using their own analysis process. This letter is not a call for a specific action to buy, sell or short any of the stocks provided. There are NO sure things or guaranteed returns on the daily selection of "Diamonds in the Rough."
Helpful DecisionPoint Links:
DecisionPoint Shared ChartList and DecisionPoint Chart Gallery
Price Momentum Oscillator (PMO)
Swenlin Trading Oscillators (STO-B and STO-V)
For more links, go to DecisionPoint.comIAMONDS