
The market took a beating today. The only issues that were up were Bonds, Gold, Nat Gas and SPCX (SPAC & New Issues ETF). That's it on our ETF Tracker which covers nearly all of the major indexes and industry groups. While Bonds did have a good day, it is likely to be short-lived given interest rates are still in a rising trend.
Consequently yesterday's picks suffered. It is likely time to populate your watch lists given the bear market is clearly not over. I do have three "longs" for you today based on the Diamond PMO Scan. This scan picks up stocks that have EMAs configured positively (fastest on top, slowest on bottom). Trying to pick up reversals is dangerous business so I am sticking to my scan that catches stocks mostly in uptrends. I put "longs" in quotation marks because all of your investments have short-term horizons. If you're going to be in, you'll need your finger firmly on the pulse of your portfolio.
Themes for today's scans were Pipelines and Utilities. I do have two Energy picks, one is a Pipeline stock. I opted not to present OGS and XEL which are in Utilities, but they are worth a gander. I added a Materials/Specialty Chemicals stock that is poised to do well based on a positive OBV divergence. Still, trade carefully. I'm not making much right now because I am heavily hedged, but it has prevented serious losses on the current volatility in the market. I'm 20% exposed with 10% in hedges.
Good Luck & Good Trading,
Erin
Today's "Diamonds in the Rough": NTR, PBA and XES.
Stocks to Review: BAYRY, OGS, IONS, NVS and XEL.

RECORDING LINK (5/13/2022):
Topic: DecisionPoint Diamond Mine (5/13/2022) LIVE Trading Room
Start Time: May 13, 2022 09:00 AM
Meeting Recording Link.
Access Passcode: May@0513
REGISTRATION FOR Friday 5/20 Diamond Mine:
When: May 20, 2022 09:00 AM Pacific Time (US and Canada)
Topic: DecisionPoint Diamond Mine (5/20/2022) LIVE Trading Room
Register in advance for this webinar HERE.
** Save the registration confirmation email with login instructions in case Zoom doesn't notify you in time.**

Free DP Trading Room (5/16) RECORDING LINK:
Topic: DecisionPoint Trading Room
Start Time: May 16, 2022 08:59 AM
Meeting Recording Link.
Access Passcode: MondayMay#16
For best results, copy and paste the access code to avoid typos.
Welcome to DecisionPoint Daily Diamonds, wherein I highlight ten "Diamonds in the Rough" per week. These are selected from the results of my DecisionPoint Scans, which search for stocks that could benefit from the trend and condition of the market. Remember, these are not recommendations to buy or sell, but are the most interesting of the stocks that surfaced in my scans. My objective is to save you the work of the initial, tedious culling process, but you need to apply your own analysis to see if these stocks pique your interest as well. There are no guaranteed winners here!
"Predefined Scans Triggered" are taken from StockCharts.com using the "Symbol Summary" option instead of a "SharpChart" on the workbench.
Nutrien Ltd. (NTR)
EARNINGS: 8/3/2022 (AMC)
Nutrien Ltd. is a crop nutrient company, which engages in the production and distribution of products for agricultural, industrial, and feed customer. It operates through the following segments: Retail, Potash, Nitrogen, and Phosphate. The Retail segment distributes crop nutrients, crop protection products, seed, and merchandise. The Potash, Nitrogen, and Phosphate segments produces differentiated chemical nutrient contained in each products. The company is headquartered in Calgary, Canada.
Predefined Scans Triggered: Bullish MACD Crossovers, Parabolic SAR Buy Signals and P&F Double Top Breakout.
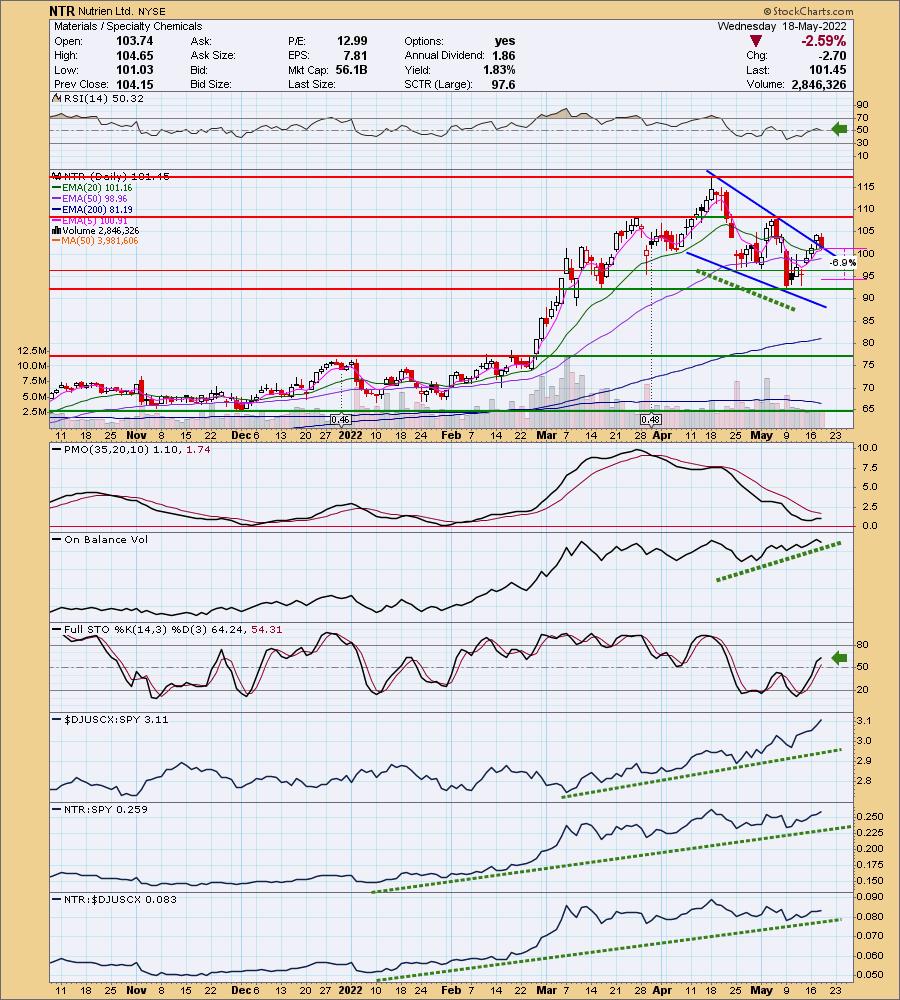
NTR is down -0.10% in after hours trading. As noted in the description, this is a play on fertilizer. These chemical companies enjoyed a nearly parabolic rally when the war started. Since then many of these stocks have pulled back or corrected. NTR is one of them. I like the set-up for a few reasons. First we have a bullish falling wedge. Although price pulled back after yesterday's breakout, it remains mostly above the top of the wedge. The RSI is positive which is good given it had an over 2.5% decline today. The PMO flattened with today's action but is still technically rising. The OBV positive divergence is key here. It tells us that we didn't lose a lot of volume on the declines so internal strength is still present. Stochastics also suggest internal strength as they are above net neutral (50) and didn't fall on today's decline. Relative strength studies are bullish. I set the stop halfway down the support zone between the April low and May low.
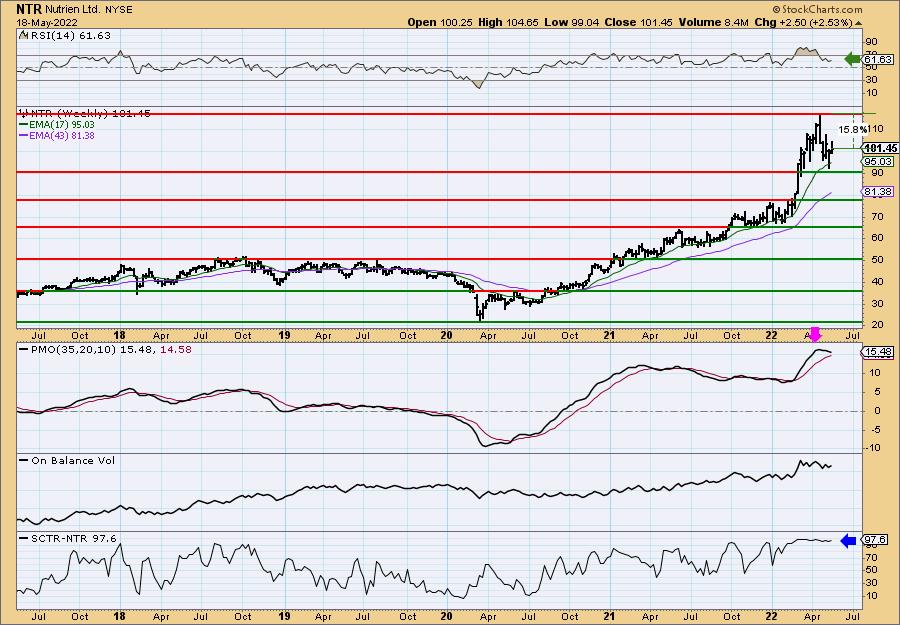
The weekly PMO is negative as it is falling in overbought territory. However, the RSI is firmly positive and the SCTR tells us this is a strong relative performer against all large-cap stocks. The upside target is all-time highs which is about 16% away.
Pembina Pipeline Corp. (PBA)
EARNINGS: 8/4/2022 (AMC)
Pembina Pipeline Corp. engages in the provision of transportation and midstream services. It operates through the following segments: Pipelines, Facilities, Marketing and New Ventures, and Corporate. The Pipelines segment includes conventional, oil sands and transmission pipeline systems, crude oil storage and terminalling business and related infrastructure. The Facilities segment consists of processing and fractionation facilities and related infrastructure that delivers the firm's customers with natural gas and NGL services. The Marketing and New Ventures segment undertakes value-added commodity marketing activities, including buying and selling products and optimizing storage opportunities. The company was founded on September 29, 1954 and is headquartered in Calgary, Canada.
Predefined Scans Triggered: New CCI Buy Signals and Parabolic SAR Buy Signals.
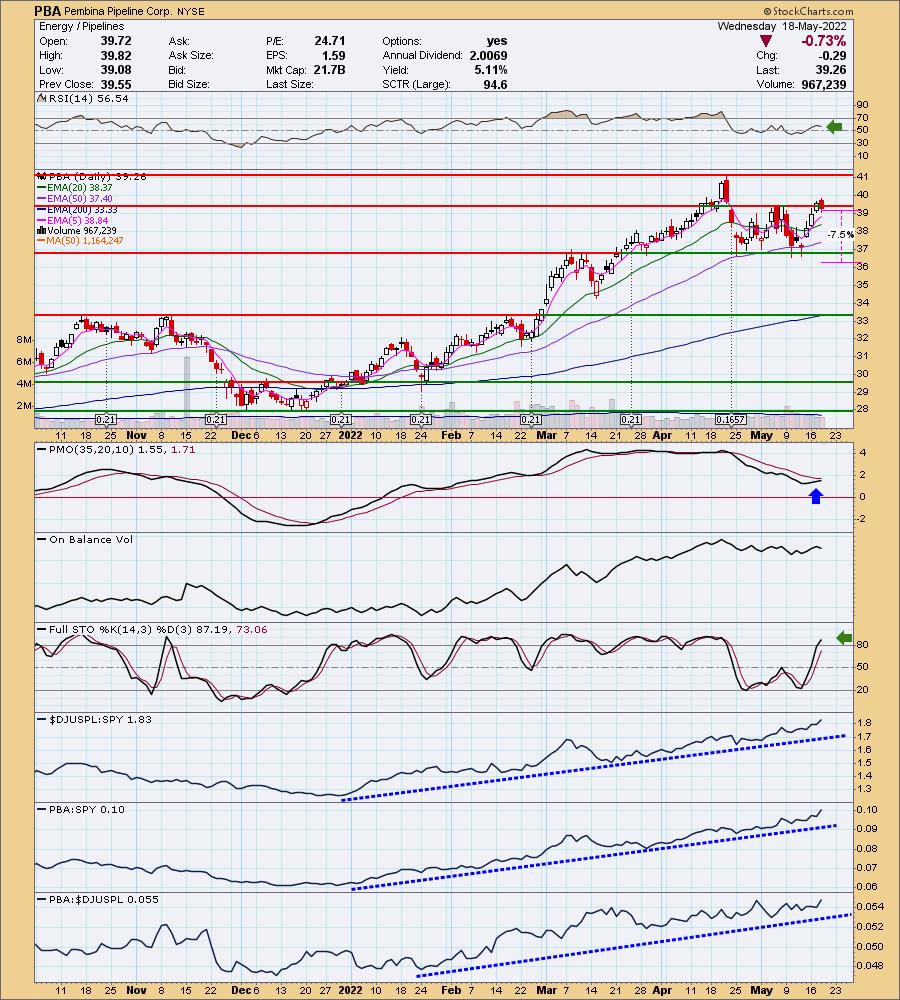
PBA is down -0.53% in after hours trading. Yesterday's breakout from the trading zone was encouraging. I am not thrilled with the close which put it back into the trading range, but indicators are positive enough. The RSI is positive and the PMO is nearing a crossover BUY signal. Stochastics are rising and are above 80. It's been a strong relative performer all year. The stop is set below the trading zone at around $36.80.
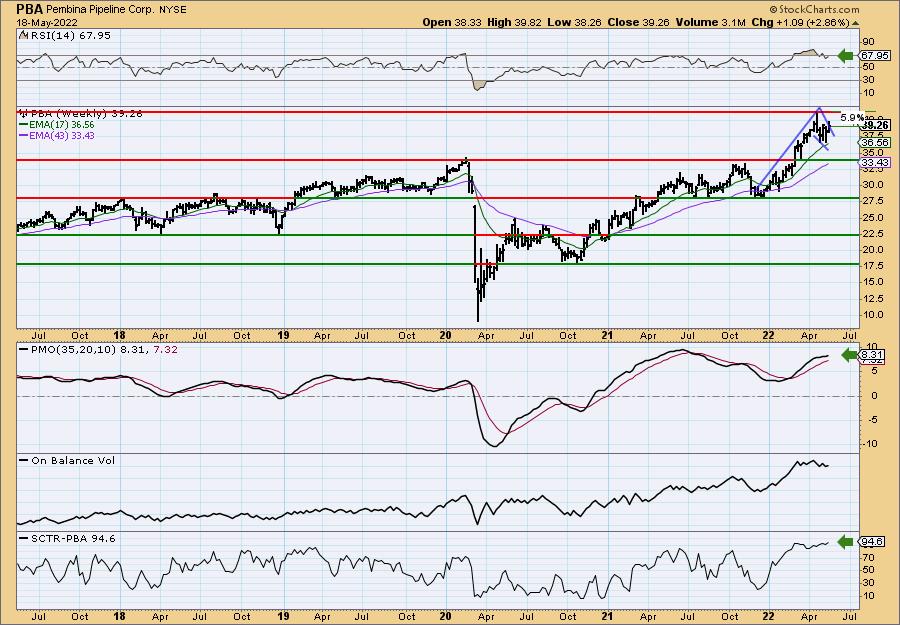
The weekly RSI is very positive and not that overbought. The PMO is flat but trending higher. There is a bullish flag formation visible on the weekly chart that suggest a breakout to fresh all-time highs. The SCTR tells us what relative strength implied on the daily chart. This was is an outperformer amongst its peers. Since all-time highs are so close, consider an upside target of about 14% at $44.75.
SPDR S&P Oil & Gas Equipment & Services ETF (XES)
EARNINGS: N/A
XES tracks an equal-weighted index of companies in the oil & gas equipment and services sub-industry of the S&P Total Market Index.
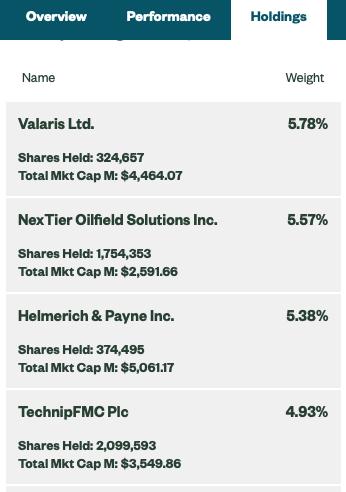
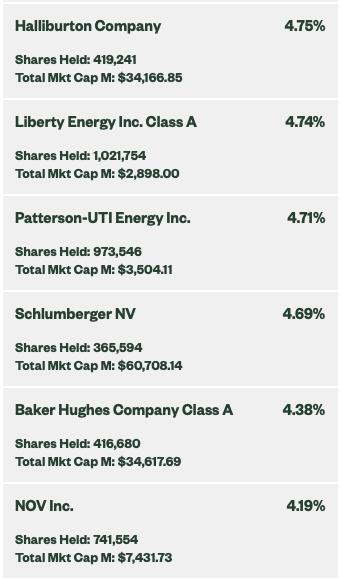
Predefined Scans Triggered: Elder Bar Turned Blue and Bullish MACD Crossovers.
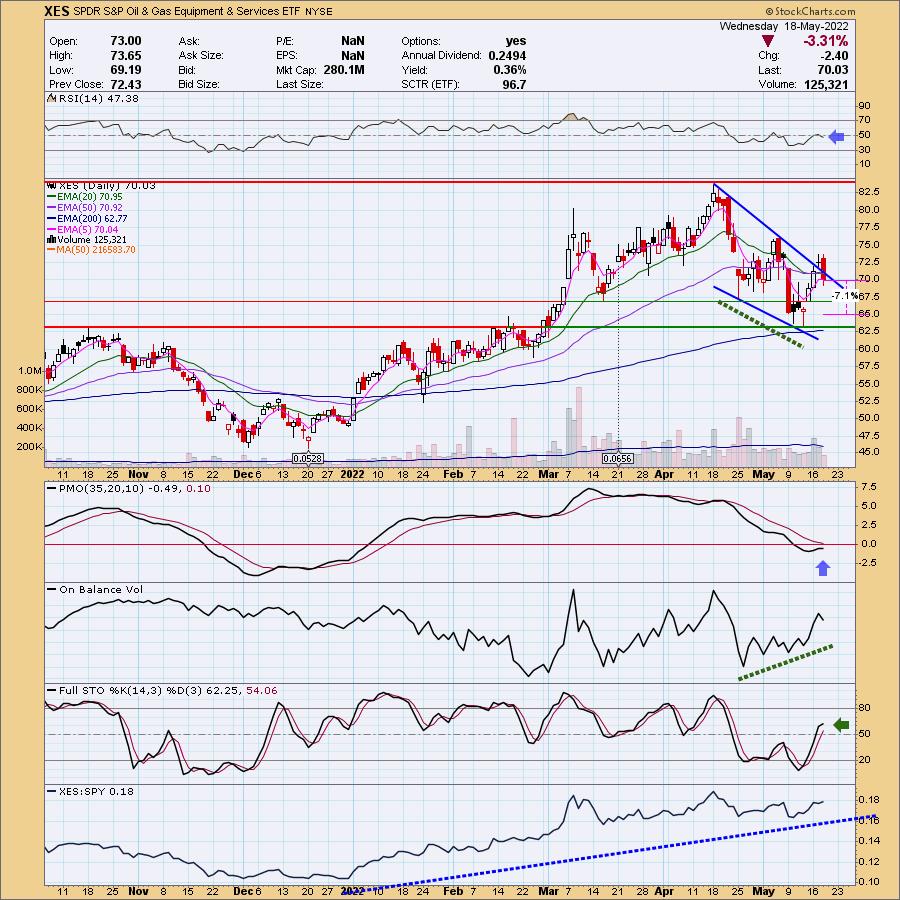
XES is up a whopping +6.77% in after hours trading. I covered XES on April 29th 2021. XES went into a trading range after and the stop was eventually hit after a gain of about 25%. There is a bullish falling wedge, but it did close back within the wedge. A 20/50-day EMA negative crossover is still being avoided. The RSI doesn't look great in negative territory, but the strong positive OBV divergence had me forgive that. The PMO is trying to turn down below the zero line, but it hasn't yet (if it does, I would watch list this one) and based on after hours trading, it could be avoided. This ETF is a strong relative performer. The stop is set around $65 which is below support at the late March low and April low.
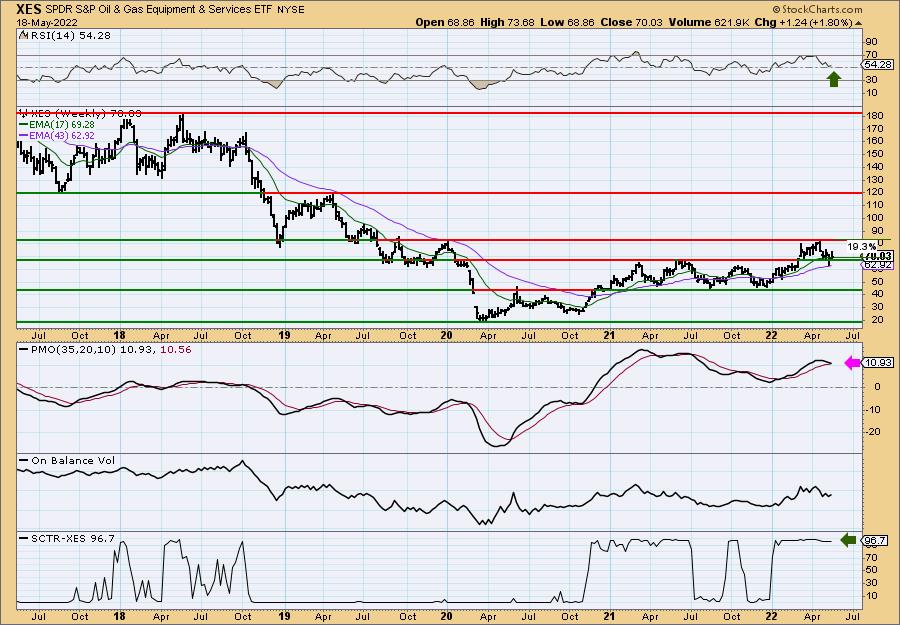
Price has recaptured long-term support at the 2021 highs. The weekly PMO doesn't look great, but it so far hasn't given us the negative crossover. The weekly RSI is still positive and ticking up right above net neutral (50). The SCTR tells us that it is one of the elite ETFs. I didn't draw it in, but you could make a case for a bull flag forming this year.
Don't forget, on Thursdays I look at reader-requested symbols, click HERE to shoot me an email. I read every email I receive and try to answer them all!
Current Market Outlook:
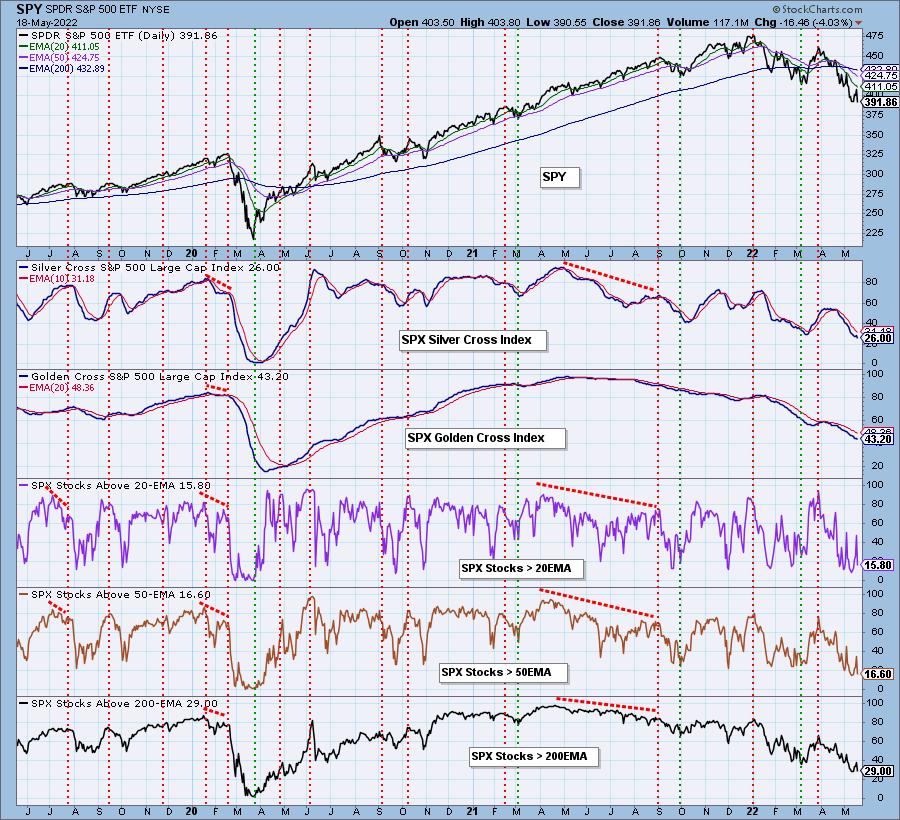
Market Environment: It is important to consider the odds for success by assessing the market tides. The following chart uses different methodologies for objectively showing the depth and trend of participation for intermediate- and long-term time frames.
- The Silver Cross Index (SCI) shows the percentage of SPX stocks on IT Trend Model BUY signals (20-EMA > 50-EMA)
- The Golden Cross Index (GCI) shows the percentage of SPX stocks on LT Trend Model BUY signals (50-EMA > 200-EMA)
Don't forget that as a "Diamonds" member, you have access to our GCI/SCI curated ChartList on DecisionPoint.com. You'll find it under "Members Only" links on the left side on the Blogs and Links Page.
Here is the current chart:
Full Disclosure: I'm 20% exposed with 10% hedge.
I'm required to disclose if I currently own a stock and/or may buy/short it within the next 72 hours.
"Technical Analysis is a windsock, not a crystal ball." - Carl Swenlin
(c) Copyright 2022 DecisionPoint.com
Watch the latest episode of DecisionPoint with Carl & Erin Swenlin on Mondays 7:00p EST or on the DecisionPoint playlist on the StockCharts TV YouTube channel here!
NOTE: The stocks reported herein are from mechanical trading model scans that are based upon moving average relationships, momentum and volume. DecisionPoint analysis is then applied to get five selections from the scans. The selections given should prompt readers to do a chart review using their own analysis process. This letter is not a call for a specific action to buy, sell or short any of the stocks provided. There are NO sure things or guaranteed returns on the daily selection of "Diamonds in the Rough."
Helpful DecisionPoint Links:
DecisionPoint Shared ChartList and DecisionPoint Chart Gallery
Price Momentum Oscillator (PMO)
Swenlin Trading Oscillators (STO-B and STO-V)
For more links, go to DecisionPoint.com