
Picking a theme for today was easy given the plethora of Utilities stocks visible in my scan results. However, there were two other groups that made an appearance and each had to have their due.
The industry groups that had the most interesting charts were Containers & Packaging and a big vote getter, Municipal Bond Funds. I have one "Diamond in the Rough" from each including a Multi-utility stock.
It's getting difficult to maneuver this market, but it is far easier now than earlier in the year or even a few weeks ago. Back then there were zero pockets of strength. Now we have multiple choices within industry groups. A market rally will likely come off the back of defensive sectors like Healthcare, Utilities and Staples so that is where I'm targeting my portfolio and "Diamonds in the Rough".
Please send me your symbol requests for possible inclusion in tomorrow's DP Diamonds Report. Mail them here or use my StockCharts.com email to share your ChartLists directly (erinh@stockcharts.com).
Good Luck & Good Trading!
Erin
Today's "Diamonds in the Rough": AMCR, NAC and WEC.
Stocks to Review: ATO, CPK, GPK, HXL, PCYO, PFE, RSG and VCV.

RECORDING LINK (6/24/2022):
Topic: DecisionPoint Diamond Mine (6/24/2022) LIVE Trading Room
Start Time: Jun 24, 2022 09:02 AM
Meeting Recording Link
Access Passcode: June#24th
REGISTRATION FOR Friday 7/1 Diamond Mine:
When: Jul 1, 2022 09:00 AM Pacific Time (US and Canada)
Topic: DecisionPoint Diamond Mine (7/1/2022) LIVE Trading Room
Register in advance for this webinar HERE.
Save the registration confirmation email with login instructions in case Zoom doesn't notify you in time.

Free DP Trading Room (6/27/2022) RECORDING LINK:
Topic: DecisionPoint Trading Room
Start Time: Jun 27, 2022 08:59 AM
Meeting Recording Link
Access Passcode: June#27th
For best results, copy and paste the access code to avoid typos.
Welcome to DecisionPoint Daily Diamonds, wherein I highlight ten "Diamonds in the Rough" per week. These are selected from the results of my DecisionPoint Scans, which search for stocks that could benefit from the trend and condition of the market. Remember, these are not recommendations to buy or sell, but are the most interesting of the stocks that surfaced in my scans. My objective is to save you the work of the initial, tedious culling process, but you need to apply your own analysis to see if these stocks pique your interest as well. There are no guaranteed winners here!
"Predefined Scans Triggered" are taken from StockCharts.com using the "Symbol Summary" option instead of a "SharpChart" on the workbench.
Amcor plc (AMCR)
EARNINGS: 8/16/2022 (AMC)
Amcor Plc operates as a holding company, which engages in the consumer packaging business. It operates through the Flexibles and Rigid Packaging segments. The Flexibles segment develops and supplies flexible packaging globally. The Rigid Plastics segment manufactures rigid plastic containers and related products. The company was founded 1926 and is headquartered in Warmley, the United Kingdom.
Predefined Scans Triggered: Moved Above Ichimoku Cloud.
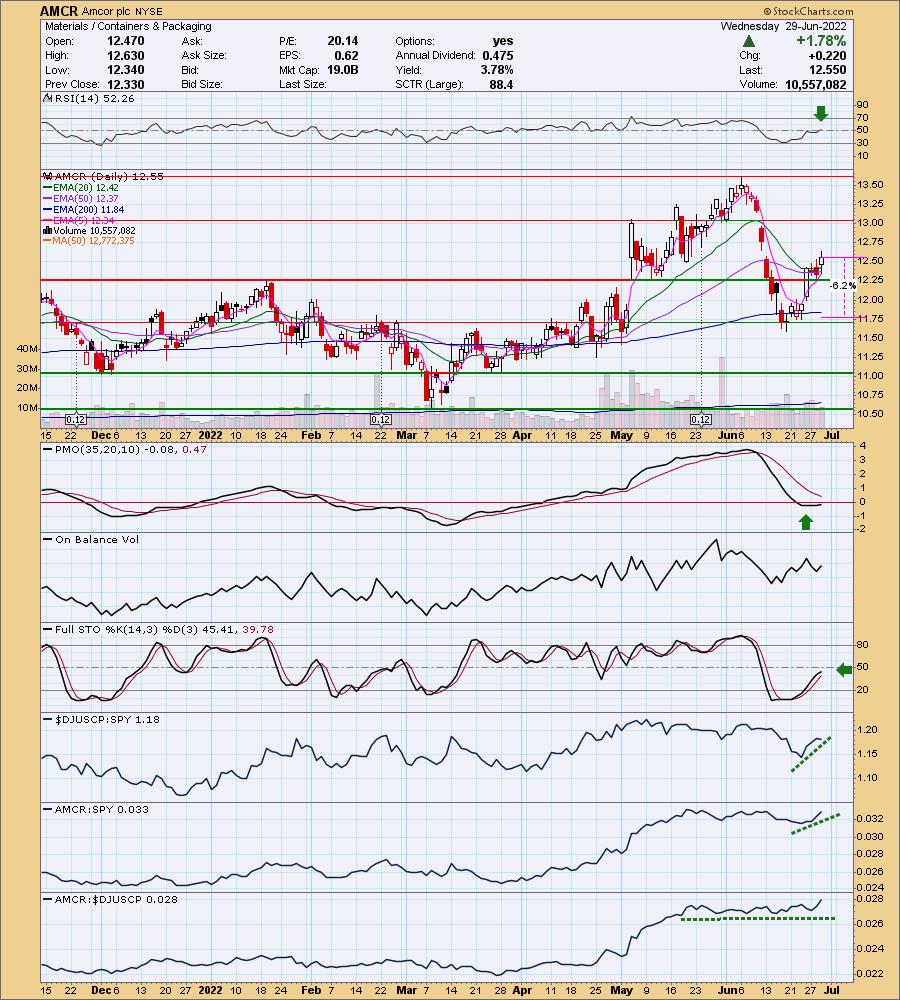
AMCR is up +0.72% in after hours trading. I had to decide between GPK and this one. I chose this one as today it broke out strongly above the 20/50-day EMAs where GPK was stuck beneath both EMAs. After such a swift decline, it isn't surprising that it is taking the PMO time to turn around. In the meantime, the RSI has moved into positive territory and Stochastics are nearing positive territory above net neutral (50). This bounce came off the 200-day EMA. The OBV is rising to confirm this rally and relative strength for the group is good against the SPY. While AMCR is only traveling inline with the group, that's fine given the group's outperformance. The stop is set beneath the 200-day EMA.
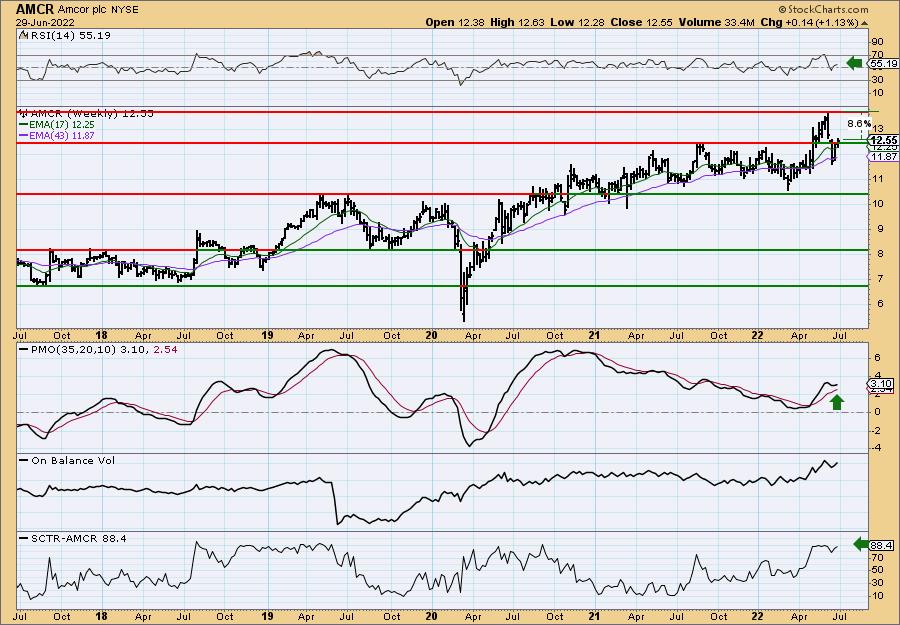
The weekly PMO has bottomed above the signal line. Notice that this week, price is popping above overhead resistance at the 2021 high. The SCTR is healthy. Upside potential is limited based on overhead resistance, but I am expecting a breakout. Consider an upside target of 14% around $14.31.
Nuveen CA Quality Muni Income Fund (NAC)
EARNINGS: N/A
Nuveen California Quality Municipal Income Fund operates as a closed-end investment fund/investment trust. The fund seeks current income exempt from both regular federal income taxes and California personal income tax by investing its assets majorly in investment-grade quality municipal bonds. The company was founded on December 1, 1998 and is headquartered in Chicago, IL.
Predefined Scans Triggered: Bullish MACD Crossovers and P&F High Pole.
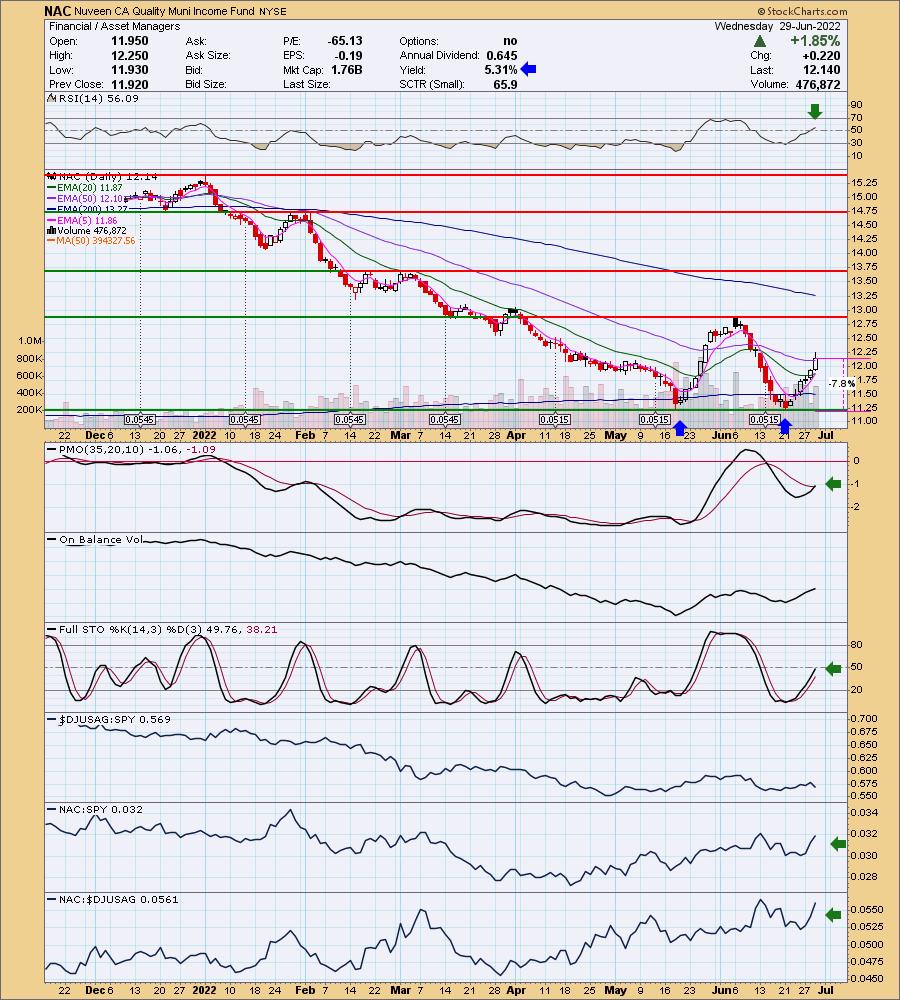
NAC is unchanged in after hours trading. I find it kind of funny that a company that deals in California municipal bonds is headquartered in Chicago, but currently they are doing something right given recent rally. It's run higher for six trading days, but it looks like it has room to run further. This stock provides a 5.31% yield. The RSI is positive and rising. The PMO triggered a crossover BUY signal today. There is a large double-bottom pattern that would imply a minimum upside target of $14.75. Stochastics are rising and nearly made it into positive territory today. The group is holding its own, but NAC is outperforming the SPY and is a clear outperformer within this group. The stop is set below the double-bottom pattern. If it fails at the confirmation line of the chart pattern, I don't think I'd wait for it to actually drop that low.
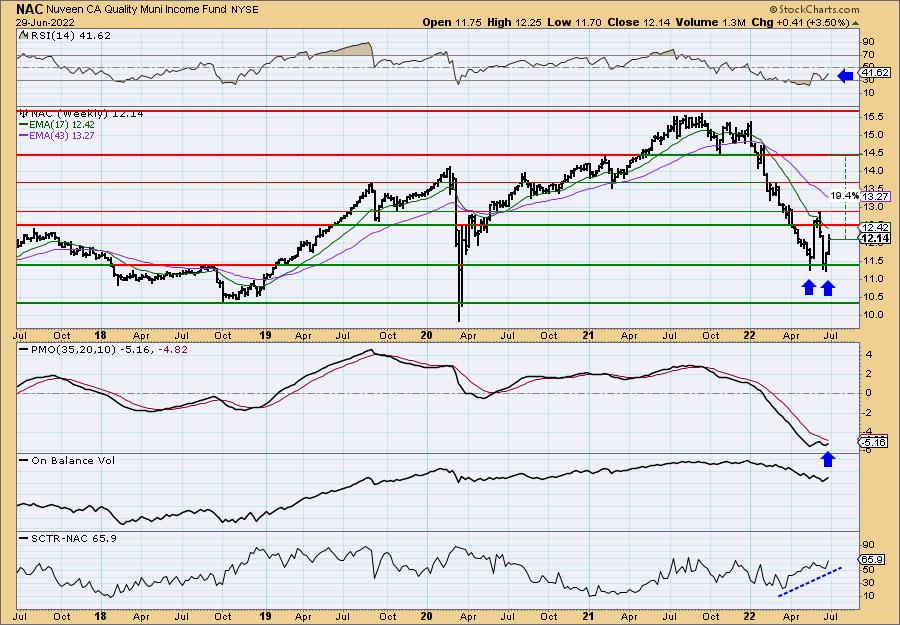
The weekly chart shows the double-bottom. The weekly RSI is still negative, but it is rising. The weekly PMO has bottomed again. The SCTR didn't see much damage on the correction, but it is on the low side of my 60 to 80 threshold. Upside potential if it can reach the minimum upside target of the pattern would be 19.4%.
WEC Energy Group, Inc. (WEC)
EARNINGS: 8/2/2022 (BMO)
WEC Energy Group, Inc. is a holding company, which engages in the generation and distribution of electricity and natural gas. It operates through the following segments: Wisconsin, Illinois, Other States, Electric Transmission, Non-Utility Energy Infrastructure and Corporate & Other. The Wisconsin segment refers to the electric and gas utility operations. The Illinois segment deals with natural gas utility and non-utility activities. The Other States segment pertains to natural gas operations of the firm's subsidiaries. The Electric Transmission segment holds interests in state regulatory commissions. The Non-Utility Energy Infrastructure segment includes Wisconsin Electric Power, which owns and leases generating facilities. The Corporate and Other segment refers to the firm's administrative and holding activities. The company was founded in 1981 and is headquartered in Milwaukee, WI.
Predefined Scans Triggered: P&F Low Pole.
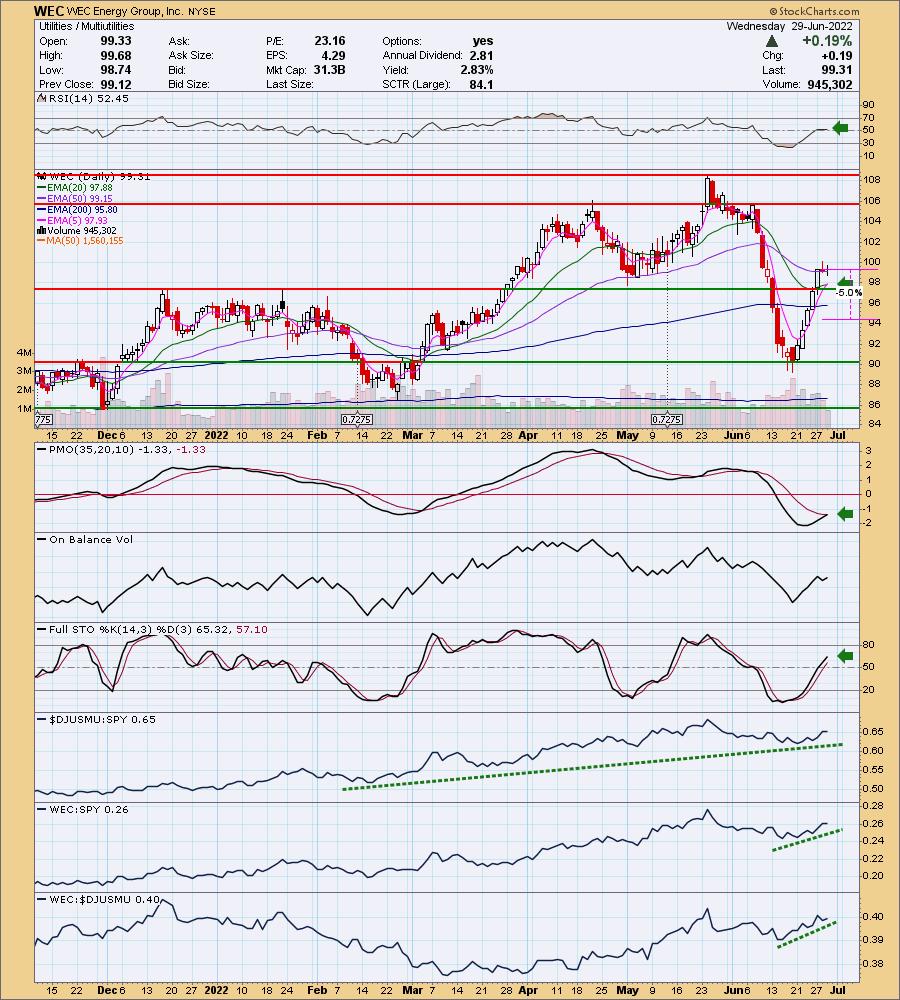
WEC is unchanged in after hours. I covered WEC right before the COVID crash on February 26th 2020 so the position is closed. The recovery from the deep correction earlier this month is impressive. This is a "V" bottom pattern that tells us to expect a full retracement of the correction along with a breakout at resistance. The RSI has flattened as price consolidates. We have a new ST Trend Model BUY signal on a 5/20-day EMA crossover. The PMO is triggering a crossover BUY signal right now. Stochastics are rising and volume has been coming in. Relative performance is strong across the board. The stop can be set thinly at 5%, lining it up below the 200-day EMA.
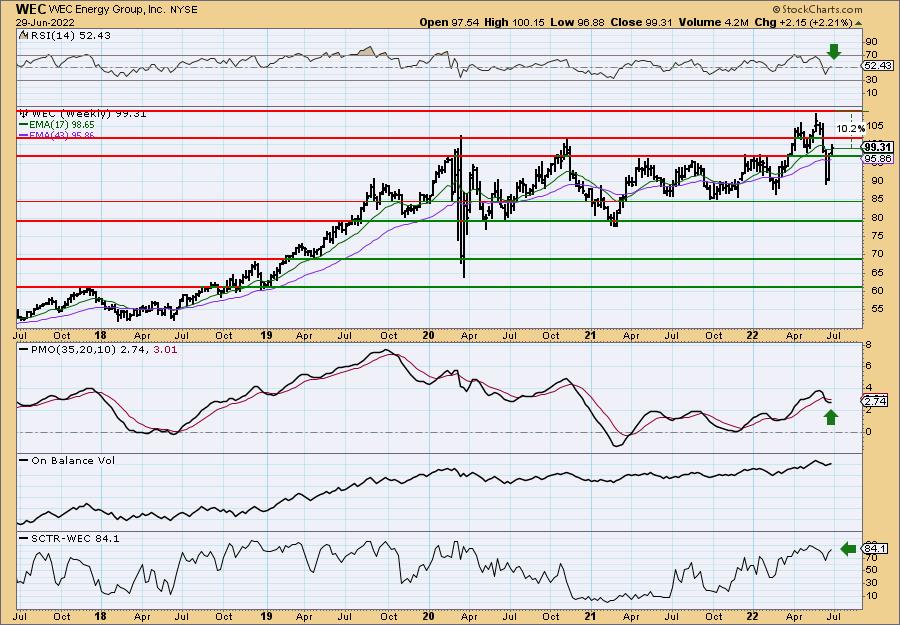
The weekly PMO is turning back up and the weekly RSI has recaptured positive territory. Price is trading above long-term support at 2021 highs. The ugly double-top resolved after the correction which took it to the minimum downside target of the pattern. Now it is rebounding. Next level of resistance is coming up, but I would look for a breakout above this year's high. The 10.2% stop matches with my 2-1 stop rule. I want to have my upside target percentage be at least double my stop percentage.
Don't forget, on Thursdays I look at reader-requested symbols, click HERE to send me an email. I read every email I receive and try to answer them all!
Current Market Outlook:
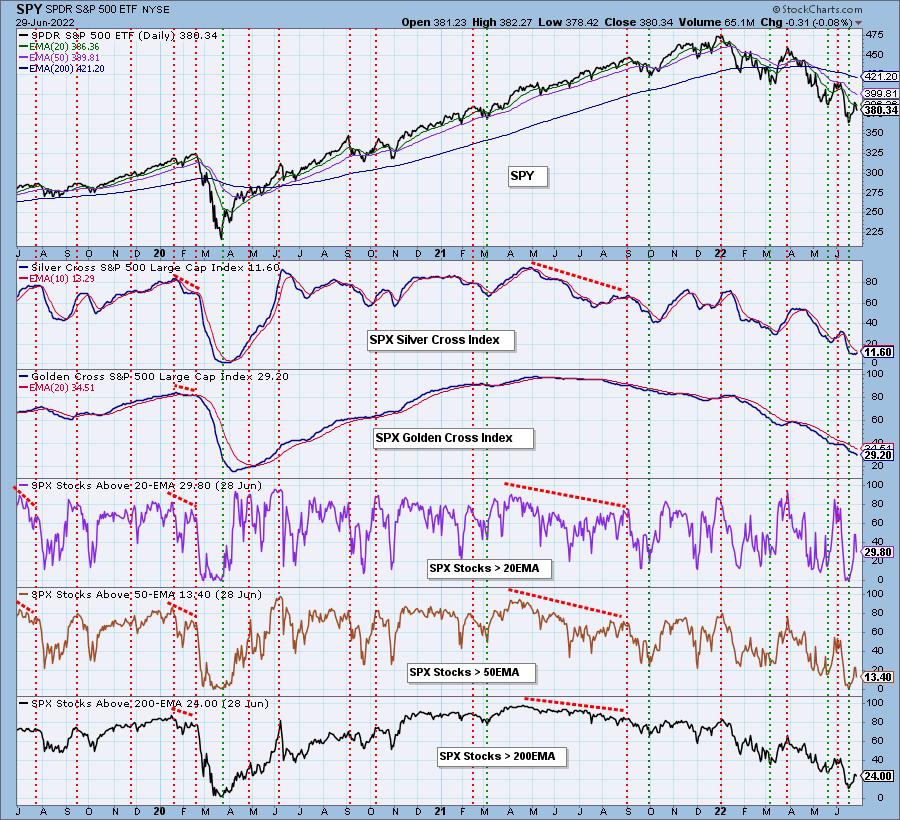
Market Environment: It is important to consider the odds for success by assessing the market tides. The following chart uses different methodologies for objectively showing the depth and trend of participation for intermediate- and long-term time frames.
- The Silver Cross Index (SCI) shows the percentage of SPX stocks on IT Trend Model BUY signals (20-EMA > 50-EMA)
- The Golden Cross Index (GCI) shows the percentage of SPX stocks on LT Trend Model BUY signals (50-EMA > 200-EMA)
Don't forget that as a "Diamonds" member, you have access to our GCI/SCI curated ChartList on DecisionPoint.com. You'll find it under "Members Only" links on the left side on the Blogs and Links Page.
Here is the current chart:
Full Disclosure: I'm 55% exposed. I got too aggressive on expanding my exposure so I will reevaluate tomorrow. I have stops set on all positions. I'd prefer to be 40% exposed at this time.
I'm required to disclose if I currently own a stock I mention and/or may buy/short it within the next 72 hours.
"Technical Analysis is a windsock, not a crystal ball." - Carl Swenlin
(c) Copyright 2022 DecisionPoint.com
Watch the latest episode of DecisionPoint with Carl & Erin Swenlin on Mondays 7:00p EST or on the DecisionPoint playlist on the StockCharts TV YouTube channel here!
NOTE: The stocks reported herein are from mechanical trading model scans that are based upon moving average relationships, momentum and volume. DecisionPoint analysis is then applied to get five selections from the scans. The selections given should prompt readers to do a chart review using their own analysis process. This letter is not a call for a specific action to buy, sell or short any of the stocks provided. There are NO sure things or guaranteed returns on the daily selection of "Diamonds in the Rough."
Helpful DecisionPoint Links:
DecisionPoint Shared ChartList and DecisionPoint Chart Gallery
Price Momentum Oscillator (PMO)
Swenlin Trading Oscillators (STO-B and STO-V)
For more links, go to DecisionPoint.com