
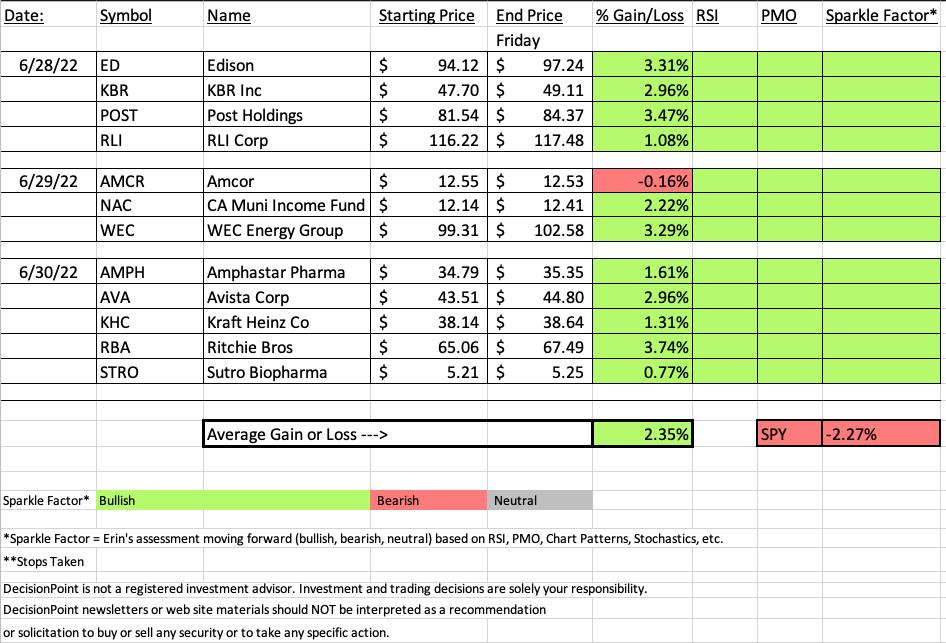
In this morning's Diamond Mine trading room, "Diamonds in the Rough" were up 1% on average for the week, but with the resurgence of the SPX this afternoon, "Diamonds in the Rough" enjoyed the momentum. We finished up +2.35% overall based on when each stock was picked. There was only one decliner and it was only down -0.16%. On a week where the SPY finished down -2.27%, this is a big win for us.
I do caveat that the SPY had all week to fail, while "Diamonds in the Rough" get a shorter week. However, it works to our detriment when the SPY has a great week. Basically take the "performance" aspect with a grain of salt.
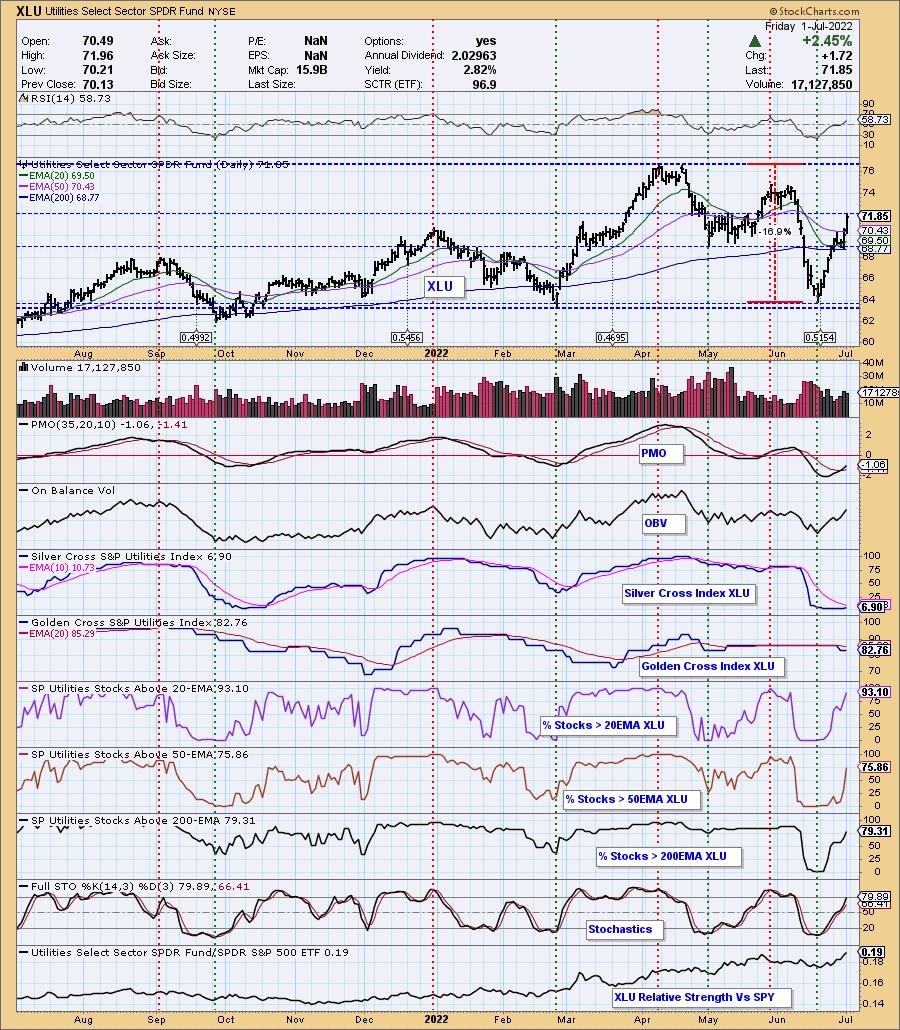
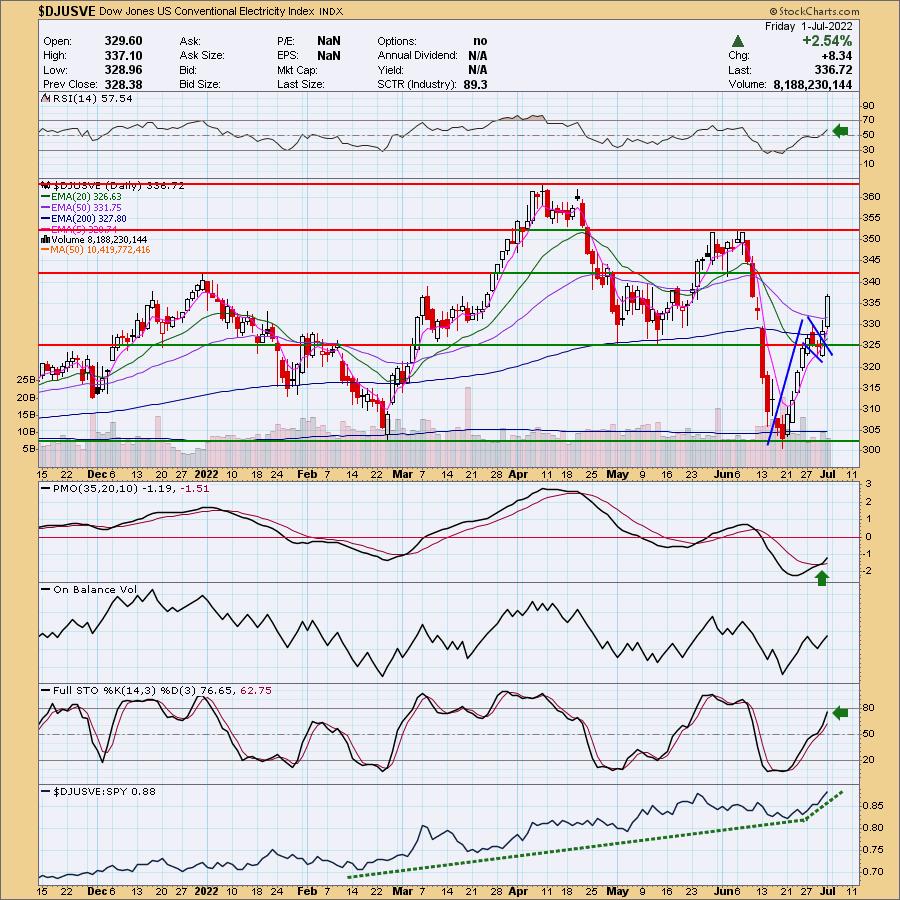
How did we do it? We concentrated on Consumer Staples and Utilities. This week's sector to watch is Utilities (XLU), participation looks great and I expect to see these stocks continue to move higher. My favorite group was Conventional Electricity. It was a hard decision as all four of the industry groups within Utilities look great. Here are the stock symbols that came up in a scan I ran this morning: CNP, ES, EXC, NWN and SO.
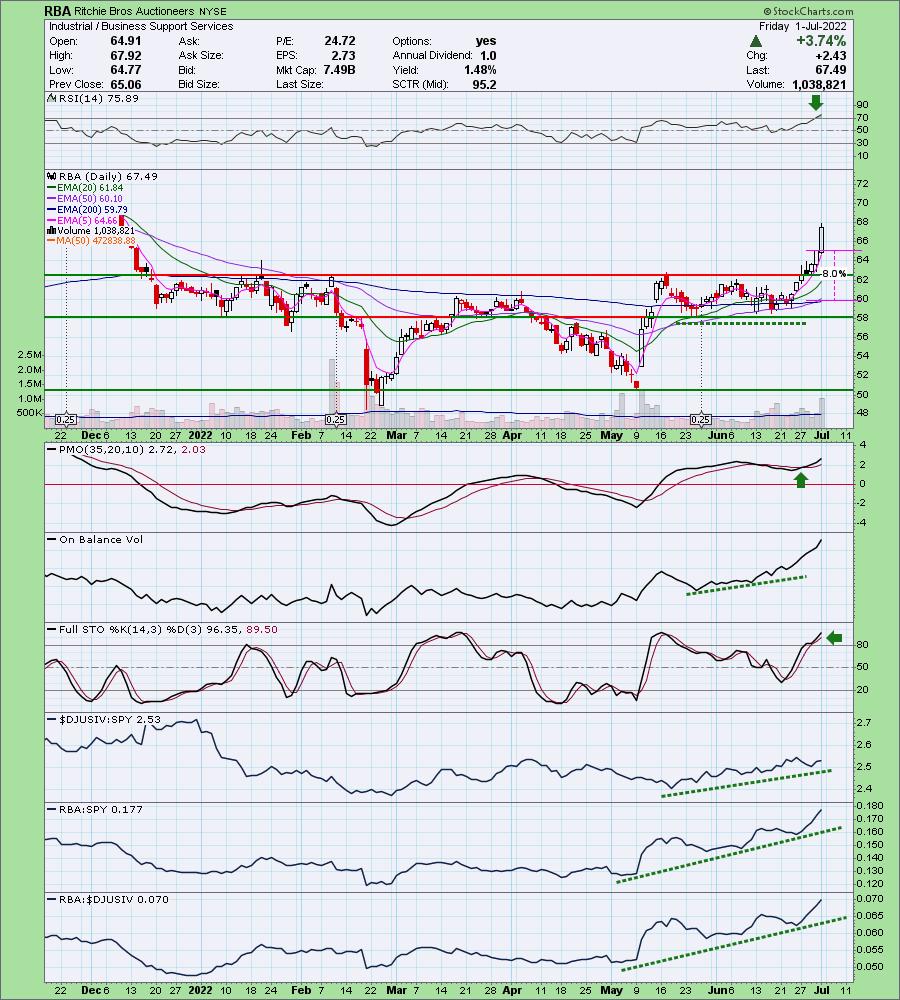
This week's "Darling" turned out to be Ritchie Bros (RBA), the chart that I adored yesterday. However, I didn't expect it to have the day it had. It is still good for a buy, but the stop should be moved up.
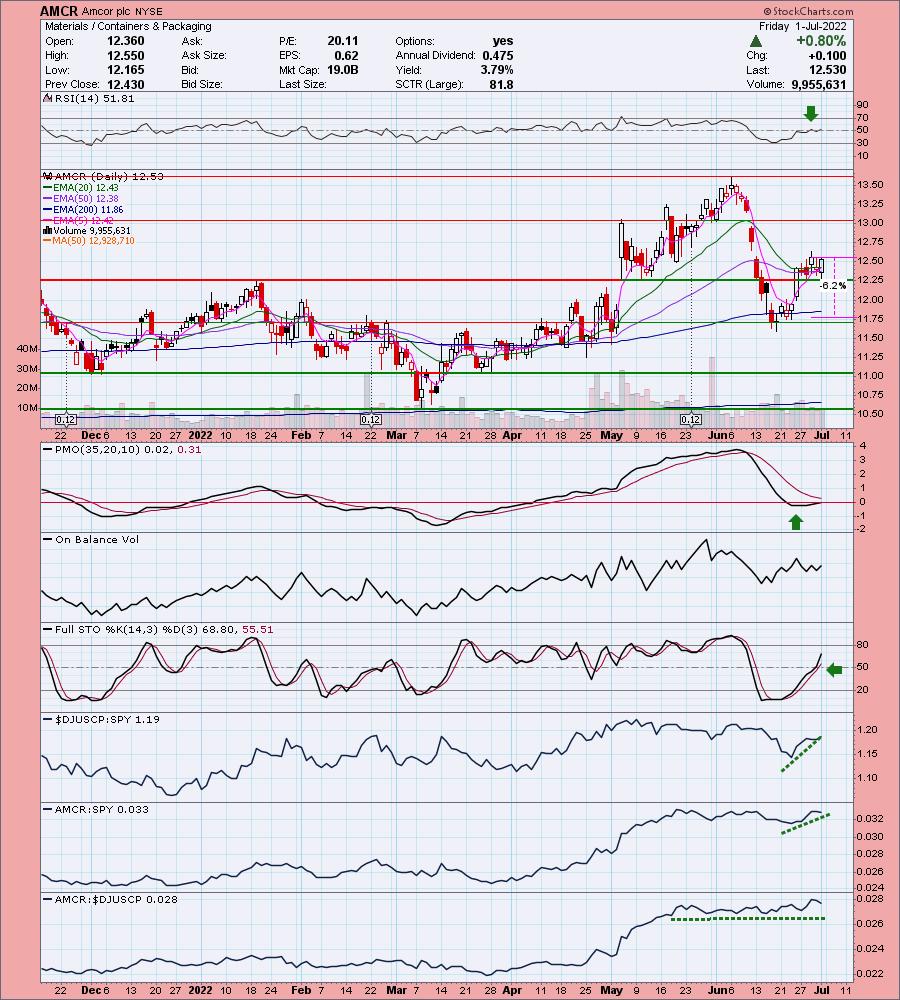
This week's "Dud" and only declining stock was Amcor (AMCR). The chart still looks good.
All of the "Diamonds in the Rough", like last week, still look great and therefore you'll see green across the board as far as rising momentum and RSI as well as Sparkle Factor (how does it look moving forward).
Remember that the recording and registration links are in EVERY Diamonds Report.
Next Diamonds report will be on Tuesday, July 5th and the DP Free Trading Room will be this TUESDAY (7/5) at Noon ET.
Good Luck & Good Trading,
Erin
(P.S. We just got word from StockChartsTV that they will be using our Monday trading room in place of the DecisionPoint Show! Carl will now be in the trading room. He will do the market overview and answer any questions you have! I'll still be doing the dive into the sectors and then taking symbol requests. SCTV will get the recording and will then air it a bit later on their channel as well as post it to YouTube that day. We will still hold it live on Zoom as always. We can't wait!)

RECORDING LINK (7/1/2022):
Topic: DecisionPoint Diamond Mine (7/1/2022) LIVE Trading Room
Start Time: Jul 1, 2022 09:00 AM PT
Meeting Recording Link
Access Passcode: July@1st
REGISTRATION FOR Friday 7/8 Diamond Mine:
When: Jul 8, 2022 09:00 AM Pacific Time (US and Canada)
Topic: DecisionPoint Diamond Mine (7/8/2022) LIVE Trading Room
Register in advance for this webinar HERE
Save the registration confirmation email with login instructions in case Zoom doesn't notify you in time.

Free DP Trading Room (6/27/2022) RECORDING LINK:
Topic: DecisionPoint Trading Room
Start Time: Jun 27, 2022 08:59 AM
Meeting Recording Link
Access Passcode: June#27th
For best results, copy and paste the access code to avoid typos.
A few items about the spreadsheet: I've put on the spreadsheet whether the RSI is positive (green) or negative (red). The PMO column tells you if it is rising (green) or falling (red). Finally I've added my own "Sparkle Factor" that gives you my assessment going forward, bullish (green), bearish (red) or neutral (gray). The Sparkle Factor is basically my thoughts on whether I expect it to rise or fall. A neutral means it could really go either way so it could be added to a watch list. If you're in a stock I consider "neutral" going forward, the ball is in your court.
Darling:
Ritchie Bros Auctioneers (RBA)
EARNINGS: 8/4/2022 (AMC)
Ritchie Bros. Auctioneers, Inc. is an industrial auctioneer, which engages in the sale of equipment to on-site and online bidders. It operates through the following segments: Auctions and Marketplaces, Ritchie Bros. Financial Services and Mascus. The Auctions and Marketplaces segment consists of live on site auctions, online auctions and marketplaces, and brokerage service. The Ritchie Bros. Financial Services segment refers to the financial brokerage service. The Mascus segment includes online listing service. The company was founded by David Edward Ritchie in 1958 and is headquartered in Burnaby, Canada.
Predefined Scans Triggered: P&F Low Pole.
Below are the commentary and chart from yesterday (6/30):
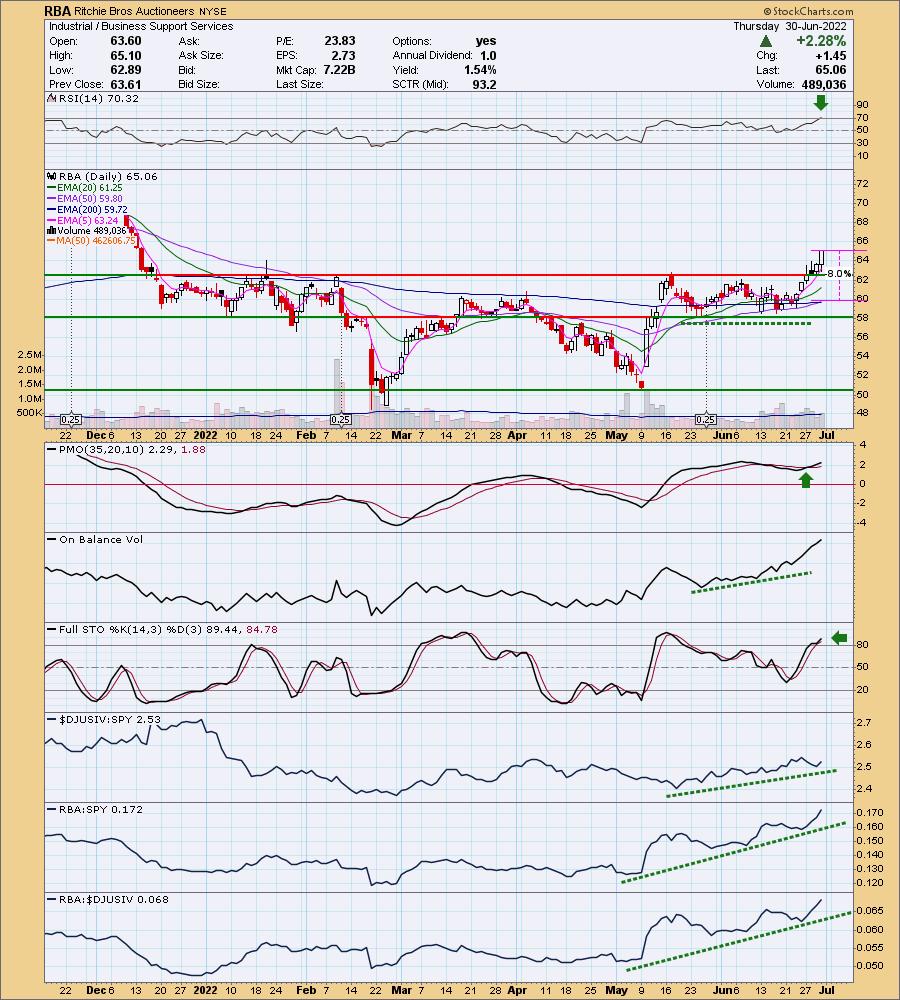
"RBA is up +0.06% in after hours trading. I covered this one back on June 22nd 2021. The position was up over 20%, but ultimately the stop was triggered on the gap down in February. The PMO gave us plenty of warning with a crossover SELL signal in overbought territory back at the end of November, before that 20% gain evaporated.
This was probably my favorite chart of the day and is very tempting for me. The RSI just hit overbought territory. That is the only negative I see on this chart right now. Price strongly broke out this week. Today we have a brand new "Golden Cross" LT Trend Model BUY signal. The PMO triggered a BUY signal this week. The OBV held a strong positive divergence with price lows going into this rally. Stochastics are above 80 and rising again. Relative strength is excellent for the group and RBA is clearly outperforming both the group and the SPY. The stop is set at the 200-day EMA."
Here is today's chart:
I loved this chart yesterday and I love it even more today. The only issue would be the overbought RSI, but given the strength of this move, I'd be prepared for it to stay that way or we'll see a consolidation/pause to bring it back below 70. There's really not much more to say. I would move my stop level to just below $62.
Don't forget, on Thursdays I look at reader-requested symbols, so shoot me an email at erin@decisionpoint.com. I read every email I receive and try to answer them all!
Dud:
Amcor plc (AMCR)
EARNINGS: 8/16/2022 (AMC)
Amcor Plc operates as a holding company, which engages in the consumer packaging business. It operates through the Flexibles and Rigid Packaging segments. The Flexibles segment develops and supplies flexible packaging globally. The Rigid Plastics segment manufactures rigid plastic containers and related products. The company was founded 1926 and is headquartered in Warmley, the United Kingdom.
Predefined Scans Triggered: Moved Above Ichimoku Cloud.
Below are the commentary and chart from Wednesday (6/29):
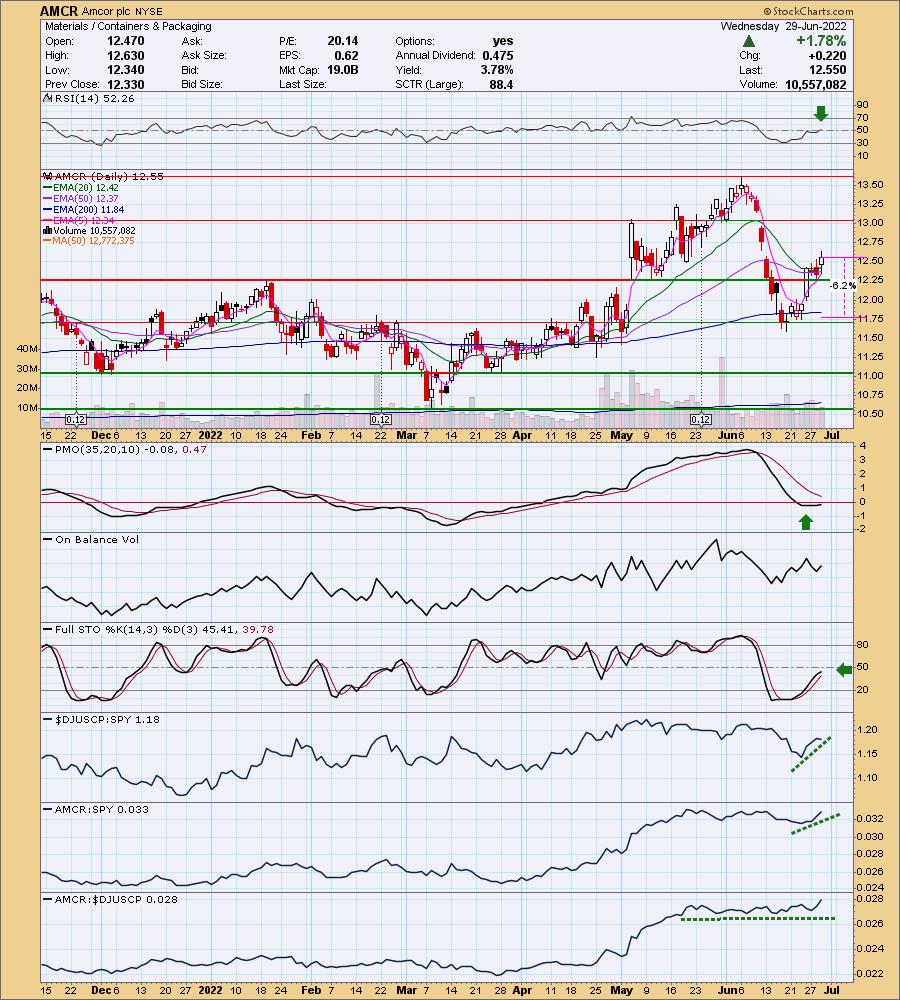
"AMCR is up +0.72% in after hours trading. I had to decide between GPK and this one. I chose this one as today it broke out strongly above the 20/50-day EMAs where GPK was stuck beneath both EMAs. After such a swift decline, it isn't surprising that it is taking the PMO time to turn around. In the meantime, the RSI has moved into positive territory and Stochastics are nearing positive territory above net neutral (50). This bounce came off the 200-day EMA. The OBV is rising to confirm this rally and relative strength for the group is good against the SPY. While AMCR is only traveling inline with the group, that's fine given the group's outperformance. The stop is set beneath the 200-day EMA."
Here is today's chart:
This one still looks pretty good as support is holding through this consolidation phase. The RSI is positive and rising and the PMO just moved above the zero line, on its way to a crossover BUY signal. If this one were to lose support, I would remove it from your watch lists. For now it is definitely a "hold".
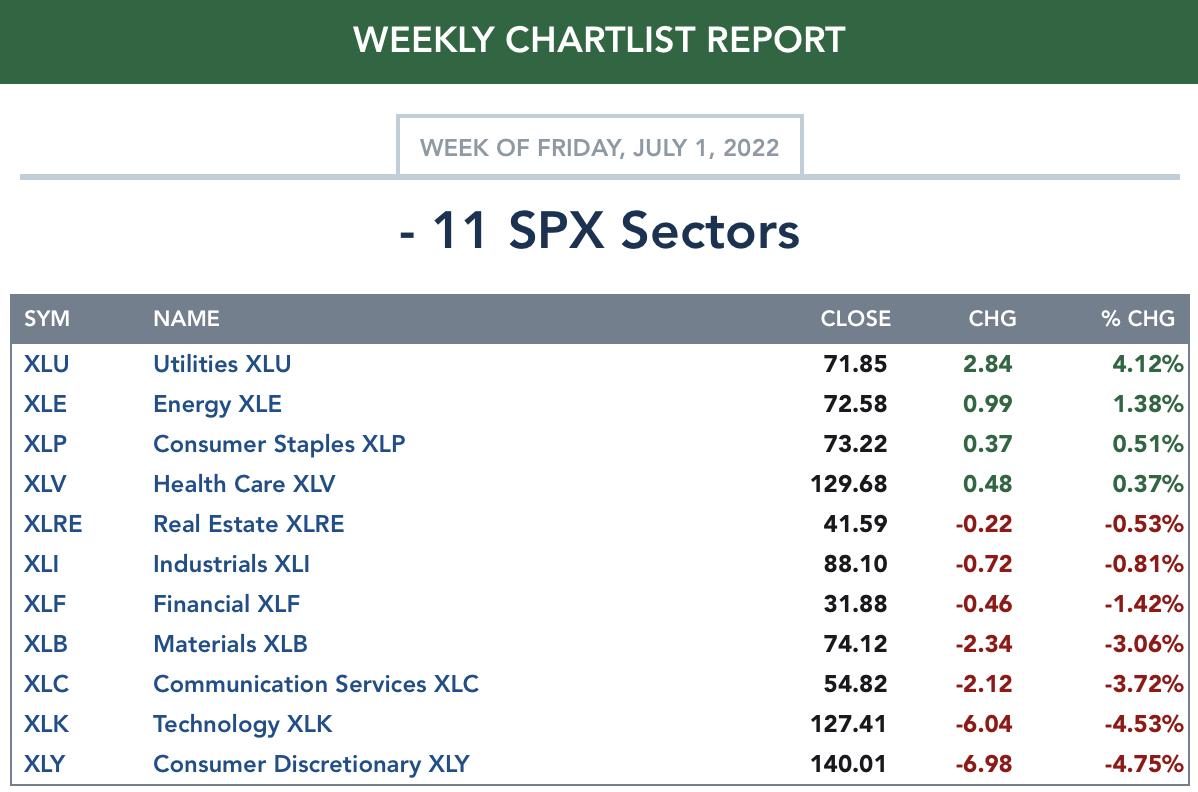
THIS WEEK's Sector Performance:
DecisionPoint Sector Scoreboard (Mechanical Trend Model Signals):

Click Here to view Carl's annotated Sector ChartList!
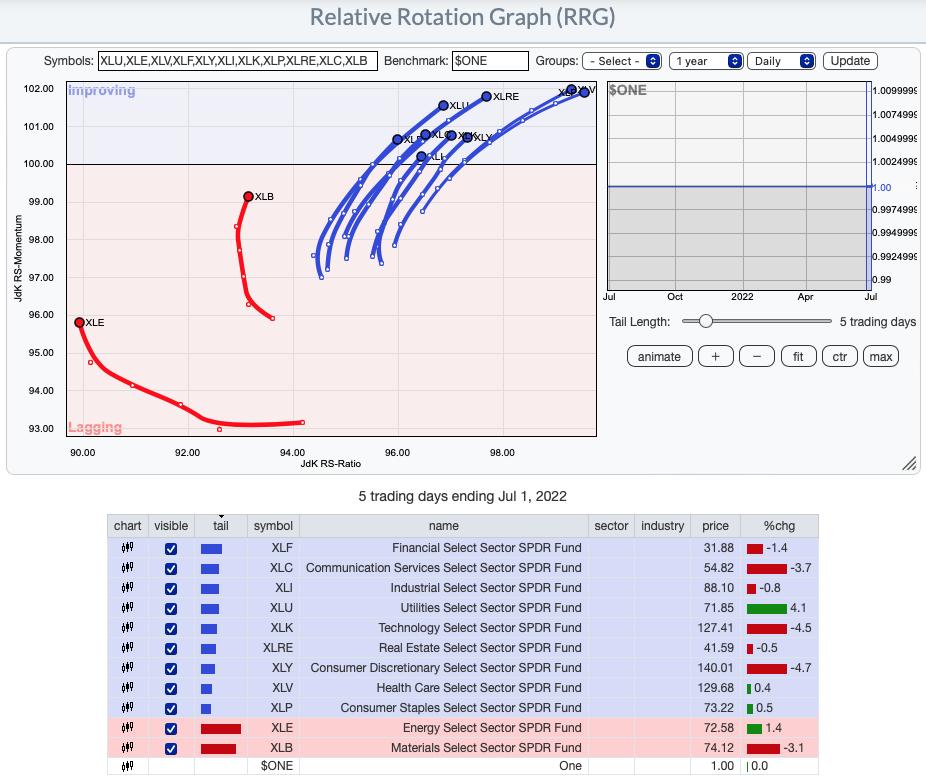
RRG® Daily Chart ($ONE Benchmark):
All of the sectors with the exception of Materials (XLB) and Energy (XLE) have bullish northeast headings and are listed in the Improving quadrant. This bolsters our opinion that we are looking at a bear market rally in the works. We are seeing fairly broad participation among the sectors. Unlike previous weeks, we now have identified pockets of strength within various industry groups. Currently the cream that is rising to the top are the defensive areas of the market: Utilities (XLU), Real Estate (XLRE), Healthcare (XLV) and Consumer Staples (XLP). This is why we have spent most of our time in Diamonds Reports within these sectors.
RRG® Weekly Chart ($ONE Benchmark):
The bear market is still here based on the longer-term weekly RRG. All are in the Lagging quadrant with the exception of XLU and XLE. The bearish southwest headings are the big problem, although we note that Communication Services (XLC), Technology (XLK) and Healthcare (XLV) are reversing the those headings and now have northward components to their heading. All are deeply within the Lagging quadrant so don't get too excited.
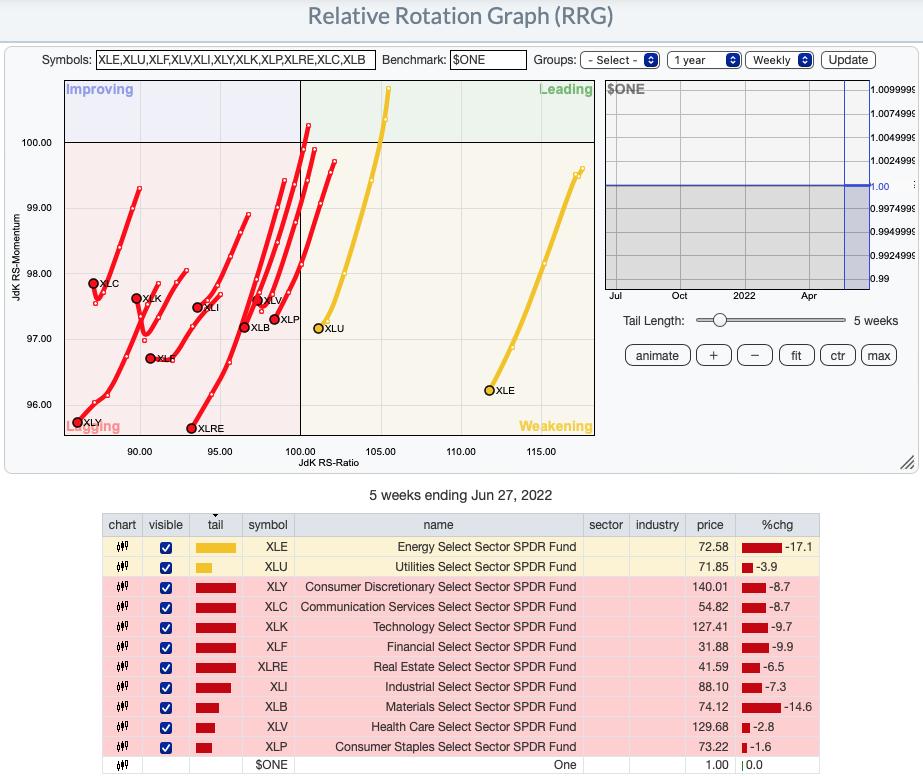
RRG® charts show you the relative strength and momentum for a group of stocks. Stocks with strong relative strength and momentum appear in the green Leading quadrant. As relative momentum fades, they typically move into the yellow Weakening quadrant. If relative strength then fades, they move into the red Lagging quadrant. Finally, when momentum starts to pick up again, they shift into the blue Improving quadrant.
CLICK HERE for an animated version of the RRG charts.
Sector to Watch: Utilities (XLU)
Last week we went with Real Estate (XLRE) which spent most of the week pulling back, so we should be prepared for similar action out of Utilities (XLU). XLU has the benefit of better participation and indicators than XLRE had last week, so I am still bullish here.
The strong breakout above the 50-day EMA was impressive. It is up against resistance at the mid-May tops, but this looks like the next leg up out of the bull flag. The RSI is positive and not overbought. The PMO is on a brand new crossover BUY signal and Stochastics about to move above 80. The best part is the increase in participation within the sector. While the Silver Cross Index (SCI) is at a very low 6.90%, that should begin to see improvement. Most of the stocks have EMAs that are configured like XLU's. This means that the last participation number to improve will be %Stocks > 50-day EMA. The participation of stocks above their 20/50/200-day EMAs is bullish with all percentages listed above 70%. This sector looks very strong going into next week.
Industry Group to Watch: Conventional Electricity ($DJUSVE)
This group rallied strongly today, but it had an excellent day yesterday too on a breakout from a bull flag. Based on the bull flag, the minimum upside target for this group is just above $360 or basically a move to overhead resistance at the April high. The RSI is positive and rising. The PMO is rising on a new crossover BUY signal. Stochastics are nearing 80. Be sure and look at all of the industry groups in this sector. The charts are all very favorable.
Go to our Sector ChartList on DecisionPoint.com to get an in-depth view of all the sectors.
Have a great July 4th weekend! Good Luck & Good Trading!
- Erin
erin@decisionpoint.com
Full Disclosure: I'm 50% exposed. I shaved some of my exposure by adjusting my position sizes. I'm happy at around 50% but given pockets of strength, I'm considering another position or two.
Watch the latest episode of DecisionPoint with Carl & Erin Swenlin on Mondays 7:00p EST or on the DecisionPoint playlist on the StockCharts TV YouTube channel here!
Technical Analysis is a windsock, not a crystal ball. --Carl Swenlin
NOTE: The stocks reported herein are from mechanical trading model scans that are based upon moving average relationships, momentum and volume. DecisionPoint analysis is then applied to get five selections from the scans. The selections given should prompt readers to do a chart review using their own analysis process. This letter is not a call for a specific action to buy, sell or short any of the stocks provided. There are NO sure things or guaranteed returns on the daily selection of "diamonds in the rough."
Helpful DecisionPoint Links:
DecisionPoint Shared ChartList and DecisionPoint Chart Gallery
Price Momentum Oscillator (PMO)
Swenlin Trading Oscillators (STO-B and STO-V)
(c) Copyright 2022 DecisionPoint.com