
The market has been sliding quickly and it has taken all but the Energy sector down with it. When you have ten sectors with overbought PMO SELL signals, the selections narrow to nearly nothing. I had four symbols but I am presenting three "Diamonds in the Rough". The one that was left out was Sun Country Airlines (SNCY). As I went through the charts in that industry group, I was totally unimpressed so while SNCY looks good, it is a member of a group that I'm not sold on. Ultimately I would hesitate to expand your exposure right now.
Good Luck & Good Trading!
Erin
Today's "Diamonds in the Rough": BSAC, GRIN and VNDA.
"Runner-up": SNCY.

TODAY'S RECORDING LINK (8/26/2022):
Topic: DecisionPoint Diamond Mine (8/26/2022) LIVE Trading Room
Start Time: Aug 26, 2022 09:00 AM
Meeting Recording Link
Access Passcode: August*26
REGISTRATION For Friday 9/2 Diamond Mine:
When: Sep 2, 2022 09:00 AM Pacific Time (US and Canada)
Topic: DecisionPoint Diamond Mine (9/2/2022) LIVE Trading Room
Register in advance for this webinar HERE
Save the registration confirmation email with login instructions in case Zoom doesn't notify you in time.

Last Monday's Recording:
Welcome to DecisionPoint Daily Diamonds, wherein I highlight ten "Diamonds in the Rough" per week. These are selected from the results of my DecisionPoint Scans, which search for stocks that could benefit from the trend and condition of the market. Remember, these are not recommendations to buy or sell, but are the most interesting of the stocks that surfaced in my scans. My objective is to save you the work of the initial, tedious culling process, but you need to apply your own analysis to see if these stocks pique your interest as well. There are no guaranteed winners here!
"Predefined Scans Triggered" are taken from StockCharts.com using the "Symbol Summary" option instead of a "SharpChart" on the workbench.
Banco Santiago (BSAC)
EARNINGS: 10/28/2022 (BMO)
Banco Santander Chile SA engages in the provision of commercial and retail banking services. It operates through the following segments: Retail Banking, Middle-Market, Corporate and Investment Banking, and Other. The Retail banking segment offers consumer loans, credit cards, automobile loans, commercial loans, foreign exchange, mortgage loans, debit cards, checking accounts, savings products, mutual funds, stock brokerage, and insurance brokerage. The Middle-Market segment serves institutions such as universities, government entities, local and regional governments, and companies engaged in the real estate industry who carry out projects to sell properties to third parties. The Corporate and Investment Banking segment consists of foreign and domestic multinational companies. The Other segment represents the results of is financial management division, which develops global management functions, including managing inflation rate risk, foreign currency gaps, interest rate risk and liquidity risk. The company was founded on September 7, 1977 and is headquartered in Santiago, Chile.
Predefined Scans Triggered: Improving Chaikin Money Flow, Bullish MACD Crossovers and Parabolic SAR Buy Signals.
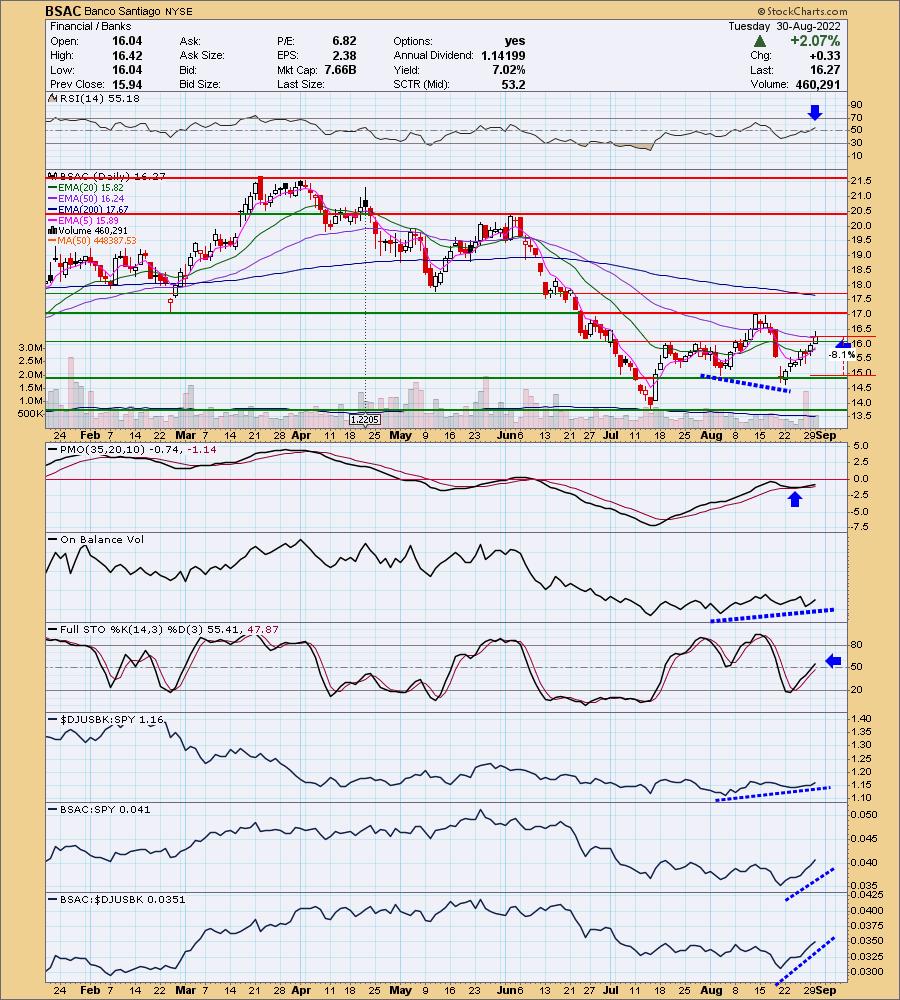
BSAC is up +0.21% in after hours trading. Given this came up on my scan, I will be keeping a close eye on Banks. The relative strength line for the group is beginning to trend up. The set up is excellent. Price broke above the 50-day EMA and closed above it today. The RSI moved into positive territory and the PMO has bottomed above its signal line. There is a strong OBV positive divergence leading into this rally. Stochastics are back in positive territory. If you're going to go with Banks, this one is a clear outperformer against the group and consequently the SPY. The stop is set at 8.1% or $14.95. I would likely set it a bit deeper to accommodate support, but that is a 9%+ stop.
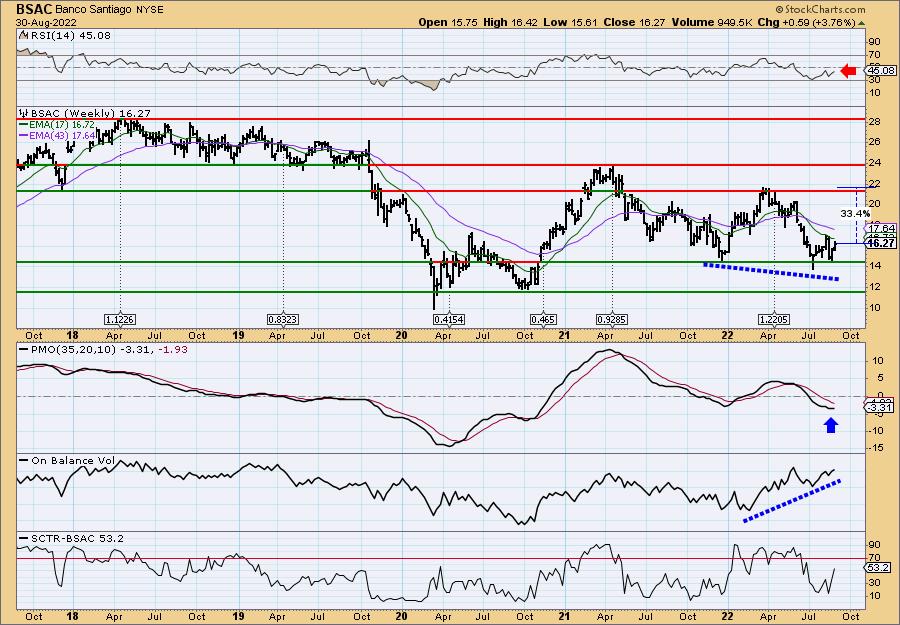
Not only does BSAC have a near-term positive OBV divergence, it also has a longer-term OBV positive divergence. This one is very strong and we haven't seen an extended rally off of it yet. The weekly RSI is still negative, but rising. The weekly PMO is turning up. The SCTR is a bit low, but it has risen substantially out of the lows. If it reaches overhead resistance at the 2022 top, that would be an over 33% gain.
Grindrod Shipping Holdings Ltd (GRIN)
EARNINGS: 11/16/2022 (AMC)
Grindrod Shipping Holdings Ltd. engages in the provision of maritime transportation services. It operates through the Drybulk Carriers and Tankers Business segments. The Drybulk Carriers Business segment operates under handysize, supramax/ultramax, and other operating segments. The Tankers Business segment is divided into medium range tankers, small tankers, and other operating segments. The company was founded in 1910 and is headquartered in Singapore.
Predefined Scans Triggered: Bearish Harami, P&F Ascending Triple Top Breakout and P&F Double Top Breakout.
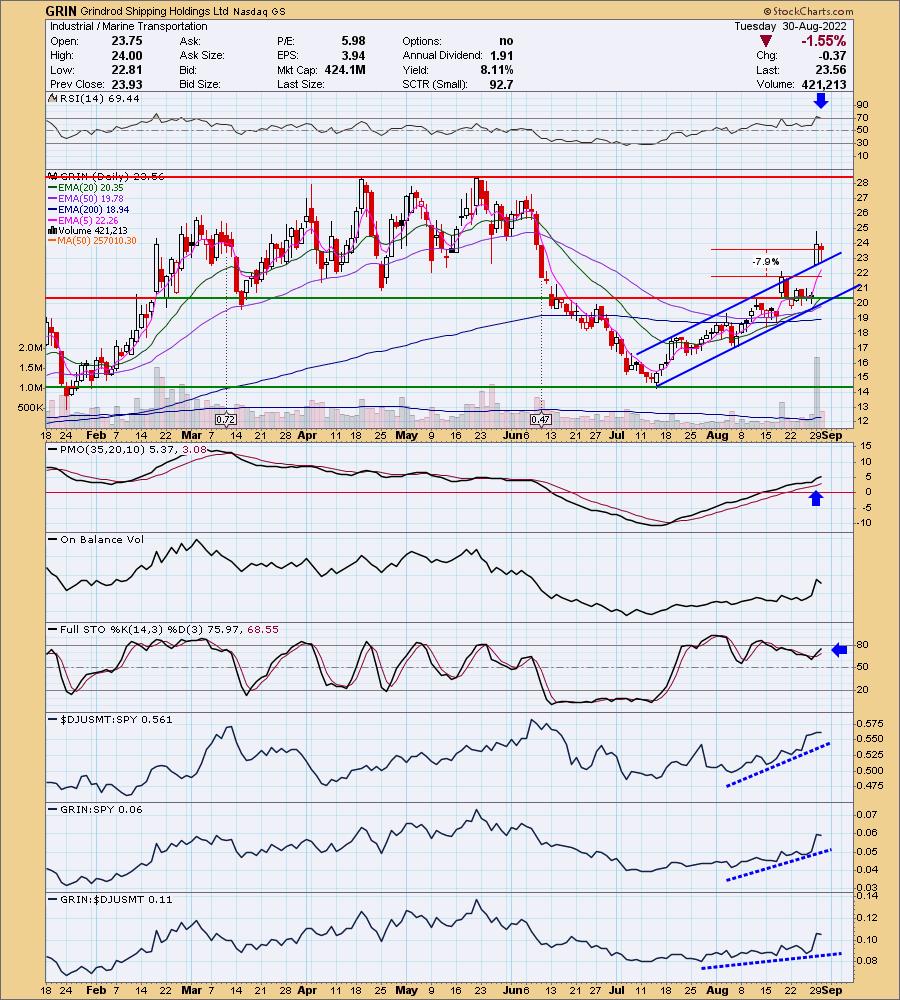
GRIN is up +0.17% in after hours trading. I was happy to see a Marine Transportation stock in the results as I know this group has been outperforming. GRIN has been in a rising trend channel and yesterday, gapped up and out of the channel. Today, we saw some profit taking, but price is still above the channel. I don't see any overhead resistance until price reaches $28. The RSI has moved out of overbought territory with today's decline and that's a positive. The PMO bottomed above its signal line which especially bullish. Volume expanded on yesterday's gap up and today it was much lower on the selling. Stochastics are oscillating in positive territory, but I'd like to see it get back above 80.
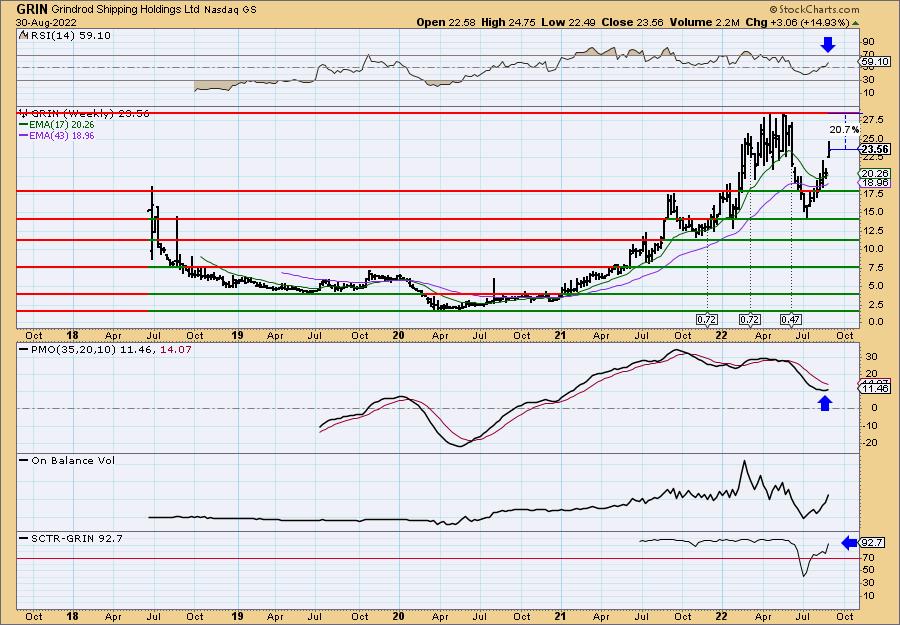
The weekly PMO has bottomed and the weekly RSI is positive. The SCTR is excellent at 92.7%. If price should get to the all-time highs, it would be an over 20% gain.
Vanda Pharmaceuticals Inc. (VNDA)
EARNINGS: 11/2/2022 (AMC)
Vanda Pharmaceuticals, Inc. engages in the development and commercialization of therapies for high unmet medical needs. The firm intends to treat schizophrenia, jet lag disorder, atopic dermatitis, central nervous system disorders, and circadian rhythm sleep disorder. Its product portfolio includes HETLIOZ, Fanapt, Tradipitant, Trichostatin, and AQW051. The company was founded by Mihael Hristos Polymeropoulos and Argeris N. Karabelas in 2002 and is headquartered in Washington, DC.
Predefined Scans Triggered: Improving Chaikin Money Flow, New CCI Buy Signals, Moved Above Upper Bollinger Band, Moved Above Ichimoku Cloud and Parabolic SAR Buy Signals.
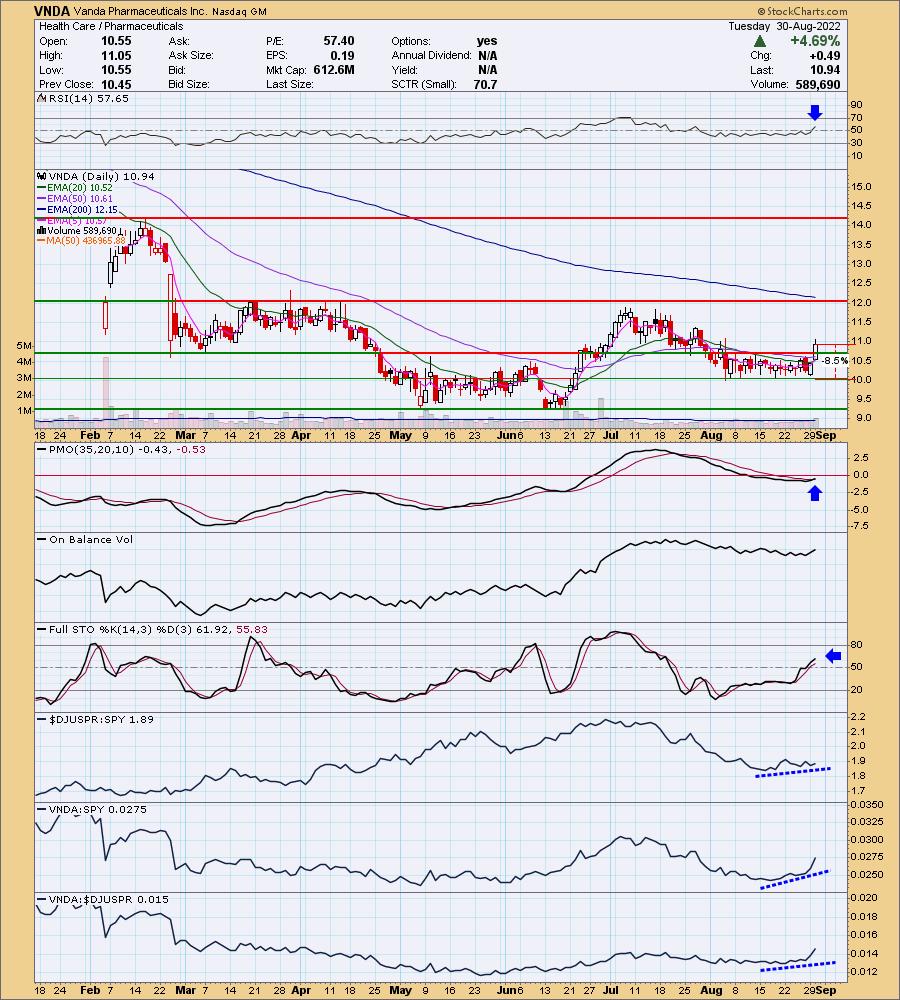
VNDA is unchanged in after hours trading. I covered VNDA on April 21st 2021. The position is closed but was up 27%+ before topping and triggering the stop. I hesitated to include this one as the Healthcare sector is very weak right now. However, the Pharma group is showing a tiny bit of rise in its relative strength line. The PMO just triggered a crossover BUY signal. The RSI is now in positive territory, as are Stochastics. Relatively speaking, VNDA is beginning to really outperform. The stop is set at 8.5% around $10.01.
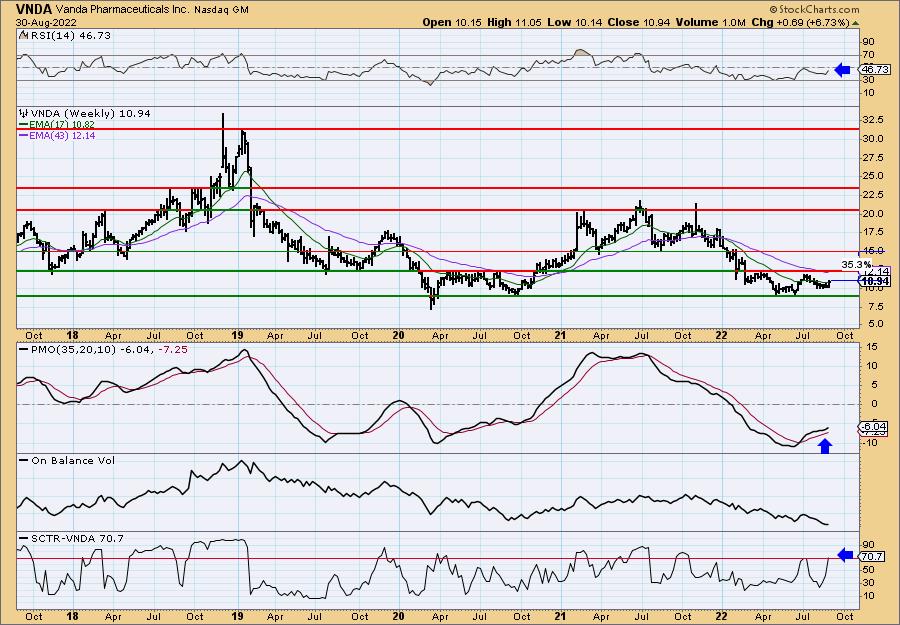
The weekly RSI is negative, but starting to rise again. The weekly PMO is accelerating its rise. The SCTR is above 70%. If I had a complaint, it would be the OBV trending lower. Should we get a breakout above resistance and the 43-week EMA, upside potential is over 35%.
Don't forget, on Thursdays I look at reader-requested symbols, click HERE to send me an email. I read every email I receive and try to answer them all!
Current Market Outlook:
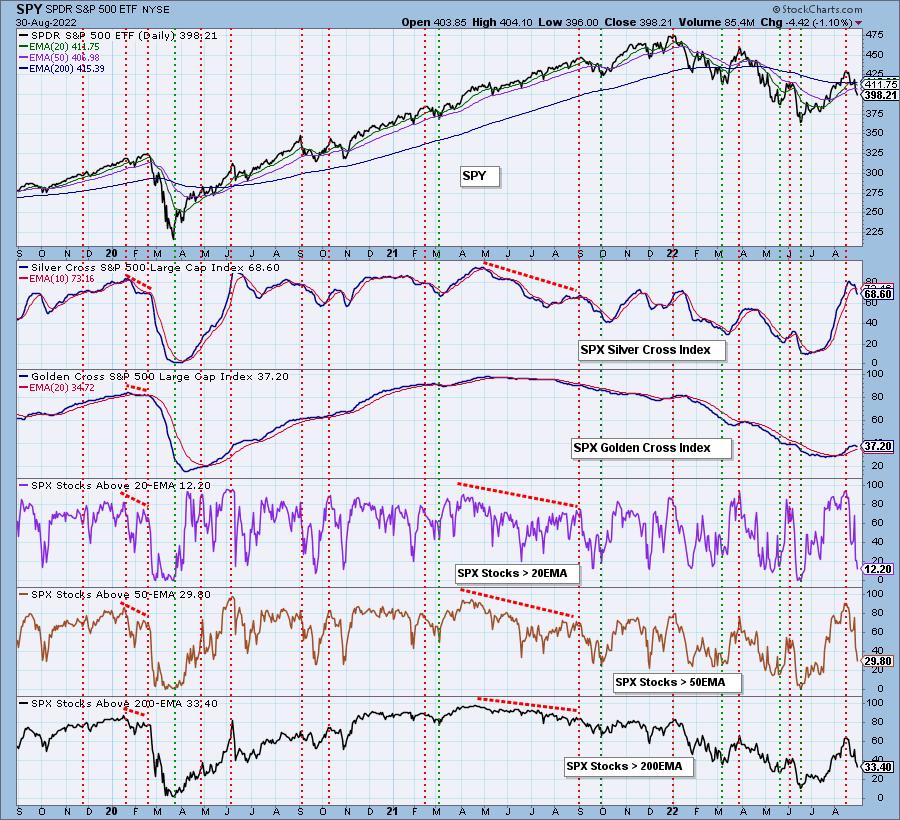
Market Environment: It is important to consider the odds for success by assessing the market tides. The following chart uses different methodologies for objectively showing the depth and trend of participation for intermediate- and long-term time frames.
- The Silver Cross Index (SCI) shows the percentage of SPX stocks on IT Trend Model BUY signals (20-EMA > 50-EMA)
- The Golden Cross Index (GCI) shows the percentage of SPX stocks on LT Trend Model BUY signals (50-EMA > 200-EMA)
Don't forget that as a "Diamonds" member, you have access to our GCI/SCI curated ChartList on DecisionPoint.com. You'll find it under "Members Only" links on the left side on the Blogs and Links Page.
Here is the current chart:
Full Disclosure: I am 40% exposed.
I'm required to disclose if I currently own a stock I mention and/or may buy/short it within the next 72 hours.
"Technical Analysis is a windsock, not a crystal ball." - Carl Swenlin
(c) Copyright 2022 DecisionPoint.com
Watch the latest episode of DecisionPoint with Carl & Erin Swenlin on Mondays 7:00p EST or on the DecisionPoint playlist on the StockCharts TV YouTube channel here!
NOTE: The stocks reported herein are from mechanical trading model scans that are based upon moving average relationships, momentum and volume. DecisionPoint analysis is then applied to get five selections from the scans. The selections given should prompt readers to do a chart review using their own analysis process. This letter is not a call for a specific action to buy, sell or short any of the stocks provided. There are NO sure things or guaranteed returns on the daily selection of "Diamonds in the Rough."
Regarding BUY/SELL Signals: The signal status reported herein is based upon mechanical trading model signals and crossovers. They define the implied bias of the price index/stock based upon moving average relationships and momentum, but they do not necessarily call for a specific action. They are information flags that should prompt chart review. Further, they do not call for continuous buying or selling during the life of the signal. For example, a BUY signal will probably (but not necessarily) return the best results if action is taken soon after the signal is generated. Additional opportunities for buying may be found as price zigzags higher, but the trader must look for optimum entry points. Conversely, exit points to preserve gains (or minimize losses) may be evident before the model mechanically closes the signal.
Helpful DecisionPoint Links:
DecisionPoint Shared ChartList and DecisionPoint Chart Gallery
Price Momentum Oscillator (PMO)
Swenlin Trading Oscillators (STO-B and STO-V)
For more links, go to DecisionPoint.com