
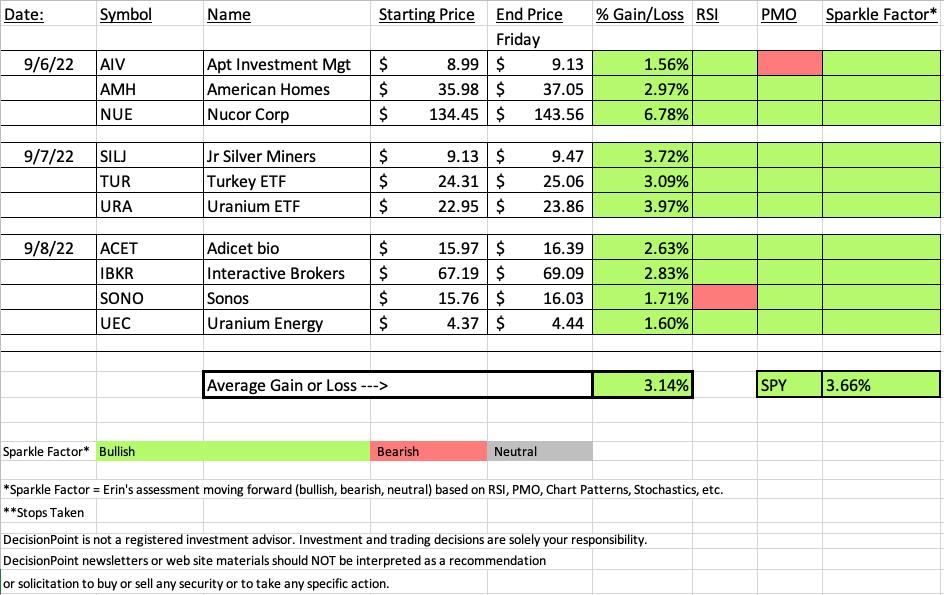
It was an excellent week for "Diamonds in the Rough", but it was also a great week for the SPY which did edge us out on our average gains by about a half of a percent. The SPY was up 3.66% while "Diamonds in the Rough" averaged 3.14%. The best part of this week is that all ten positions finished positively with the "Dud" (worst performer) being up 1.56%.
I discussed in the Diamond Mine that I would be adding URA and I have. I closed my hedges with the exception of PFIX, the Interest Rate Hedge ETF.
I'll keep it short, but note that the recording link from today's Diamond Mine Trading Room is under the Diamonds logo below.
Have a great weekend!
Good Luck & Good Trading,
Erin

TODAY'S RECORDING LINK (9/9/2022):
Topic: DecisionPoint Diamond Mine (9/9/2022) LIVE Trading Room
Start Time: Sept 9, 2022 09:00 AM
Passcode: Sept*9th
REGISTRATION For Friday 9/16 Diamond Mine:
Registration Link HERE
Save the registration confirmation email with login instructions in case Zoom doesn't notify you in time.

With last Monday being a holiday, there was no trading room held so here is the link to the August 29th DecisionPoint Trading Room:
A few items about the spreadsheet: I've put on the spreadsheet whether the RSI is positive (green) or negative (red). The PMO column tells you if it is rising (green) or falling (red). Finally I've added my own "Sparkle Factor" that gives you my assessment going forward, bullish (green), bearish (red) or neutral (gray). The Sparkle Factor is basically my thoughts on whether I expect it to rise or fall. A neutral means it could really go either way so it could be added to a watch list. If you're in a stock I consider "neutral" going forward, the ball is in your court.
Darling:
Nucor Corp. (NUE)
EARNINGS: 10/20/2022 (BMO)
Nucor Corp. engages in the manufacturing of steel and steel products. It operates through the following segments: Steel Mills, Steel Products, and Raw Materials. The Steel Mills segment consists of carbon and alloy steel in sheet, bars, structural and plate, steel trading businesses, rebar distribution businesses, and Nucor's equity method investments. The Steel Products segment includes steel joists and joist girders, steel deck, fabricated concrete reinforcing steel, cold finished steel, steel fasteners, metal building systems, steel grating, tubular products businesses, piling products businesses, and wire and wire mesh. The Raw Materials segment consists of direct reduced iron, and ferrous and nonferrous metals. The company was founded by Ransom E. Olds in 1905 and is headquartered in Charlotte, NC.
Predefined Scans Triggered: Elder Bar Turned Blue.
Below are the commentary and chart from Tuesday 9/6:
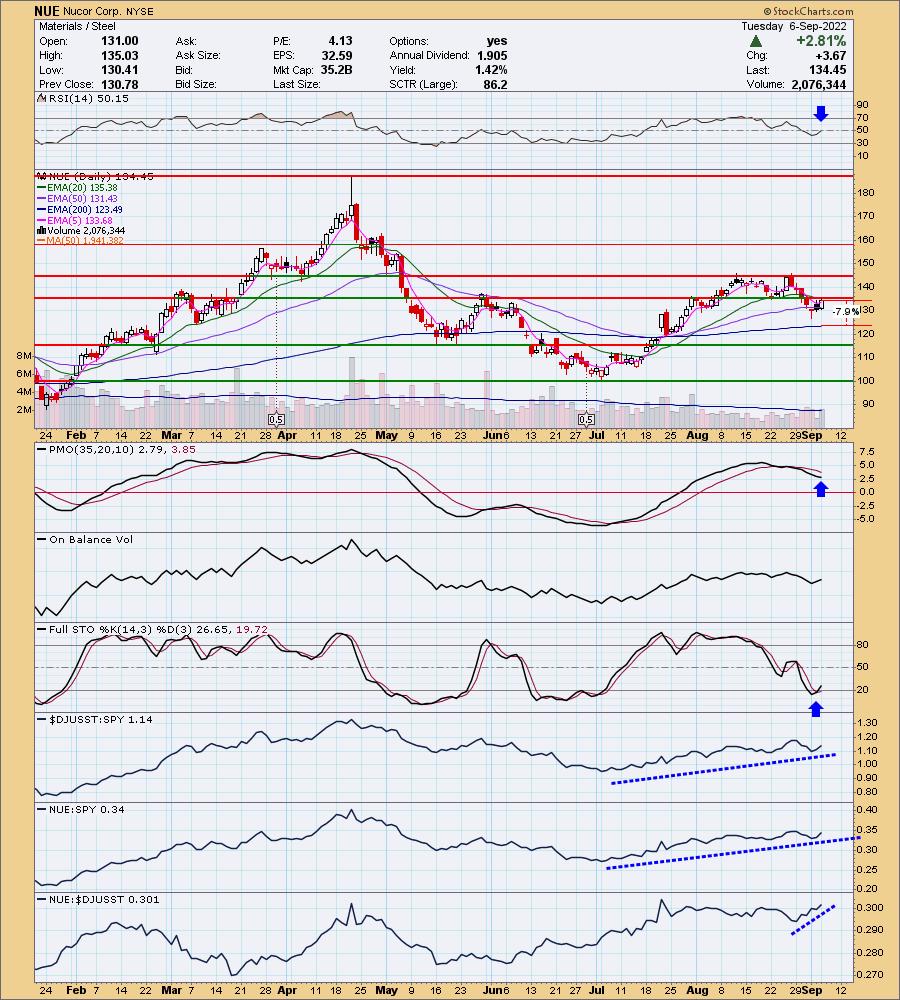
"NUE is up +0.32% in after hours trading. The last time I covered it was on July 27th 2021. I covered twice more earlier in that year. You'll find those link in the last report I've linked to. Two of the three positions are actually still open and up around 113% and 35%. This sure looks like a bullish cup with handle. The RSI just hit positive territory. The PMO is decelerating. Stochastics have turned up in oversold territory. Relative strength is very good with NUE being a clear leader amongst the group. The stop is set around the 200-day EMA at 7.9% or $123.83."
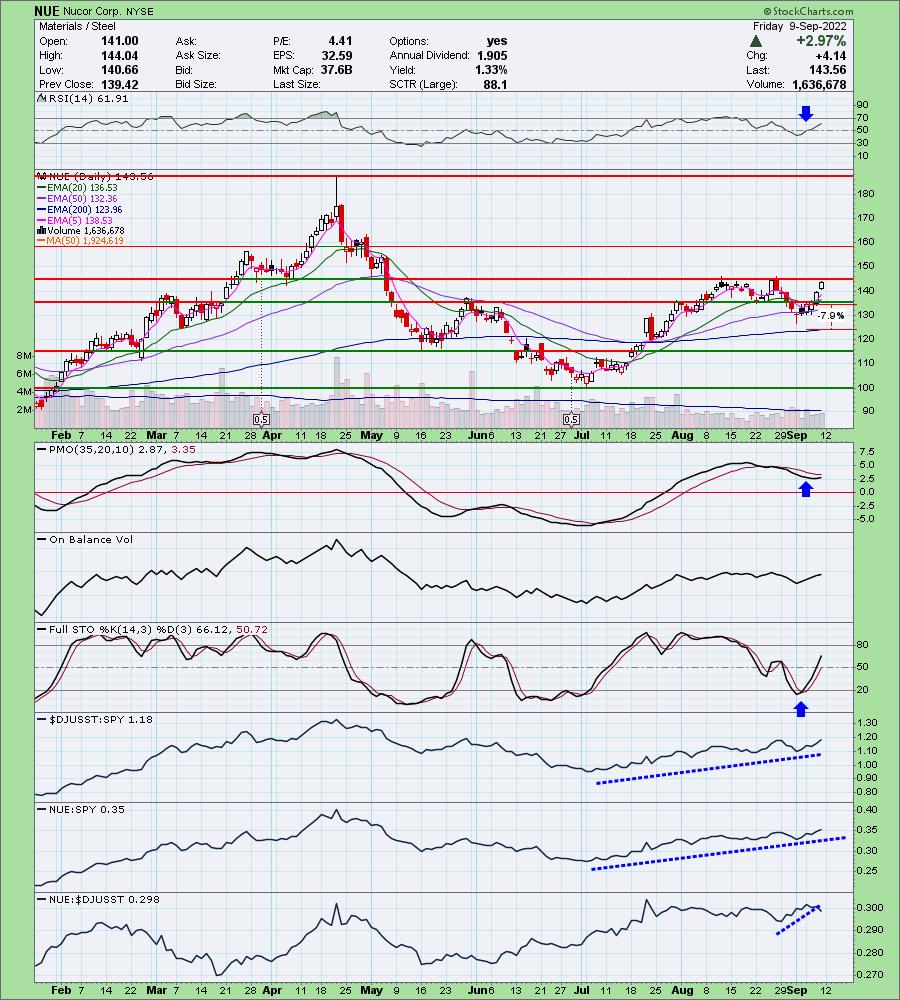
Here is today's chart:
The only problem I foresee on this is a failure to overcome resistance...as a possibility. The indicators suggest a breakout won't be very difficult. The only other slightly bearish item is that relative strength against the group is beginning to taper off. I wouldn't turn down this chart for the reasons listed above; it's just too bullish.
Don't forget, on Thursdays I look at reader-requested symbols, so shoot me an email at erin@decisionpoint.com. I read every email I receive and try to answer them all!
Dud:
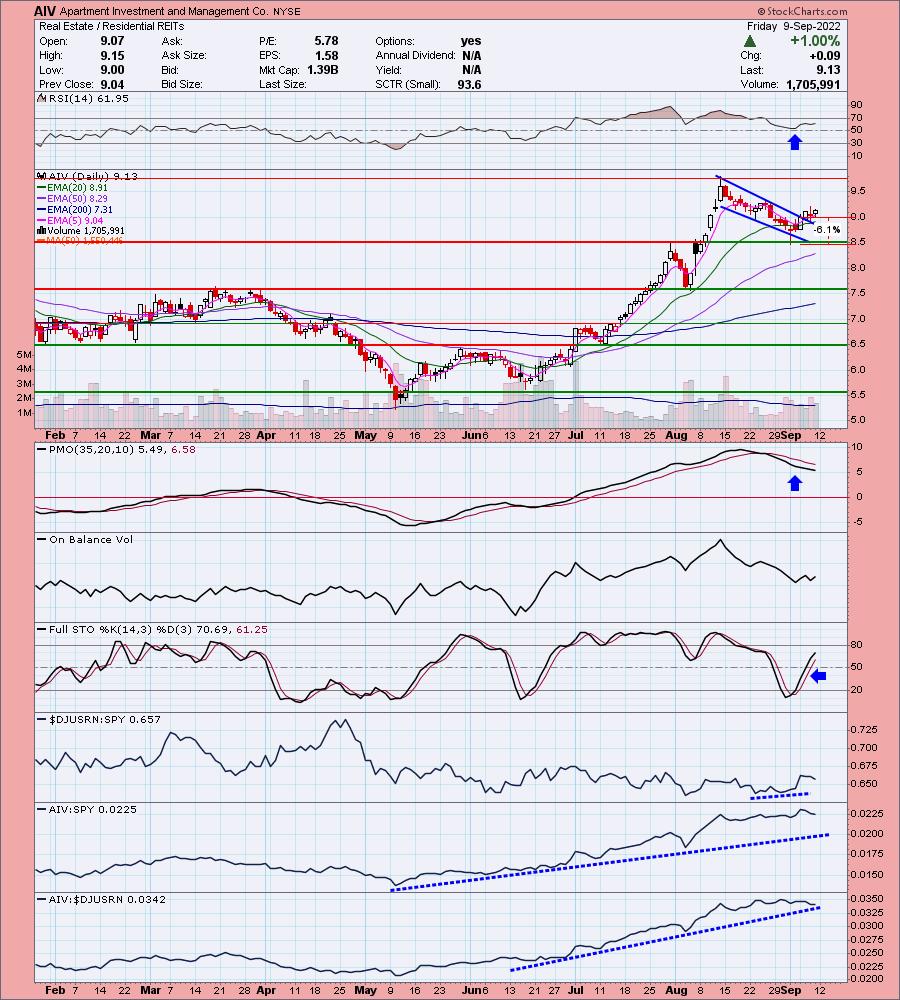
Apartment Investment and Management Co. (AIV)
EARNINGS: 11/3/2022 (AMC)
Apartment Investment & Management Co. operates as a real estate investment trust that engages in the acquisition, ownership, management and redevelopment of apartment properties. The company was founded by Terry Considine in 1975 and is headquartered in Denver, CO.
Predefined Scans Triggered: Elder Bar Turned Green, P&F Ascending Triple Top Breakout and P&F Double Top Breakout.
Below are the commentary and chart from Tuesday (9/6):
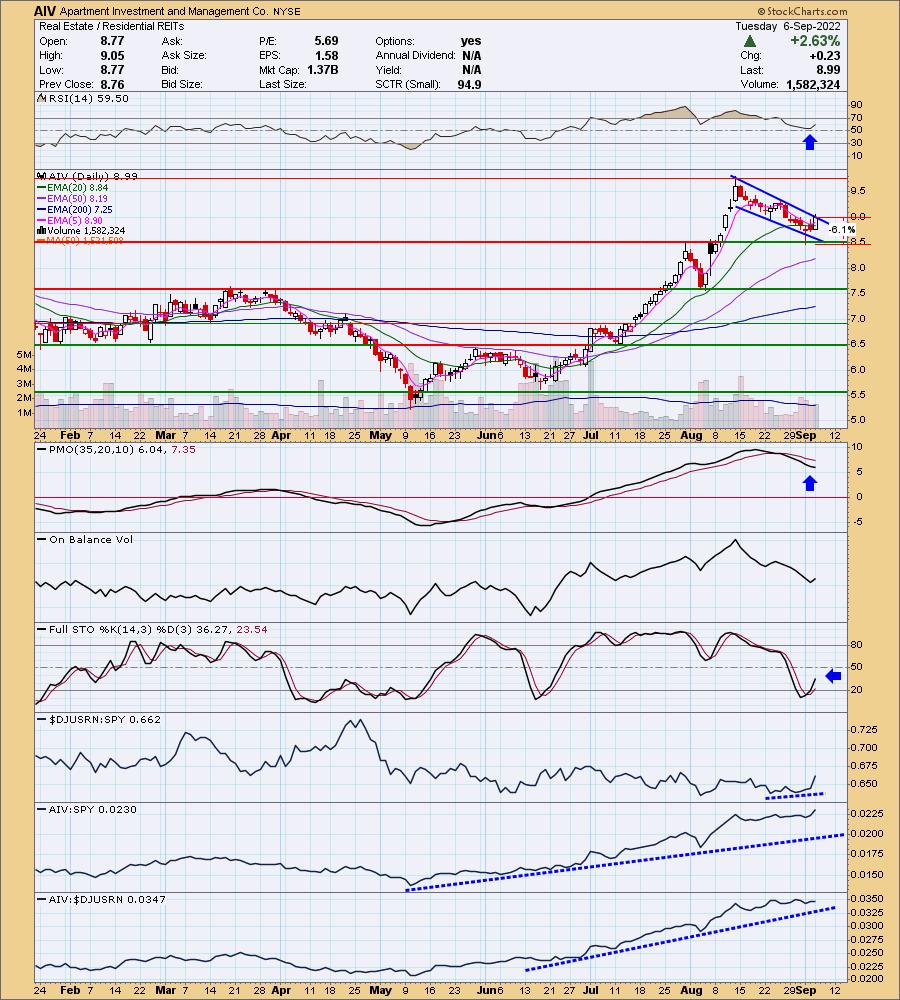
"AIV is down -0.89% in after hours trading, so a breakout may be on hold. However, after hours trading isn't always indicative of future performance the next day. This is one of the few stocks with a bullish EMA configuration (fastest EMA on top, slowest on bottom). This looks very much like a bull flag. In the short term it has formed a bullish falling wedge which implies a breakout ahead. The RSI is positive and the PMO, while still declining, is decelerating and could turn up soon. Stochastics are rising strongly. Longer-term, relative performance is pretty good, but mostly flat in the short term with the exception of strong improvement today. The stop can be set at about 6.1% or $8.45."
Here is today's chart:
When a chart like this is your "Dud", you know you've had a good week. Other than the PMO not cooperating, the rest of the chart looks bullish. There is a decrease in relative strength across the board so there are likely better choices than this one. I don't want to discount the breakout from the falling wedge and that positive RSI looks good too.
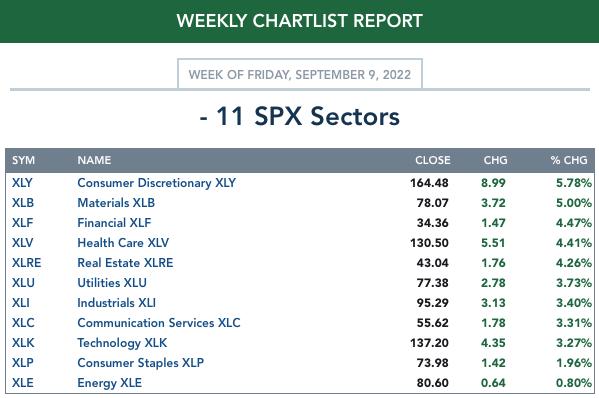
THIS WEEK's Sector Performance:
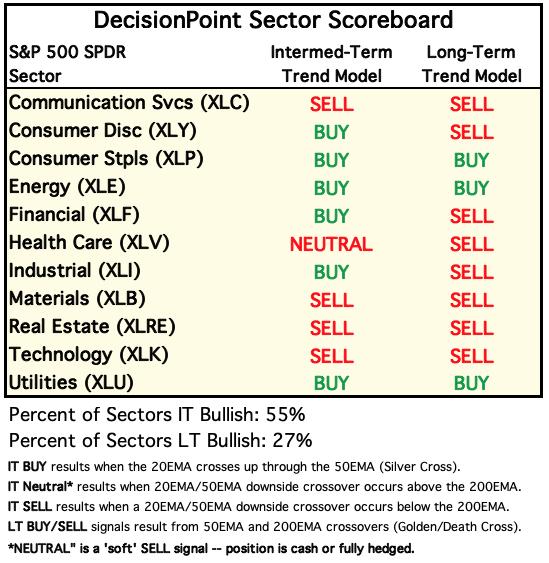
DecisionPoint Sector Scoreboard (Mechanical Trend Model Signals):
Click Here to view Carl's annotated Sector ChartList!
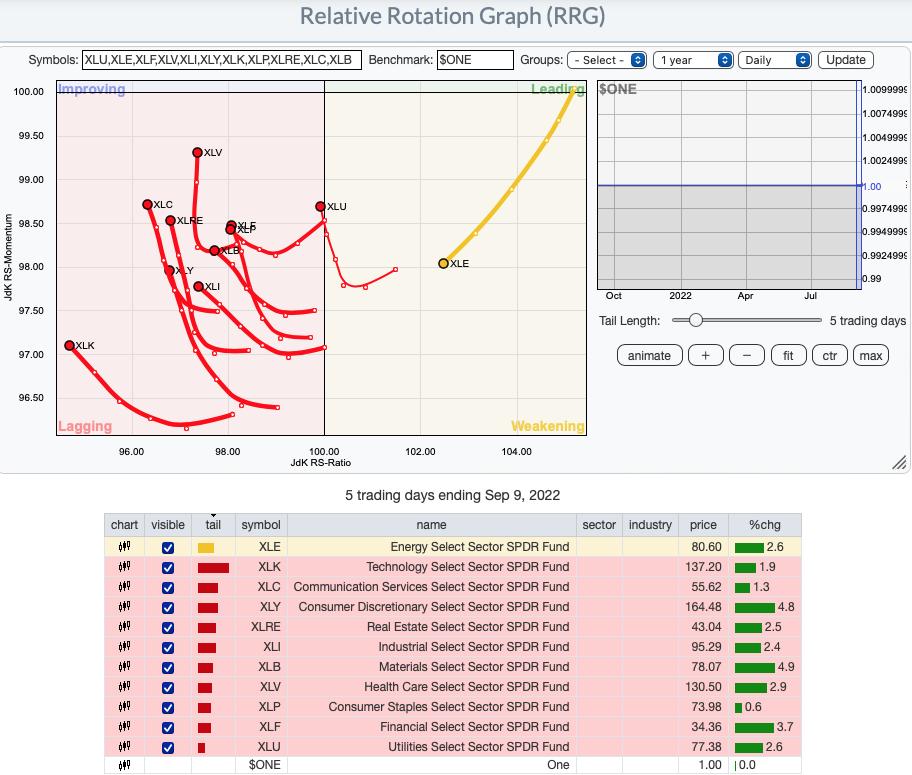
RRG® Daily Chart ($ONE Benchmark):
The short-term RRG is beginning to show signs of life. All but XLE are headed toward the Improving quadrant. Just keep in mind that overall, all of the sectors are still underperforming and in the Lagging quadrant.
RRG® Weekly Chart ($ONE Benchmark):
The intermediate-term RRG is showing marked improvement. All of the sectors are headed to the Leading quadrant to join a very bullish XLU. Two sectors are showing a slip. XLV is headed toward the Lagging quadrant and XLRE is beginning to move in a more southerly direction which could prevent it from reaching the Leading quadrant.
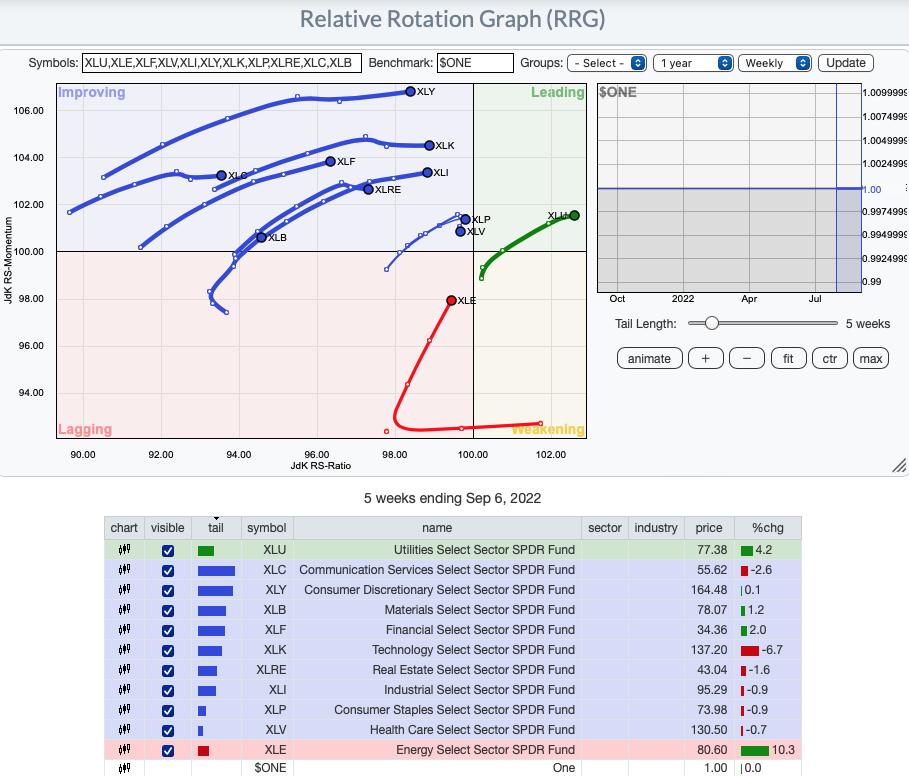
RRG® charts show you the relative strength and momentum for a group of stocks. Stocks with strong relative strength and momentum appear in the green Leading quadrant. As relative momentum fades, they typically move into the yellow Weakening quadrant. If relative strength then fades, they move into the red Lagging quadrant. Finally, when momentum starts to pick up again, they shift into the blue Improving quadrant.
CLICK HERE for an animated version of the RRG charts.
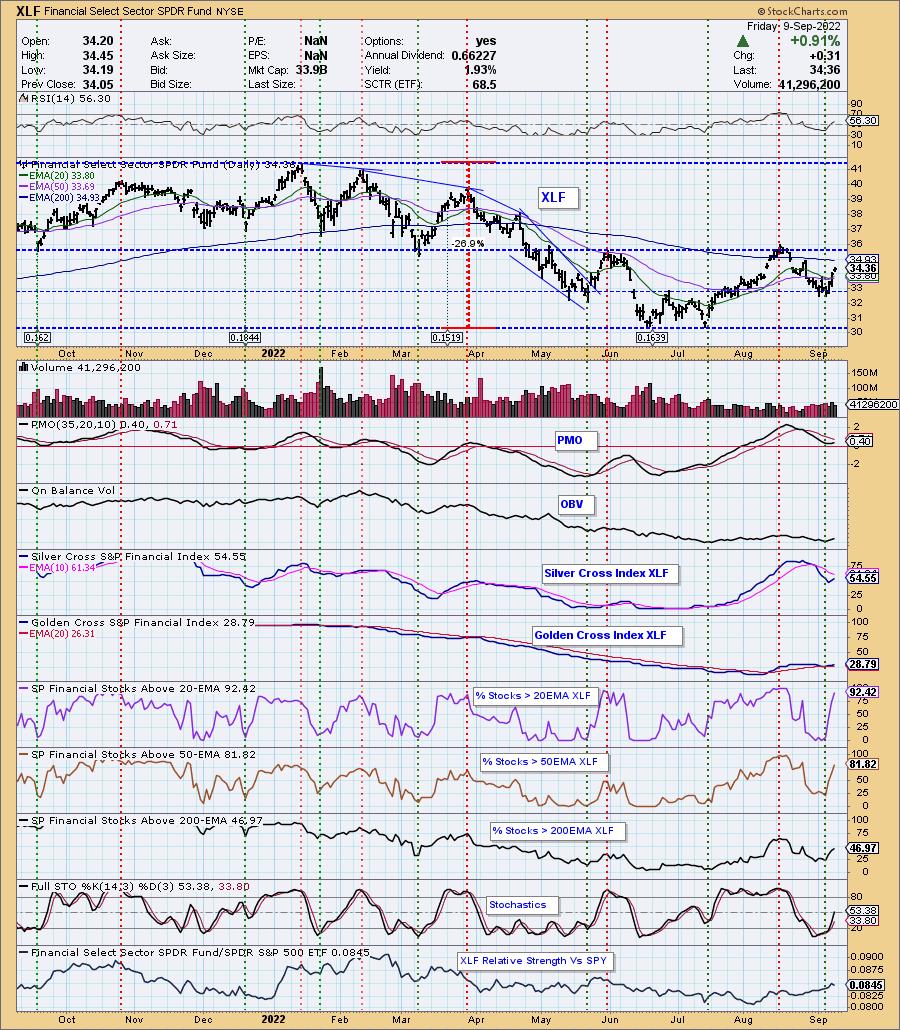
Sector to Watch: Financials (XLF)
There are a few sectors that I like right now. A close second to XLF is Healthcare (XLV). I decided on XLF mainly because XLV is looking weak on the daily RRG. I am hoping we are getting on board with this sector early. Participation shot up on this week's rally with more than 90% of Financial stocks above their 20-day EMA. That reading is overbought, but you'll notice with participation, it can hold overbought or oversold conditions for a long time before failing. The RSI is positive and the PMO has turned up. Stochastics are strongly rising as well.
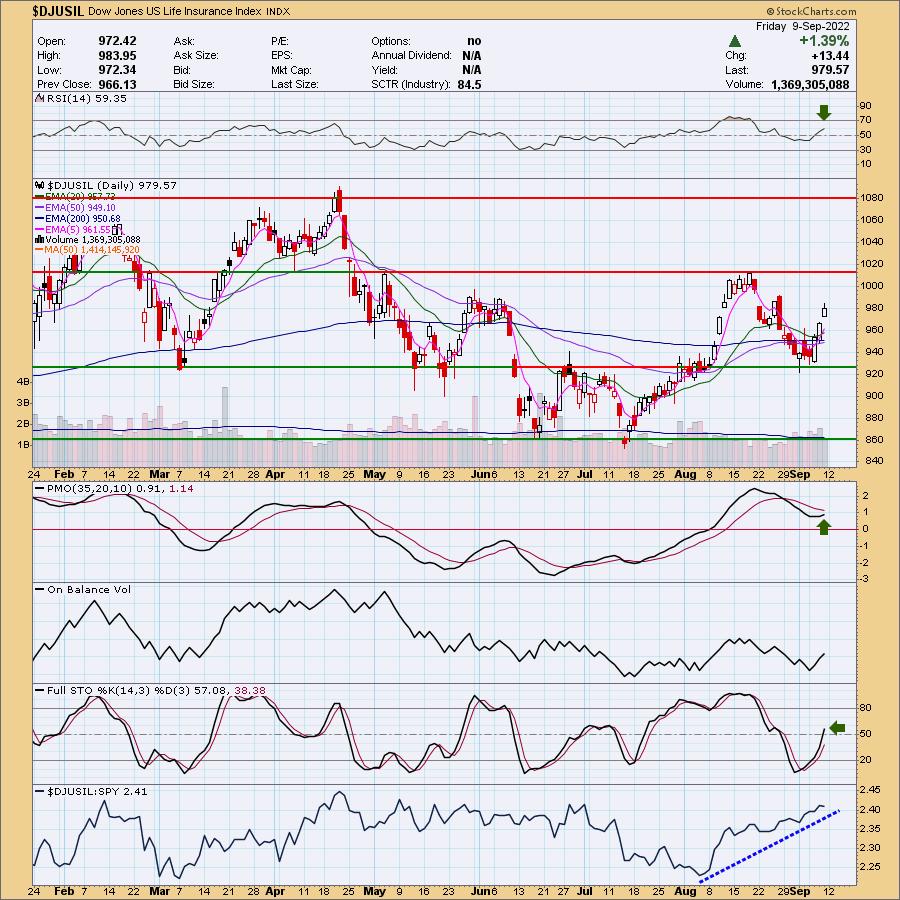
Industry Group to Watch: Life Insurance ($DJUSIL)
Honestly I could have selected quite a few groups within Financials: Banks, Insurance Brokers and Investment Services. I picked this one in the trading room this morning and along with it two stocks within the group that look interesting: AFL and PFG. The rally is strong and this group is a clear out-performer against the SPY. The RSI is positive and the PMO is nearing a crossover BUY signal. Stochastics just moved into positive territory.
Go to our Sector ChartList on DecisionPoint.com to get an in-depth view of all the sectors. On StockCharts.com you can find the Industry Summary.
Have a great weekend! Good Luck & Good Trading!
- Erin
erin@decisionpoint.com
Full Disclosure: I'm 30% exposed with one hedge, PFIX.
Watch the latest episode of DecisionPoint with Carl & Erin Swenlin on Mondays 7:00p EST or on the DecisionPoint playlist on the StockCharts TV YouTube channel here!
Technical Analysis is a windsock, not a crystal ball. --Carl Swenlin
NOTE: The stocks reported herein are from mechanical trading model scans that are based upon moving average relationships, momentum and volume. DecisionPoint analysis is then applied to get five selections from the scans. The selections given should prompt readers to do a chart review using their own analysis process. This letter is not a call for a specific action to buy, sell or short any of the stocks provided. There are NO sure things or guaranteed returns on the daily selection of "diamonds in the rough."
Helpful DecisionPoint Links:
DecisionPoint Shared ChartList and DecisionPoint Chart Gallery
Price Momentum Oscillator (PMO)
Swenlin Trading Oscillators (STO-B and STO-V)
(c) Copyright 2022 DecisionPoint.com