
The streak continues as I had yet another day of zero scan results across the board. I tweaked the requirements and managed to find three middle-of-the-road results. I didn't pick any of them for today. Instead I went with the Industry Summary and dug out a few selections. Steel is looking interesting right now. I have two Real Estate sector stocks. It was one of the few winning sectors today, so it makes sense that the symbols came up in the sector.
This is an excellent example of why I am 15% exposed (with half of it in hedges). There simply are no "Diamonds in the Rough". Consider today's selections as watch list material unless you have a risk appetite to swallow the volatility and chop.
If this continues, I expect tomorrow to have three inverse ETFs and Thursday's requests likely shorting opportunities. No one has had any requests (minus Fred), so I expect I'll present some shorts unless we see a drastic change in the market bias.
Good Luck & Good Trading!
Erin
Today's "Diamonds in the Rough": AIV, AMH and NUE.
"Runners-up": AGIT, ABBV, RDWR, AVB, UDR and EQR.

RECORDING LINK (9/2/2022):
Topic: DecisionPoint Diamond Mine (9/2/2022) LIVE Trading Room
Start Time: Sept 2, 2022 09:00 AM
Meeting Recording Link
Passcode: Sept#2nd
REGISTRATION For Friday 9/9 Diamond Mine:
When: Sep 9, 2022 09:00 AM Pacific Time (US and Canada)
Topic: DecisionPoint Diamond Mine (9/9/2022) LIVE Trading Room
Register in advance for this webinar HERE
Save the registration confirmation email with login instructions in case Zoom doesn't notify you in time.

There was no trading room as Monday was a holiday so here is the last recording.
Welcome to DecisionPoint Diamonds, wherein I highlight ten "Diamonds in the Rough" per week. These are selected from the results of my DecisionPoint Scans, which search for stocks that could benefit from the trend and condition of the market. Remember, these are not recommendations to buy or sell, but are the most interesting of the stocks that surfaced in my scans. My objective is to save you the work of the initial, tedious culling process, but you need to apply your own analysis to see if these stocks pique your interest as well. There are no guaranteed winners here!
"Predefined Scans Triggered" are taken from StockCharts.com using the "Symbol Summary" option instead of a "SharpChart" on the workbench.
Apartment Investment and Management Co. (AIV)
EARNINGS: 11/3/2022 (AMC)
Apartment Investment & Management Co. operates as a real estate investment trust that engages in the acquisition, ownership, management and redevelopment of apartment properties. The company was founded by Terry Considine in 1975 and is headquartered in Denver, CO.
Predefined Scans Triggered: Elder Bar Turned Green, P&F Ascending Triple Top Breakout and P&F Double Top Breakout.
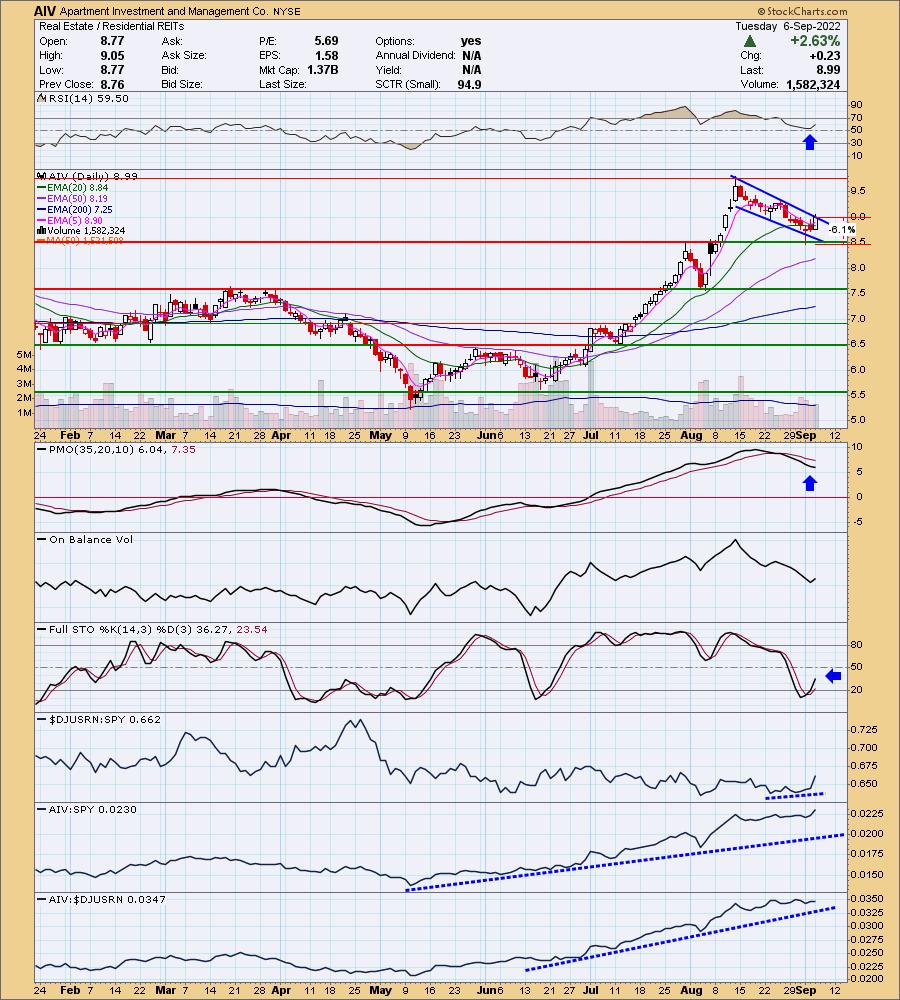
AIV is down -0.89% in after hours trading, so a breakout may be on hold. However, after hours trading isn't always indicative of future performance the next day. This is one of the few stocks with a bullish EMA configuration (fastest EMA on top, slowest on bottom). This looks very much like a bull flag. In the short term it has formed a bullish falling wedge which implies a breakout ahead. The RSI is positive and the PMO, while still declining, is decelerating and could turn up soon. Stochastics are rising strongly. Longer-term, relative performance is pretty good, but mostly flat in the short term with the exception of strong improvement today. The stop can be set at about 6.1% or $8.45.
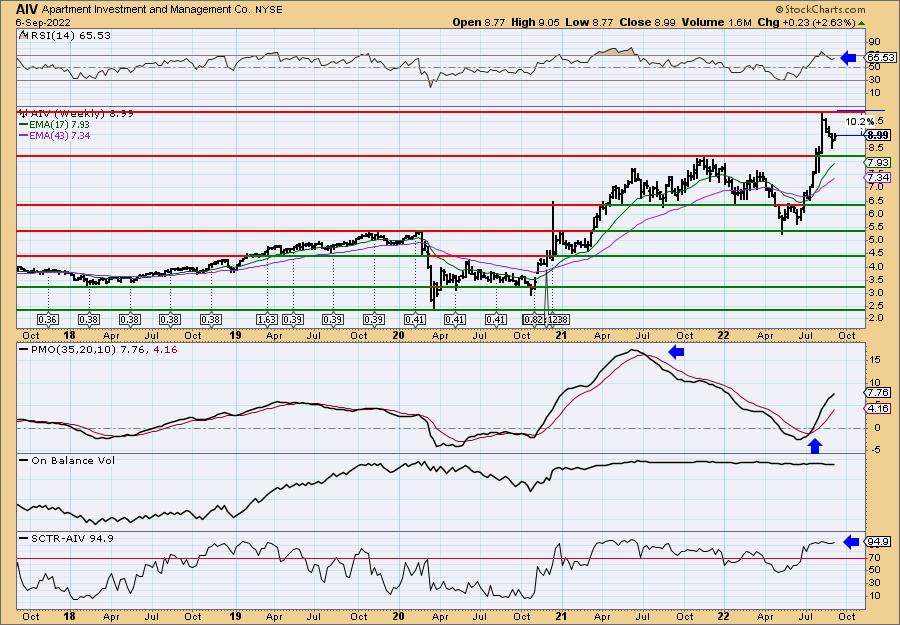
The bull flag looks even more promising on the weekly chart. The weekly PMO is rising and isn't overbought yet. The weekly RSI has left overbought territory, but remains in positive territory above net neutral (50). The SCTR is excellent at almost 95%. Upside potential is more than 10.2%.
American Homes 4 Rent (AMH)
EARNINGS: 11/3/2022 (AMC)
American Homes 4 Rent operates as a real estate investment trust. It engages in the acquisition, renovation, leasing, and operating of single-family homes as rental properties. The company was founded by Bradley Wayne Hughes, Sr. on October 19, 2012 and is headquartered in Calabasas, CA.
Predefined Scans Triggered: Entered Ichimoku Cloud.
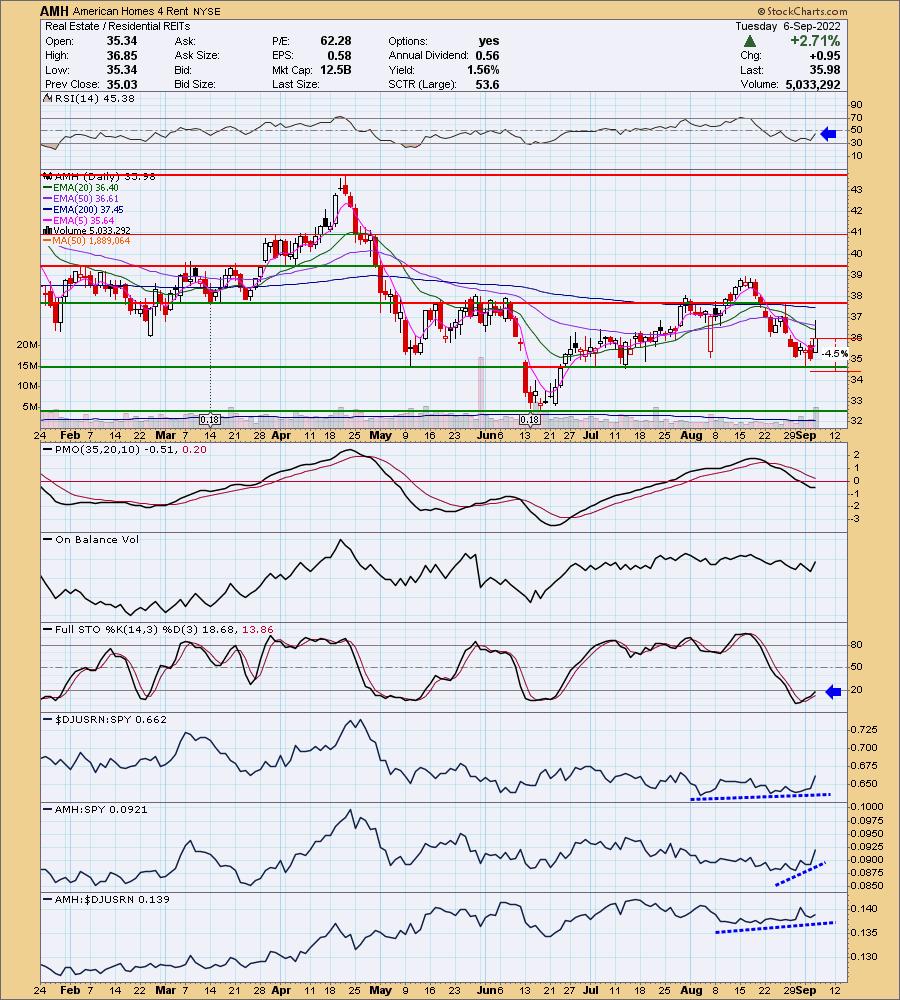
AMH is unchanged in after hours trading. Price bounced off strong support so while it hasn't moved back above the 20/50-day EMAs, the pivot is encouraging. The RSI is negative but rising. The PMO has turned up on today's strong move. Stochastics have turned back up in oversold territory. Relative strength could be better, but it isn't horrible given what we are seeing on so many other industry groups and stocks. The stop can be set thinly at -4.5% or $34.36.
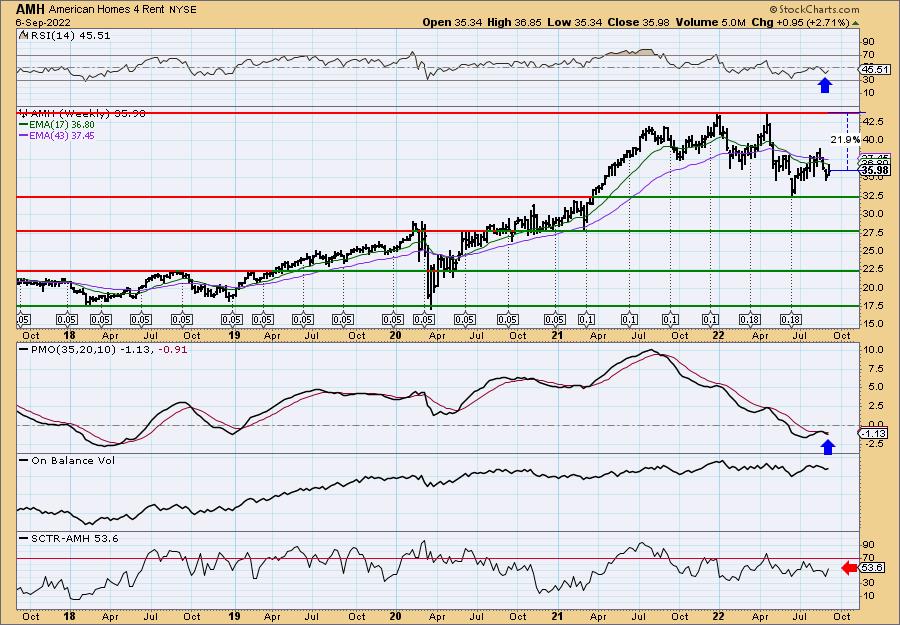
The weekly chart isn't great, but I've seen worse. I do not like the whipsaw weekly PMO SELL signal, but the PMO is beginning to decelerate. The weekly RSI is negative, but rising. The SCTR is barely mediocre at 53.6%. There is a lot of upside potential and we can set that thin stop mentioned above.
Nucor Corp. (NUE)
EARNINGS: 10/20/2022 (BMO)
Nucor Corp. engages in the manufacturing of steel and steel products. It operates through the following segments: Steel Mills, Steel Products, and Raw Materials. The Steel Mills segment consists of carbon and alloy steel in sheet, bars, structural and plate, steel trading businesses, rebar distribution businesses, and Nucor's equity method investments. The Steel Products segment includes steel joists and joist girders, steel deck, fabricated concrete reinforcing steel, cold finished steel, steel fasteners, metal building systems, steel grating, tubular products businesses, piling products businesses, and wire and wire mesh. The Raw Materials segment consists of direct reduced iron, and ferrous and nonferrous metals. The company was founded by Ransom E. Olds in 1905 and is headquartered in Charlotte, NC.
Predefined Scans Triggered: Elder Bar Turned Blue.
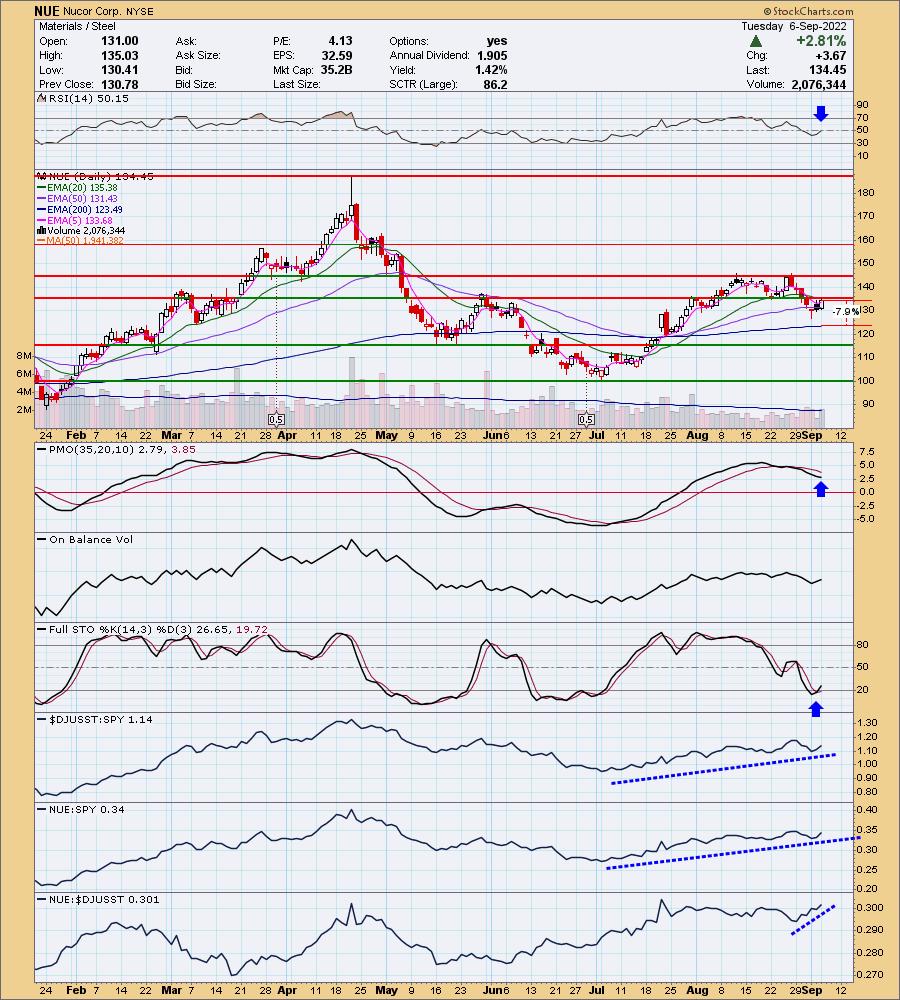
NUE is up +0.32% in after hours trading. The last time I covered it was on July 27th 2021. I covered twice more earlier in that year. You'll find those link in the last report I've linked to. Two of the three positions are actually still open and up around 113% and 35%. This sure looks like a bullish cup with handle. The RSI just hit positive territory. The PMO is decelerating. Stochastics have turned up in oversold territory. Relative strength is very good with NUE being a clear leader amongst the group. The stop is set around the 200-day EMA at 7.9% or $123.83.
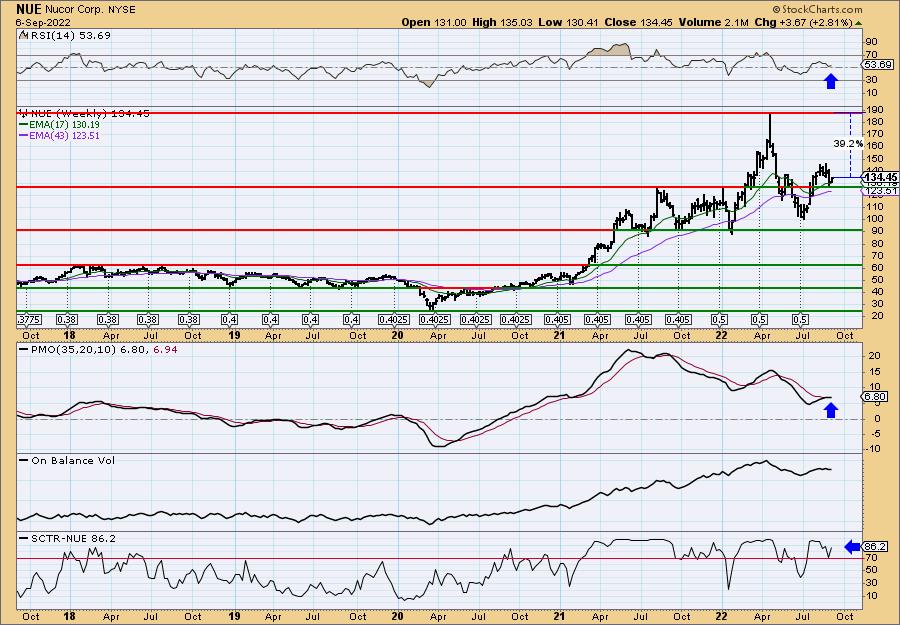
The weekly chart is quite nice. The weekly RSI is staying in positive territory. The weekly PMO is nearing a crossover BUY signal. The SCTR is in the "hot zone" above 70, meaning it is in the top 30% of all large-caps or as in the case of NUE, in the top 14%. Upside target is the 2022 high.
Don't forget, on Thursdays I look at reader-requested symbols, click HERE to send me an email. I read every email I receive and try to answer them all!
Current Market Outlook:
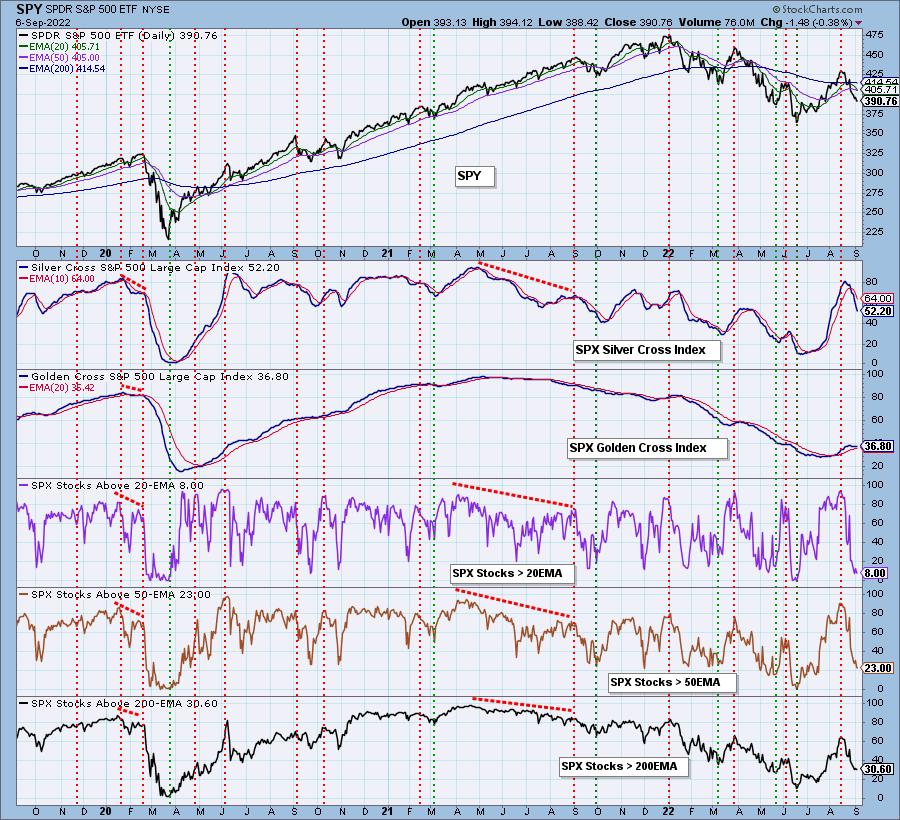
Market Environment: It is important to consider the odds for success by assessing the market tides. The following chart uses different methodologies for objectively showing the depth and trend of participation for intermediate- and long-term time frames.
- The Silver Cross Index (SCI) shows the percentage of SPX stocks on IT Trend Model BUY signals (20-EMA > 50-EMA)
- The Golden Cross Index (GCI) shows the percentage of SPX stocks on LT Trend Model BUY signals (50-EMA > 200-EMA)
Don't forget that as a "Diamonds" member, you have access to our GCI/SCI curated ChartList on DecisionPoint.com. You'll find it under "Members Only" links on the left side on the Blogs and Links Page.
Here is the current chart:
Full Disclosure: I am 15% exposed, half of which is hedge.
I'm required to disclose if I currently own a stock I mention and/or may buy/short it within the next 72 hours.
"Technical Analysis is a windsock, not a crystal ball." - Carl Swenlin
(c) Copyright 2022 DecisionPoint.com
Watch the latest episode of DecisionPoint with Carl & Erin Swenlin on Mondays 7:00p EST or on the DecisionPoint playlist on the StockCharts TV YouTube channel here!
NOTE: The stocks reported herein are from mechanical trading model scans that are based upon moving average relationships, momentum and volume. DecisionPoint analysis is then applied to get five selections from the scans. The selections given should prompt readers to do a chart review using their own analysis process. This letter is not a call for a specific action to buy, sell or short any of the stocks provided. There are NO sure things or guaranteed returns on the daily selection of "Diamonds in the Rough."
Regarding BUY/SELL Signals: The signal status reported herein is based upon mechanical trading model signals and crossovers. They define the implied bias of the price index/stock based upon moving average relationships and momentum, but they do not necessarily call for a specific action. They are information flags that should prompt chart review. Further, they do not call for continuous buying or selling during the life of the signal. For example, a BUY signal will probably (but not necessarily) return the best results if action is taken soon after the signal is generated. Additional opportunities for buying may be found as price zigzags higher, but the trader must look for optimum entry points. Conversely, exit points to preserve gains (or minimize losses) may be evident before the model mechanically closes the signal.
Helpful DecisionPoint Links:
DecisionPoint Shared ChartList and DecisionPoint Chart Gallery
Price Momentum Oscillator (PMO)
Swenlin Trading Oscillators (STO-B and STO-V)
For more links, go to DecisionPoint.com