
I had an easier time selecting "Diamonds in the Rough" today as I finally had quality scan results. Two of today's selections come from what I call "Carl's Scan". I sat down with Dad right after I started DP Diamonds and asked him to tell me what makes a good chart to him.
If you have watched some of our joint trading rooms, you'll know that he believes I wait for too much confirmation (sometimes). His scan ultimately finds beatdown stocks/ETFs that are showing distinct improvement with momentum and other factors. Sorry, you can't have it, it is proprietary or our "secret sauce" for "Diamonds in the Rough". We'll see how these stocks do as we progress this week (CERE and SHLS)
The other stock was from my "Momentum Sleepers" scan. This scan is probably my favorite and it didn't disappoint today (FN).
Good Luck & Good Trading!
Erin
Today's "Diamonds in the Rough": CERE, FN and SHLS.
Runners Up: PLXS, PRI, MCK, DAWN and FFIN.

RECORDING LINK (9/30/2022):
Topic: DecisionPoint Diamond Mine (9/30/2022) LIVE Trading Room
Start Time: Sept 30, 2022 09:00 AM
Passcode: Sept#30th
*** NO DIAMOND MINE ON 10/7 ***
I will be at ChartCon 2022 on Friday and unable to hold the trading room. I'm planning on doing the Recap, but that is tentative. You will receive your ten picks for the week including ETF Day and Reader Request Day.
I'll be running trading rooms with Dave Landry so you might want to sign up to attend ChartCon 2022! I'll also be debating my friend, Tom Bowley point/counterpoint style bear v. bull! The event will not be like it was in the past. It is more of a television production with entertaining segments that will make education fun! Here is the link.

Here is the Monday 10/3 recording:
Welcome to DecisionPoint Diamonds, wherein I highlight ten "Diamonds in the Rough" per week. These are selected from the results of my DecisionPoint Scans, which search for stocks that could benefit from the trend and condition of the market. Remember, these are not recommendations to buy or sell, but are the most interesting of the stocks that surfaced in my scans. My objective is to save you the work of the initial, tedious culling process, but you need to apply your own analysis to see if these stocks pique your interest as well. There are no guaranteed winners here!
"Predefined Scans Triggered" are taken from StockCharts.com using the "Symbol Summary" option instead of a "SharpChart" on the workbench.
Cerevel Therapeutics Holdings, Inc. (CERE)
EARNINGS: 10/31/2022 (BMO)
Cerevel Therapeutics Holdings, Inc. engages in the discovery and development of new therapies for neuroscience diseases. The firm's portfolio focuses on diseases such as schizophrenia, epilepsy, and Parkinson's disease. Its product candidates include CVL-231, Darigabat, Tavapadon, CVL-871, and CVL-936. The company was founded in 2018 and is headquartered in Cambridge, MA.
Predefined Scans Triggered: P&F Low Pole.
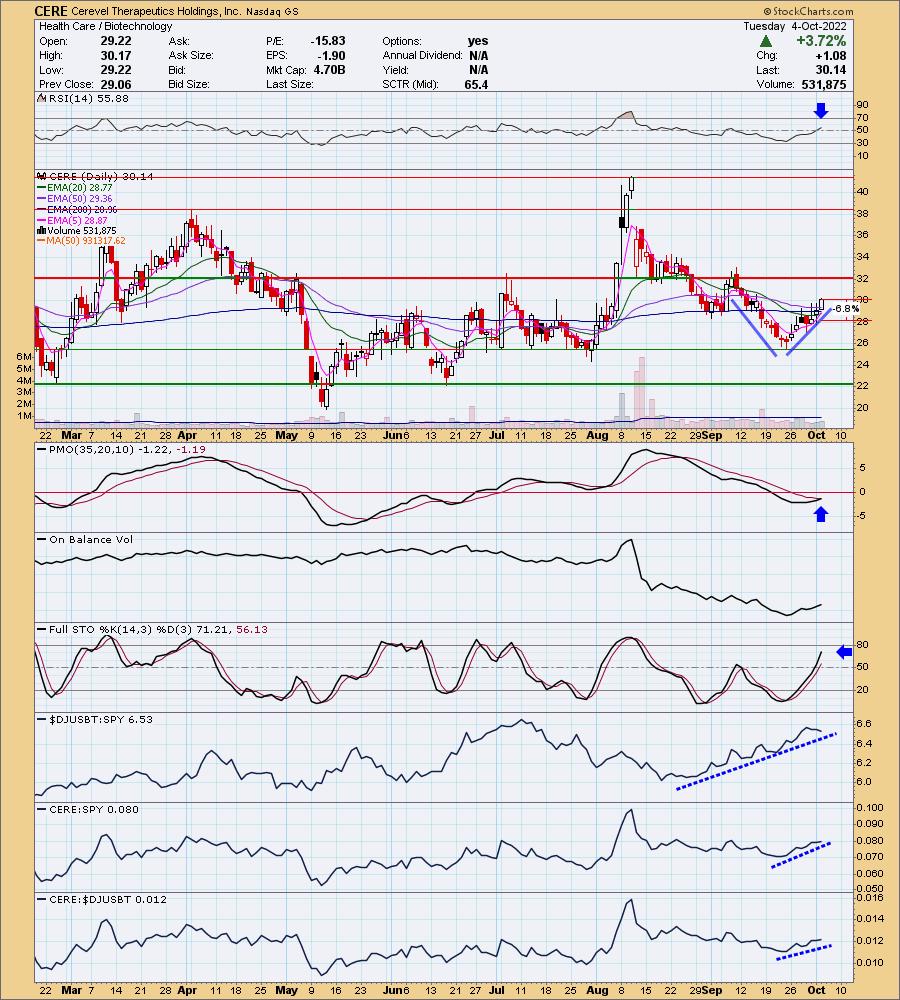
CERE is down -4.98% in after hours. While that will hurt the spreadsheet if it bleeds into tomorrow, it does give you a better entry and a thinner stop. Just wouldn't recommend any overnight orders. We have a "V" Bottom formation. It has retraced more than a third of the way up which implies a move above overhead resistance at $32. The RSI just moved into positive territory and the PMO is about to trigger a crossover BUY signal. Stochastics are rising strongly and relative strength is rising. I've set the stop at 6.8% or around $28.09.
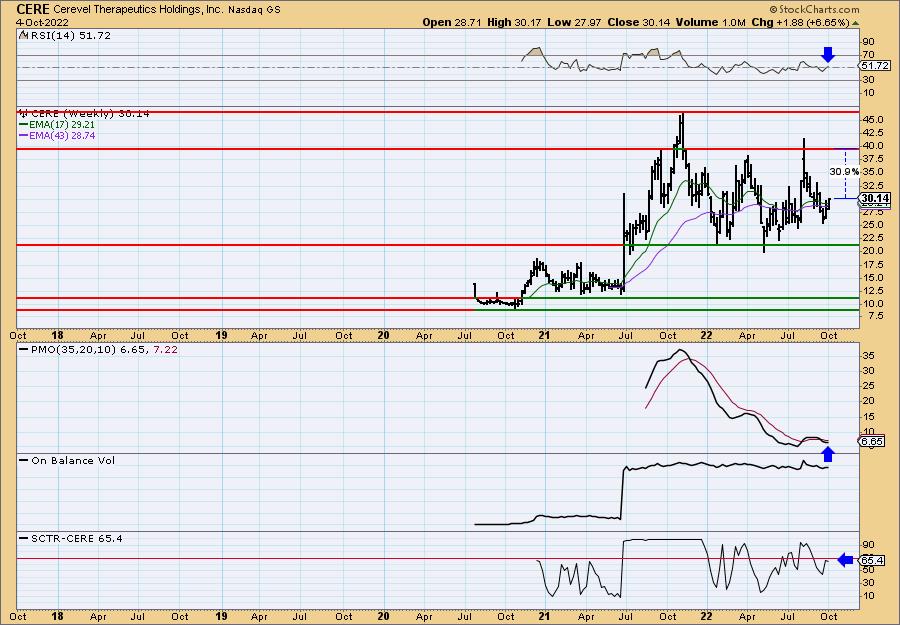
The weekly chart shows a wide trading range with price currently about halfway in between. That means some risk, but I like the rest of the chart. The weekly RSI is now back in positive territory above net neutral (50). The weekly PMO is turning back up. The SCTR isn't above 70 where we like it so there is some risk associated with that.
Fabrinet (FN)
EARNINGS: 10/31/2022 (AMC)
Fabrinet engages in the provision of optical packaging and electronic manufacturing services to original equipment manufacturers. The firm's engineering services include process design, failure analysis, reliability testing, tooling design, and real-time traceability system. Its manufacturing operations offer sensors, subsystems, customized optics, and optical modules and components. The company was founded by David Thomas Mitchell on August 12, 1999 and is headquartered in George Town, Cayman Islands.
Predefined Scans Triggered: Bullish MACD Crossovers and P&F Double Top Breakout.
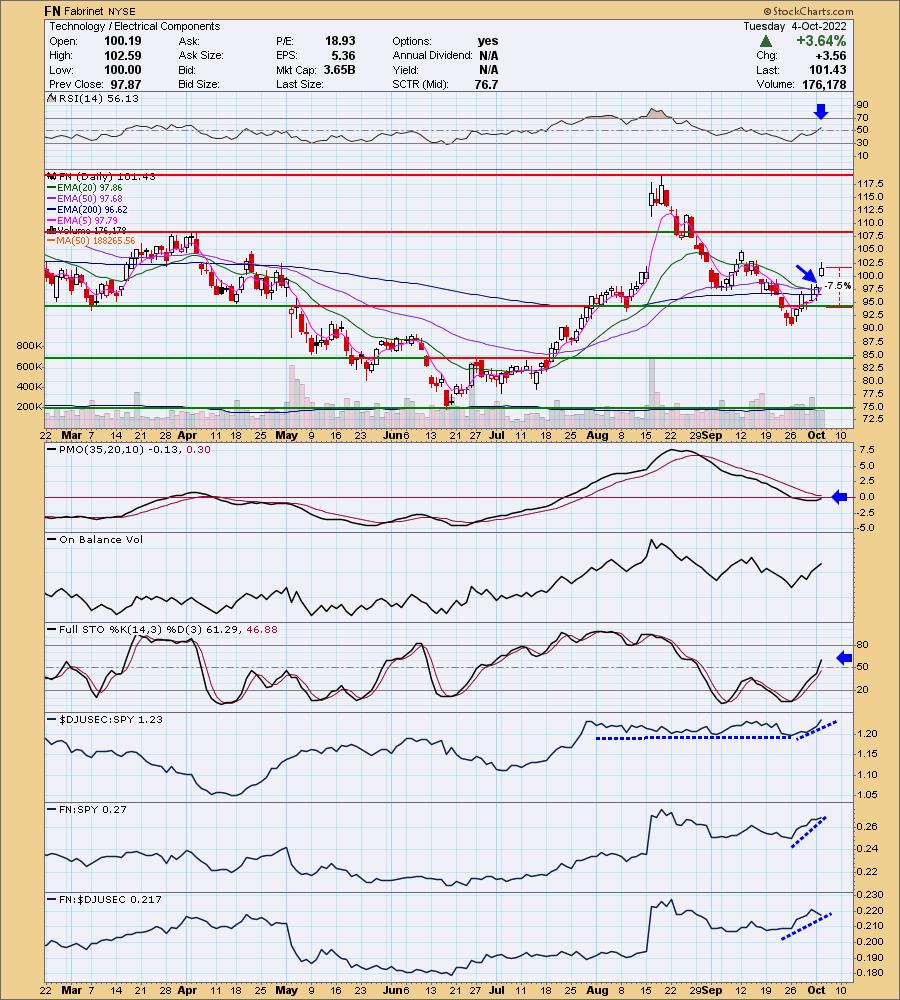
FN is down -1.19% in after hours trading. With today's gap up there is a risk that this will be a reverse island, but given positive indicators, I'm expecting price to continue higher. The RSI just moved into positive territory and the PMO is bottoming just below the zero line. Stochastics are accelerating higher. Relative strength is improving for FN against the group. The group is also beginning to outperform. The stop is set at 7.5% or around $93.82.
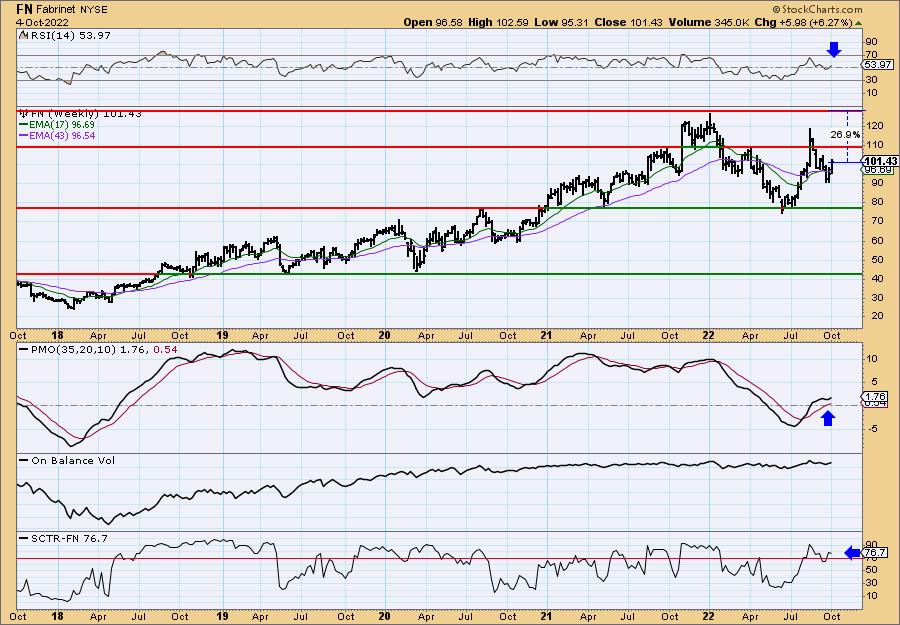
What impressed me most about the weekly chart was the weekly PMO. It has bottomed above its signal line and isn't overbought. A PMO bottom above the signal line is especially bullish. The SCTR is a respectable 76.7%.
Shoals Technologies Group Inc. (SHLS)
EARNINGS: 11/8/2022 (AMC)
Shoals Technologies Group, Inc. provides electrical balance of system solutions for solar energy projects. Its EBOS components include cable assemblies, inline fuses, combiners, disconnects, recombiners, wireless monitoring systems, junction boxes, transition enclosures and splice boxes. The company was founded by Dean Solon in November 1996 and is headquartered in Portland, TN.
Predefined Scans Triggered: Bullish MACD Crossovers and P&F Low Pole.
SHLS is unchanged in after hours trading. We have another bullish "V" Bottom pattern. It has retraced half of the pattern which suggests a breakout ahead above $28. The RSI is confirming with a move back into positive territory and the PMO has bottomed. Stochastics are rising nicely and relative strength is continuing to improve. This can be a volatile industry group so you may want to expand the stop level. Basically I wouldn't want it if it moved below the 200-day EMA. The stop is set at 7.5% or around $22.20.
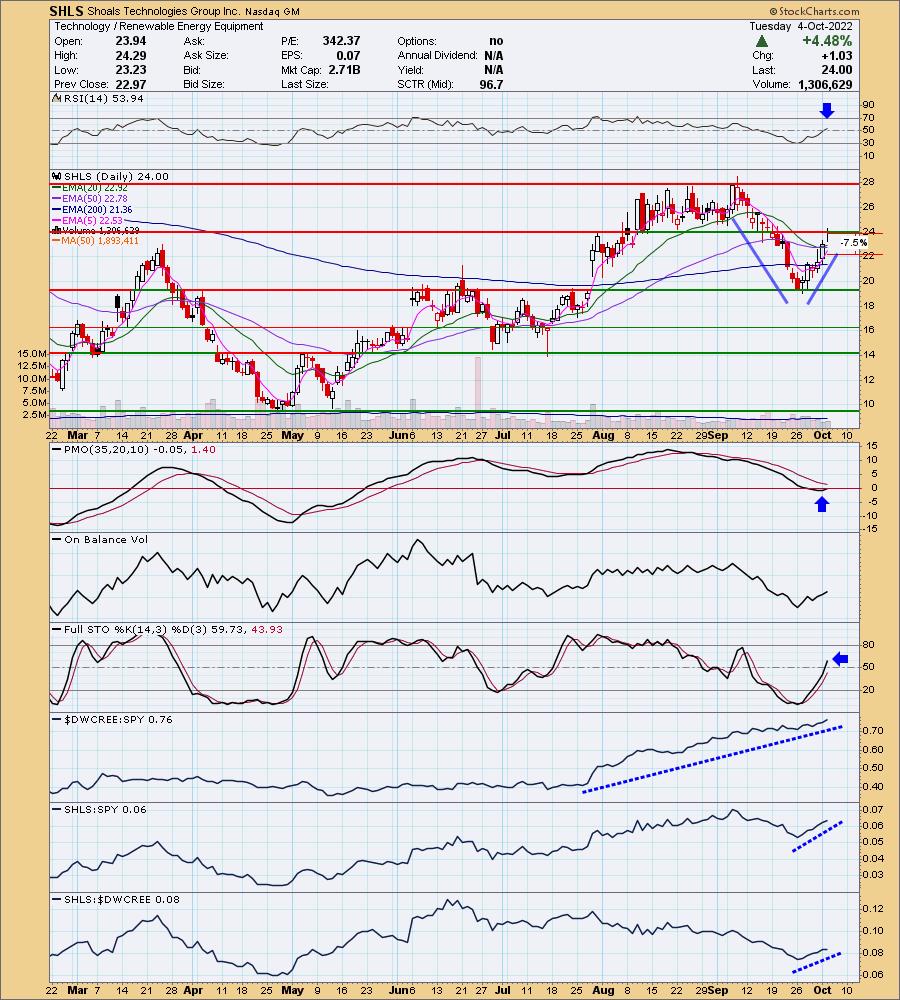
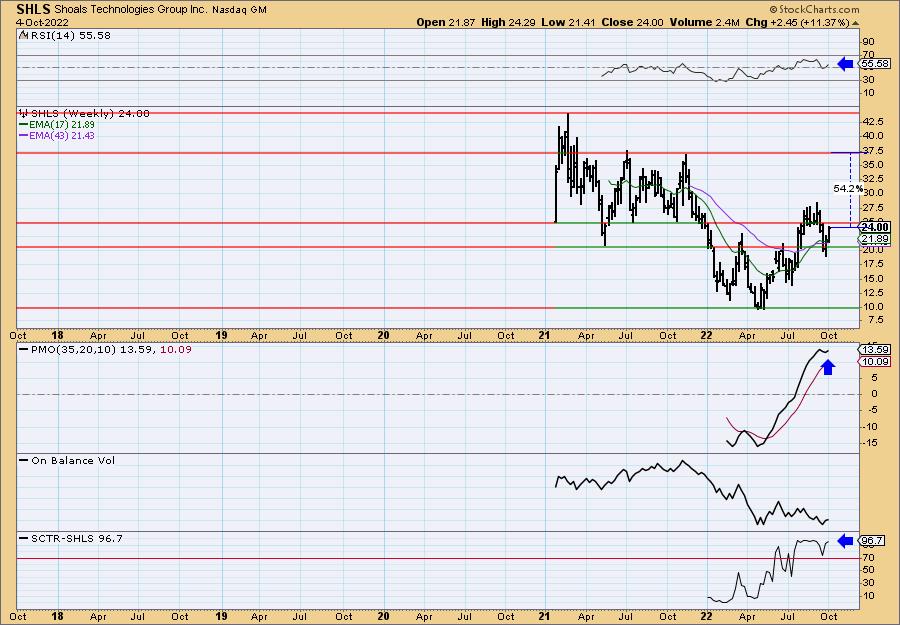
We still need to see a breakout above $25 given that is the strongest area of resistance on the weekly chart. The indicators suggest it will. The weekly RSI is positive and the weekly PMO has bottomed above its signal line. The SCTR is a strong 96.7%. We don't want to extrapolate too much about the weekly PMO regarding overbought and oversold conditions, but we can hang our hat on the bottom above the signal line. I measured it and worst case upside target is about $27.60 or about 15% gain. I have listed the optimistic case of a 54% gain.
Don't forget, on Thursdays I look at reader-requested symbols, click HERE to send me an email. I read every email I receive and try to answer them all!
Current Market Outlook:
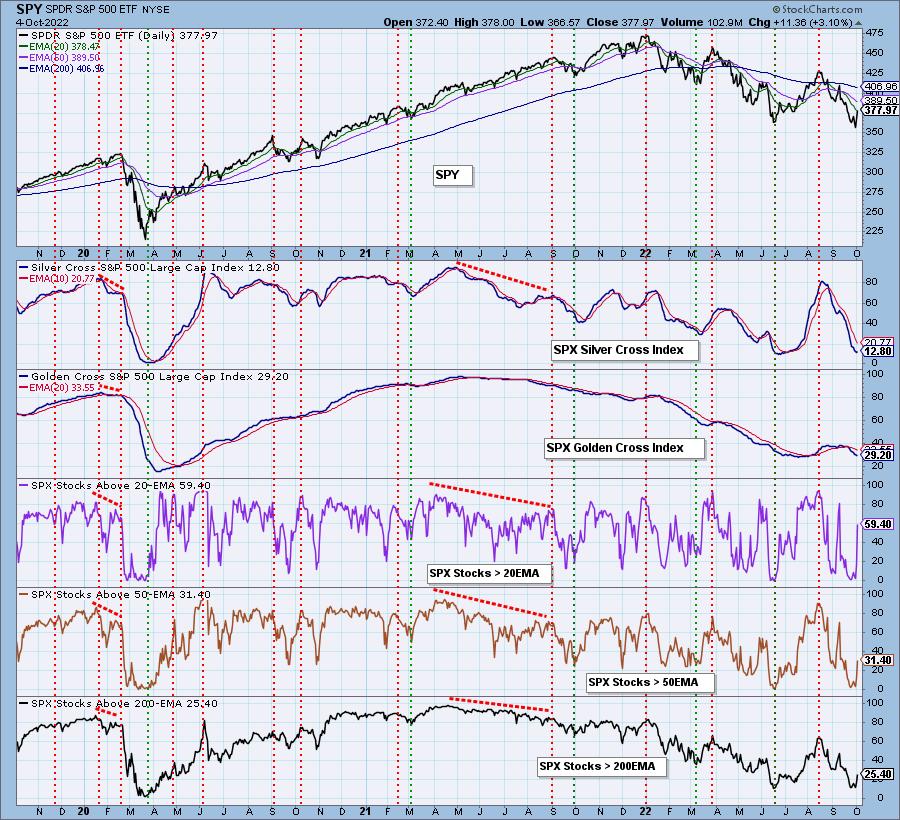
Market Environment: It is important to consider the odds for success by assessing the market tides. The following chart uses different methodologies for objectively showing the depth and trend of participation for intermediate- and long-term time frames.
- The Silver Cross Index (SCI) shows the percentage of SPX stocks on IT Trend Model BUY signals (20-EMA > 50-EMA)
- The Golden Cross Index (GCI) shows the percentage of SPX stocks on LT Trend Model BUY signals (50-EMA > 200-EMA)
Don't forget that as a "Diamonds" member, you have access to our GCI/SCI curated ChartList on DecisionPoint.com. You'll find it under "Members Only" links on the left side on the Blogs and Links Page.
Here is the current chart:
Full Disclosure: I am 15% exposed.
I'm required to disclose if I currently own a stock I mention and/or may buy/short it within the next 72 hours.
"Technical Analysis is a windsock, not a crystal ball." - Carl Swenlin
(c) Copyright 2022 DecisionPoint.com
Watch the latest episode of DecisionPoint with Carl & Erin Swenlin on Mondays 7:00p EST or on the DecisionPoint playlist on the StockCharts TV YouTube channel here!
NOTE: The stocks reported herein are from mechanical trading model scans that are based upon moving average relationships, momentum and volume. DecisionPoint analysis is then applied to get five selections from the scans. The selections given should prompt readers to do a chart review using their own analysis process. This letter is not a call for a specific action to buy, sell or short any of the stocks provided. There are NO sure things or guaranteed returns on the daily selection of "Diamonds in the Rough."
Regarding BUY/SELL Signals: The signal status reported herein is based upon mechanical trading model signals and crossovers. They define the implied bias of the price index/stock based upon moving average relationships and momentum, but they do not necessarily call for a specific action. They are information flags that should prompt chart review. Further, they do not call for continuous buying or selling during the life of the signal. For example, a BUY signal will probably (but not necessarily) return the best results if action is taken soon after the signal is generated. Additional opportunities for buying may be found as price zigzags higher, but the trader must look for optimum entry points. Conversely, exit points to preserve gains (or minimize losses) may be evident before the model mechanically closes the signal.
Helpful DecisionPoint Links:
DecisionPoint Shared ChartList and DecisionPoint Chart Gallery
Price Momentum Oscillator (PMO)
Swenlin Trading Oscillators (STO-B and STO-V)
For more links, go to DecisionPoint.com