
One of today's reader requests was actually asked for twice! That rarely happens. It made it easy to pick at least one symbol! There are plenty of symbols I didn't cover today. Two were leveraged ETFs bullish Crude Oil. I'm bullish on Oil, but barely so I didn't feel comfortable presenting leveraged ETFs.
A helpful hint when requesting symbols, the Price Momentum Oscillator (PMO) should be rising, even if it is just one day. I will nearly always pass on presenting symbols as "Diamonds in the Rough" in the written report. I'm happy to look at your symbols in the Diamond Mine trading room regardless of PMO direction. I have noted the ones I didn't cover so I'll try to cover them tomorrow. The registration link for tomorrow's trading room is located below the Diamonds logo.
I saw an interesting theme of Financials, particular Banks in my scans today. It just so happens that one of the symbol requests was a Financial so I'm including it.
See you tomorrow! Good Luck & Good Trading!
Erin
Today's "Diamonds in the Rough": CALM, CLF, GNK and HCI.
Other requests: ALT, GUSH, NRGU, RAD, IWM, SARK and PWSC.
Important: Your current subscription rates will ALWAYS stay the same when we raise prices. **
** You must keep your subscription running and in good standing.

RECORDING LINK (12/16/2022):
Topic: DecisionPoint Diamond Mine (12/16/2022) LIVE Trading Room
Start Time: Dec 16, 2022 09:00 AM
Recording Link HERE
Passcode: Dec#16th
REGISTRATION for 12/23/2022:
When: Dec 23, 2022 09:00 AM Pacific Time (US and Canada)
Topic: DecisionPoint Diamond Mine (12/23/2022) LIVE Trading Room
Register in advance for this webinar HERE
After registering, you will receive a confirmation email containing information about joining the webinar.

Here is the last recording:
Welcome to DecisionPoint Diamonds, wherein I highlight ten "Diamonds in the Rough" per week. These are selected from the results of my DecisionPoint Scans which search for stocks that could benefit from the trend and condition of the market. Remember, these are not recommendations to buy or sell, but are the most interesting of the stocks that surfaced in my scans. My objective is to save you the work of the initial, tedious culling process, but you need to apply your own analysis to see if these stocks pique your interest as well. There are no guaranteed winners here!
"Predefined Scans Triggered" are taken from StockCharts.com using the "Symbol Summary" option instead of a "SharpChart" on the workbench.
Stop levels are all rounded down.
Cal-Maine Foods, Inc. (CALM)
EARNINGS: 12/28/2022 (AMC)
Cal-Maine Foods, Inc. engages in the production, grading, packing, marketing, and distribution of fresh shell eggs. The firm operates farms, processing plants, hatcheries, feed mills, warehouses, offices and other properties. It markets shell eggs to national and regional grocery store chains, club stores, foodservice distributors, and egg product manufacturers. The company was founded by Fred R. Adams Jr. in 1957 and is headquartered in Jackson, MS.
Predefined Scans Triggered: P&F Double Top Breakout and Ichimoku Cloud Turned Red.
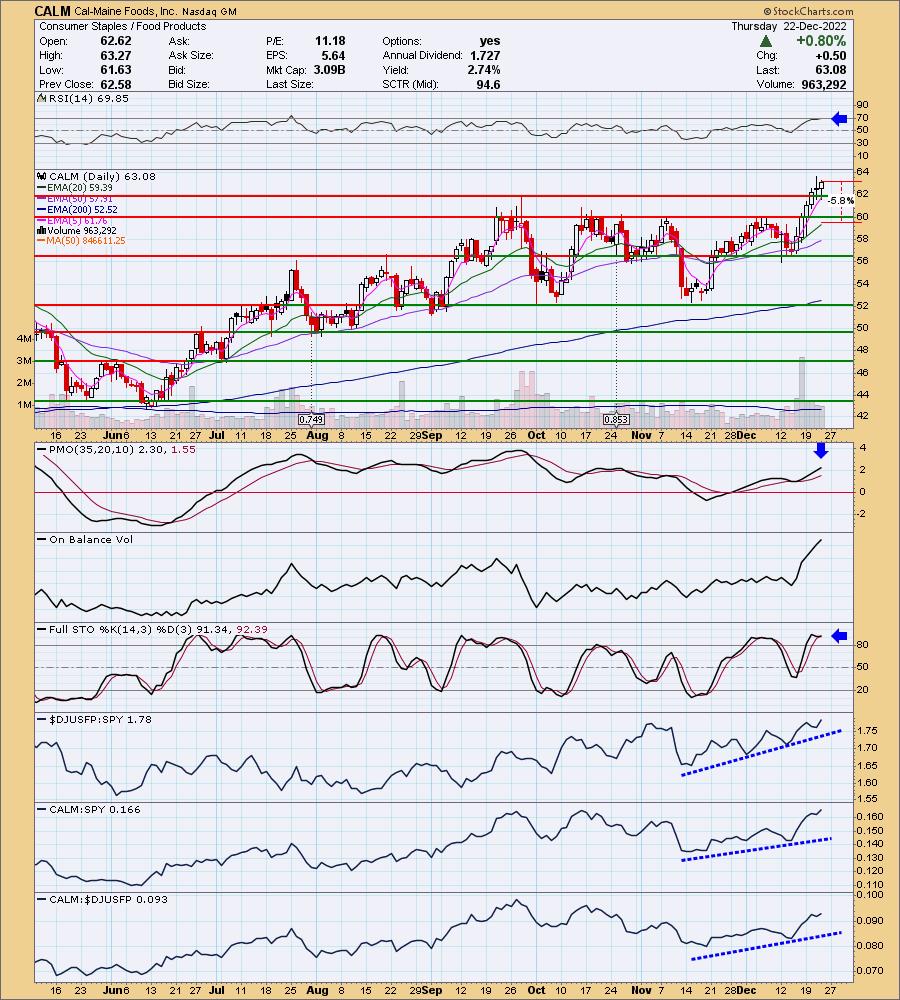
CALM is up +1.06% in after hours trading. It actually broke out on Tuesday and it is showing excellent follow-through with apparently no need to pull back toward the breakout point. It likely will pull back soon given the many up days. However the rising trend should continue based on the indicators. The RSI is positive and the PMO is rising and not overbought. Volume has been pouring in based on the OBV and Stochastics are above 80. The group is seeing excellent relative strength and CALM is outperforming the group and consequently the SPY. I like that you can set a pretty thin stop at 5.8% or $59.42.
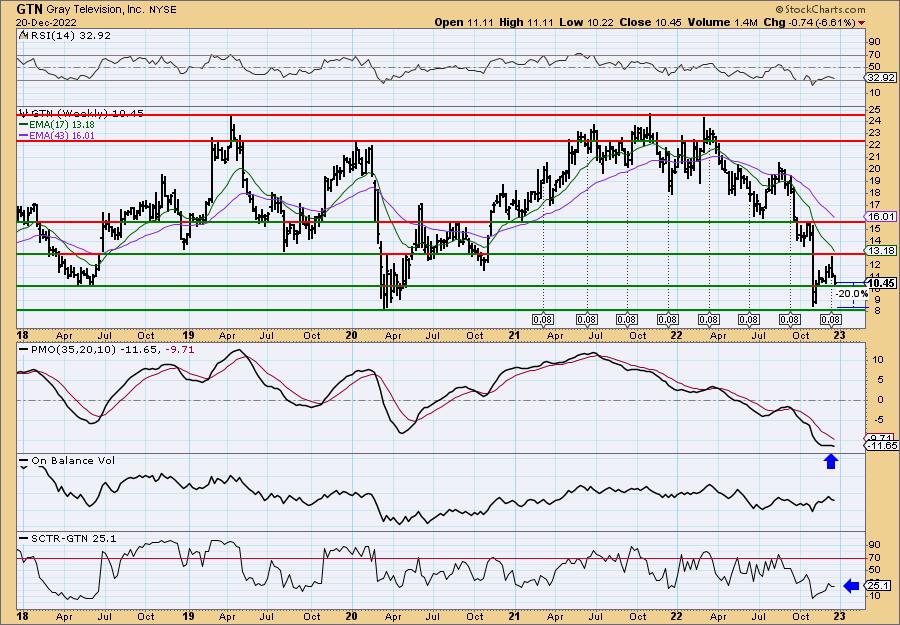
Price retesting strong support at the 2018 low. This week's stiff decline has moved the PMO downward. The RSI is also negative. The StockCharts Technical Rank is a less than mediocre 25.1%. This tells us that 75% of mid-caps have better trend and condition in the intermediate to longer terms. This is likely a more short-term investment.
Cleveland-Cliffs Inc (CLF)
EARNINGS: 02/10/2023 (BMO)
Cleveland-Cliffs, Inc. is a flat-rolled steel producer, which supplies iron ore pellets to the North American steel industry. It engages in the production of metallics and coke, iron making, steelmaking, rolling and finishing, and downstream tubular components, stamping, and tooling. The company was founded in 1847 and is headquartered in Cleveland, OH.
Predefined Scans Triggered: Elder Bar Turned Green, New CCI Buy Signals, Gap Ups, Moved Above Upper Bollinger Band, Stocks in a New Uptrend (Aroon), Moved Above Ichimoku Cloud, Moved Above Upper Price Channel and Parabolic SAR Buy Signals.
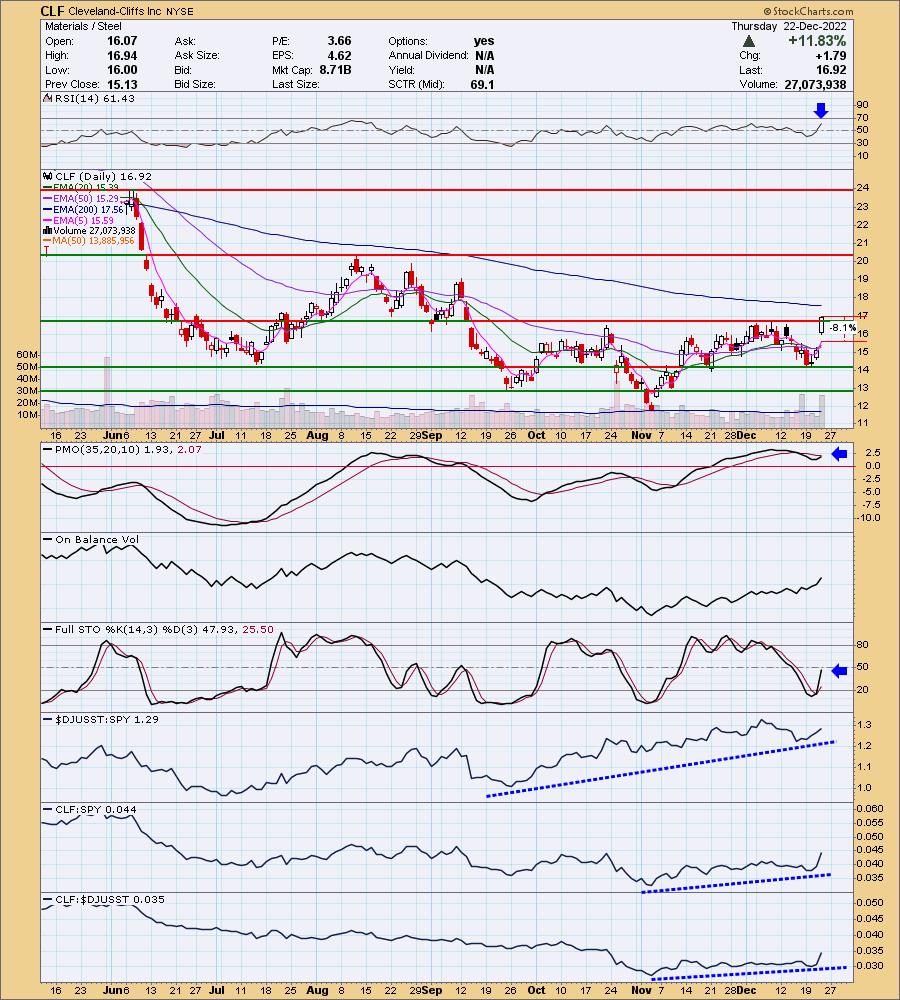
CLF is down -0.12% in after hours trading. I decided to investigate the industry group and the ETF for Steel (SLX). SLX looks bullish and it is up +1.46% in after hours trading. CLF is beginning to outperform the Steel group, so despite the huge move today, I think it will still move higher. The RSI is positive and rising. Price just confirmed a bullish reverse head and shoulders. The pattern suggests price should test the August high at least. The PMO is nearing a new crossover BUY signal (although it is overbought). Stochastics are rising vertically toward positive territory. Relative strength studies are bullish. The stop was a bit difficult to set so you'll need to adjust as necessary depending on when you were to enter, but for now, I have it set at 8.1% around $15.54.
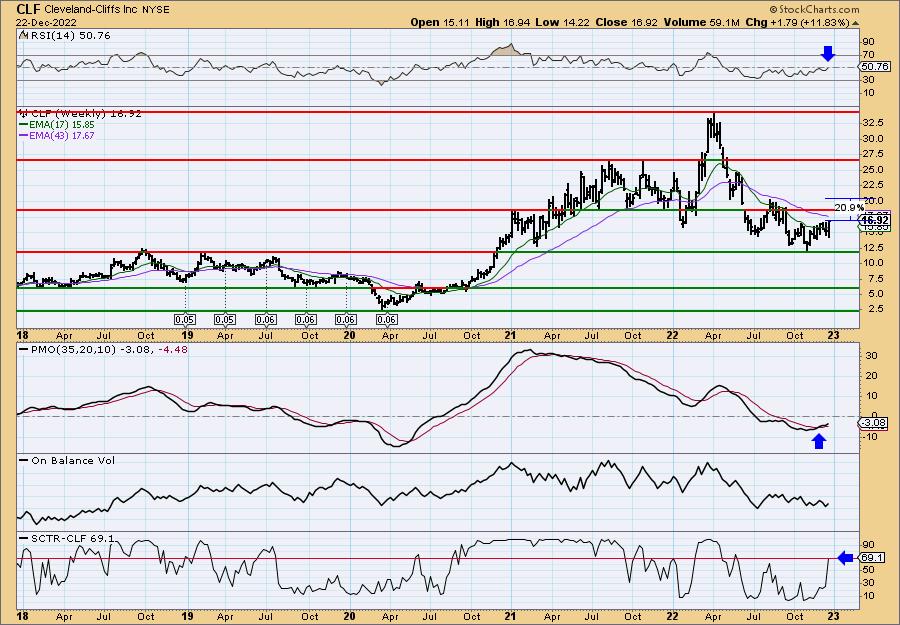
I have set the upside target at the August high we discussed above. The weekly RSI just hit positive territory and the weekly PMO has logged a crossover BUY signal. The SCTR is about to enter the "hot zone" above 70 which implies the stock or ETF is in the top 30% of its universe. In the case of CLF, that is the mid-cap universe.
Genco Shipping & Trading Ltd. (GNK)
EARNINGS: 02/23/2023 (AMC)
Genco Shipping & Trading Ltd. is an international ship owning company, which engages in the transportation of iron ore, coal, grain, steel products and other drybulk cargoes. It operates through the ocean transportation of drybulk cargoes worldwide through the ownership and operation of drybulk carrier vessels segment. The company was founded on September 27, 2004 and is headquartered in New York, NY.
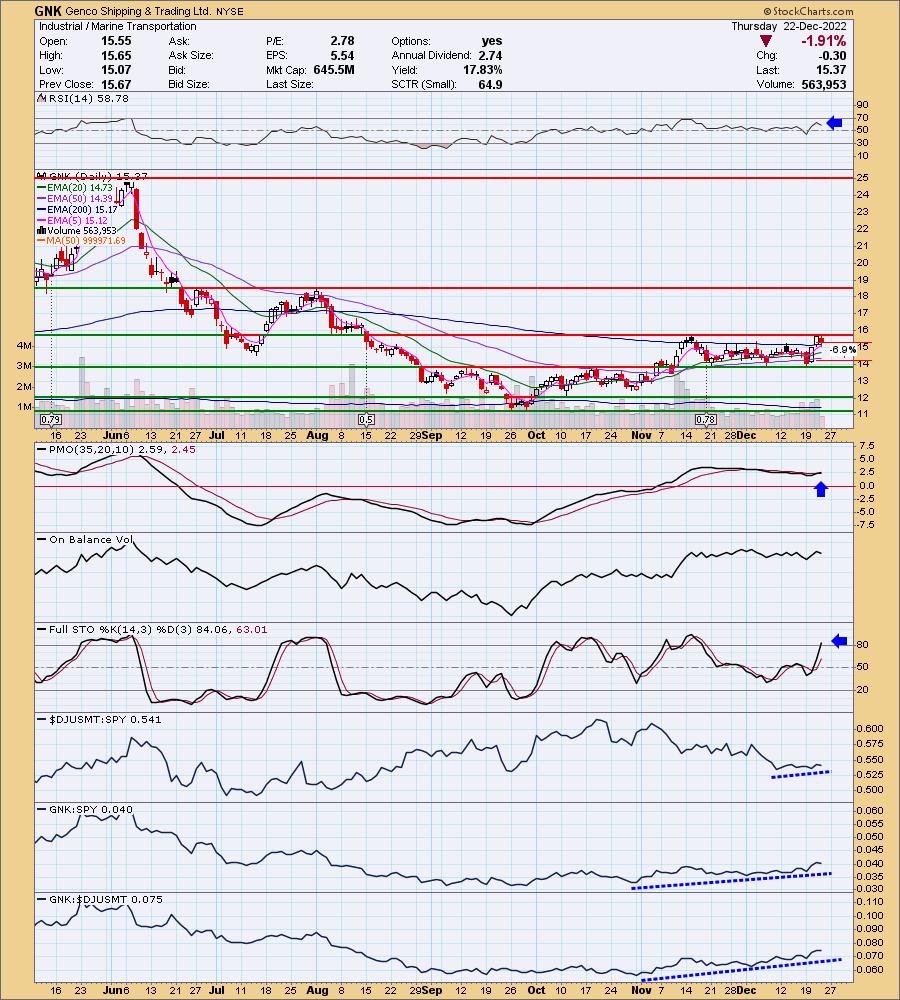
Predefined Scans Triggered: Bearish Harami.
GNK is up +0.72% in after hours trading so the bearish Harami candlestick may not result in a trip back down to the bottom of the range. However, I would really like to see an upside breakout before investing in this one. The RSI tipped over on today's decline but it is still in positive territory. The PMO just triggered a crossover BUY signal and is not that overbought. Stochastics just pushed above 80. Relative strength is okay. Given the market is weak, I'd prefer to see steeper rising trends. The stop is set below the 50-day EMA, if you can handle it, a stop below the trading range would be about 11%. I opted for 6.9% or $14.30.
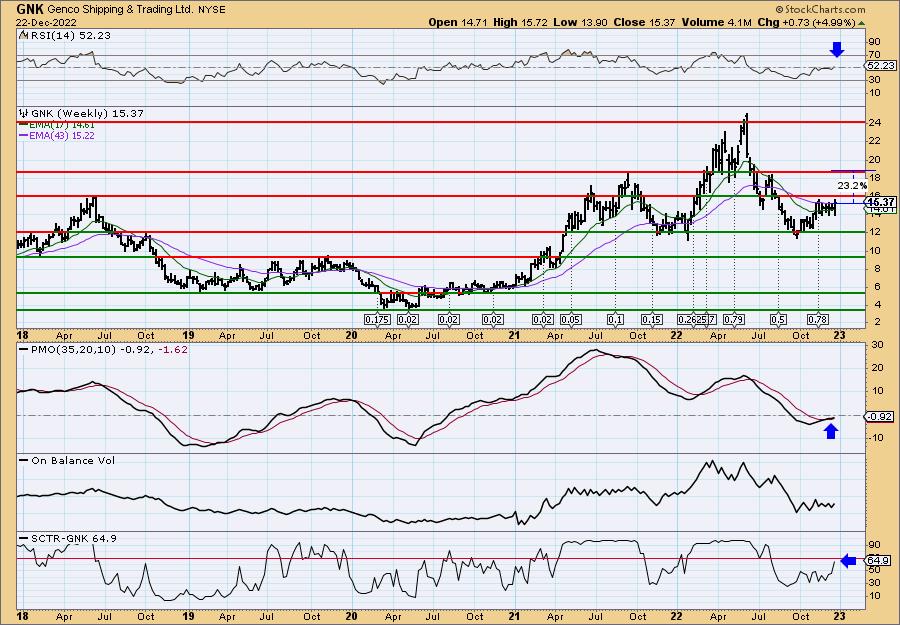
The weekly RSI just moved back into positive territory and the weekly PMO has generated a crossover BUY signal. The SCTR is below 70, but is alright at 64.9. If we can get the breakout, I would look for a 23% move to the 2021 high.
HCI Group, Inc. (HCI)
EARNINGS: 03/07/2023 (AMC)
HCI Group, Inc. engages in the business of property and casualty insurance, reinsurance, real estate, and information technology. It operates through the following segments: Insurance Operations, Real Estate, and Corporate and Others. The Insurance Operations segment includes the property and casualty insurance division and reinsurance division. The Real Estate segment consists of commercial properties the firm owns for investment purposes or for use in its own operations. The Corporate and Others segment represents the activities of the holding companies, the information technology division, and other companies. The company was founded by Paresh Patel, Gregory Politis, and Martin A. Traber on November 30, 2006 and is headquartered in Tampa, FL.
Predefined Scans Triggered: None.
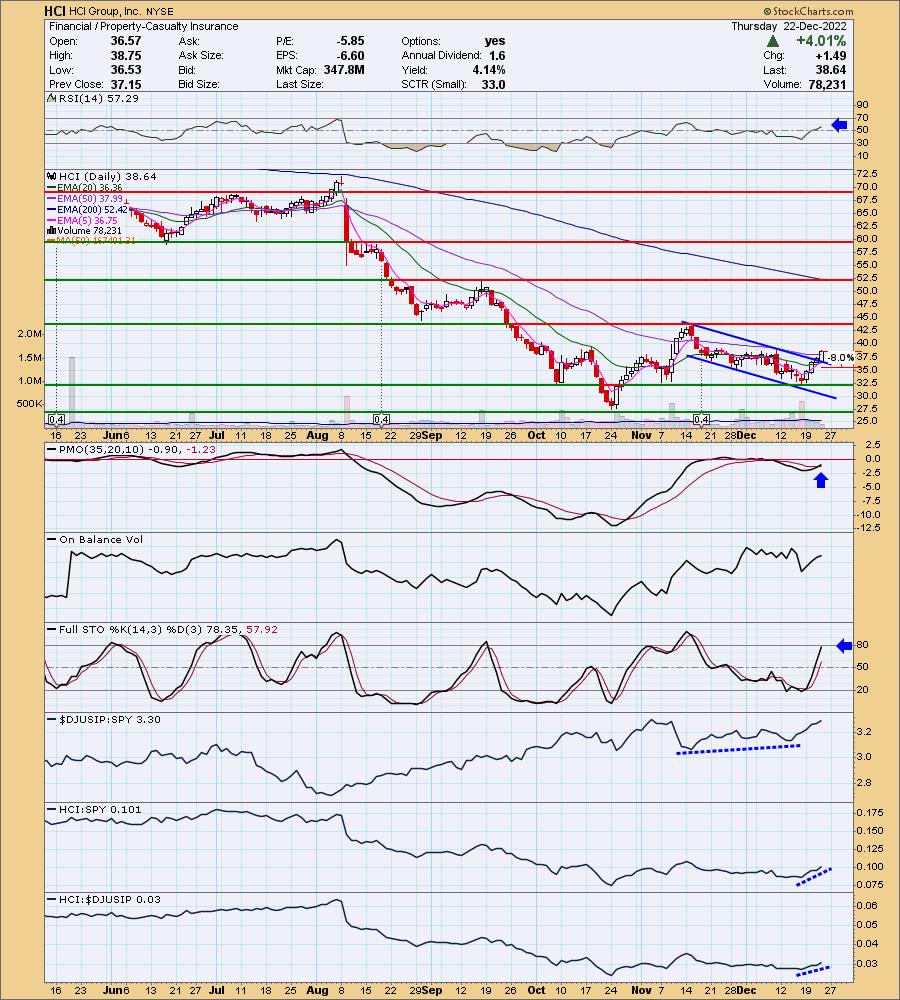
HCI is up +0.93% in after hours trading. I love the breakout from the declining trend channel. The RSI has just moved into positive territory and the PMO triggered a new crossover BUY signal today. Stochastics are rising strongly and should be above 80 tomorrow if the rally continues. Relative strength is picking up in the near term, but the group has been on a rising relative trend since August. The stop is set around the area it would return to the declining trend channel around 8% or $35.54.
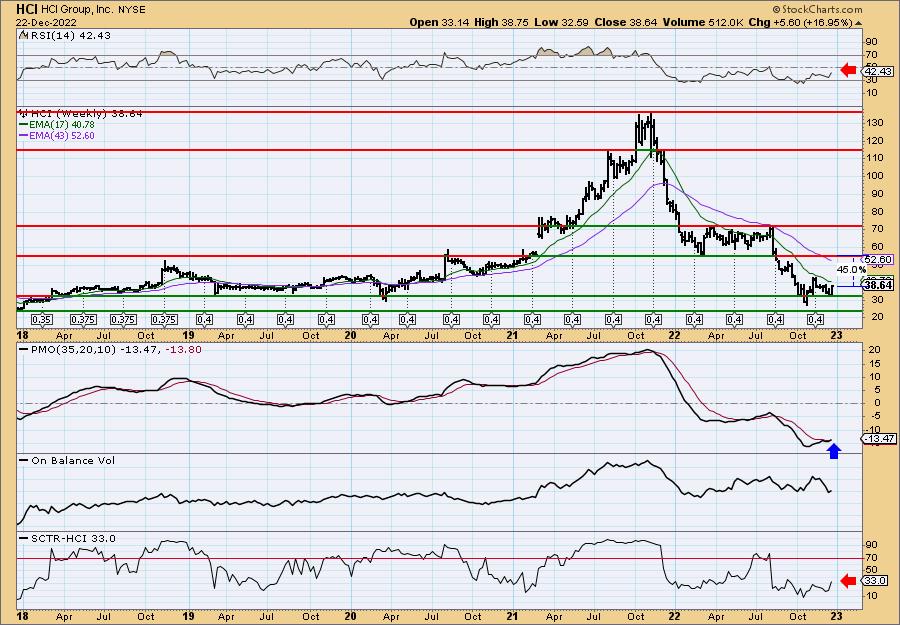
We could end up with a bullish double-bottom if this rally takes hold. The weekly chart needs more help than just the formation of a possible bullish formation. The weekly RSI is still negative, albeit rising and the SCTR is at a low 33%. What it really has going for it is the new weekly PMO crossover BUY signal. Upside potential should it breakout and fulfill the upside target of the possible double-bottom would be 45%.
Don't forget, on Thursdays I look at reader-requested symbols, click HERE to send me an email. I read every email I receive and try to answer them all!
Current Market Outlook:
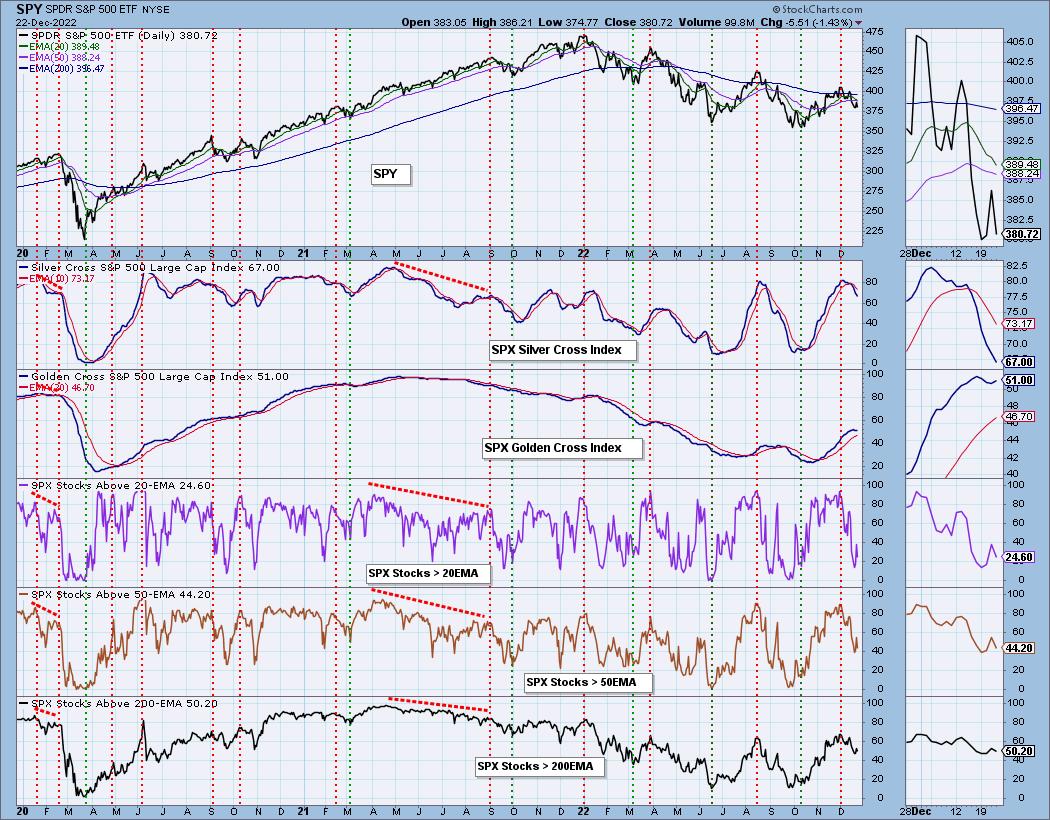
Market Environment: It is important to consider the odds for success by assessing the market tides. The following chart uses different methodologies for objectively showing the depth and trend of participation for intermediate- and long-term time frames.
- The Silver Cross Index (SCI) shows the percentage of SPX stocks on IT Trend Model BUY signals (20-EMA > 50-EMA)
- The Golden Cross Index (GCI) shows the percentage of SPX stocks on LT Trend Model BUY signals (50-EMA > 200-EMA)
Don't forget that as a "Diamonds" member, you have access to our GCI/SCI curated ChartList on DecisionPoint.com. You'll find it under "Members Only" links on the left side on the Blogs and Links Page.
Here is the current chart:
Full Disclosure: I am 12% exposed with a 2% hedge.
I'm required to disclose if I currently own a stock I mention and/or may buy/short it within the next 72 hours.
"Technical Analysis is a windsock, not a crystal ball." - Carl Swenlin
(c) Copyright 2022 DecisionPoint.com
Watch the latest episode of DecisionPoint with Carl & Erin Swenlin on Mondays 7:00p EST or on the DecisionPoint playlist on the StockCharts TV YouTube channel here!
NOTE: The stocks reported herein are from mechanical trading model scans that are based upon moving average relationships, momentum and volume. DecisionPoint analysis is then applied to get five selections from the scans. The selections given should prompt readers to do a chart review using their own analysis process. This letter is not a call for a specific action to buy, sell or short any of the stocks provided. There are NO sure things or guaranteed returns on the daily selection of "Diamonds in the Rough."
Regarding BUY/SELL Signals: The signal status reported herein is based upon mechanical trading model signals and crossovers. They define the implied bias of the price index/stock based upon moving average relationships and momentum, but they do not necessarily call for a specific action. They are information flags that should prompt chart review. Further, they do not call for continuous buying or selling during the life of the signal. For example, a BUY signal will probably (but not necessarily) return the best results if action is taken soon after the signal is generated. Additional opportunities for buying may be found as price zigzags higher, but the trader must look for optimum entry points. Conversely, exit points to preserve gains (or minimize losses) may be evident before the model mechanically closes the signal.
Helpful DecisionPoint Links:
DecisionPoint Shared ChartList and DecisionPoint Chart Gallery
Price Momentum Oscillator (PMO)
Swenlin Trading Oscillators (STO-B and STO-V)
For more links, go to DecisionPoint.com