
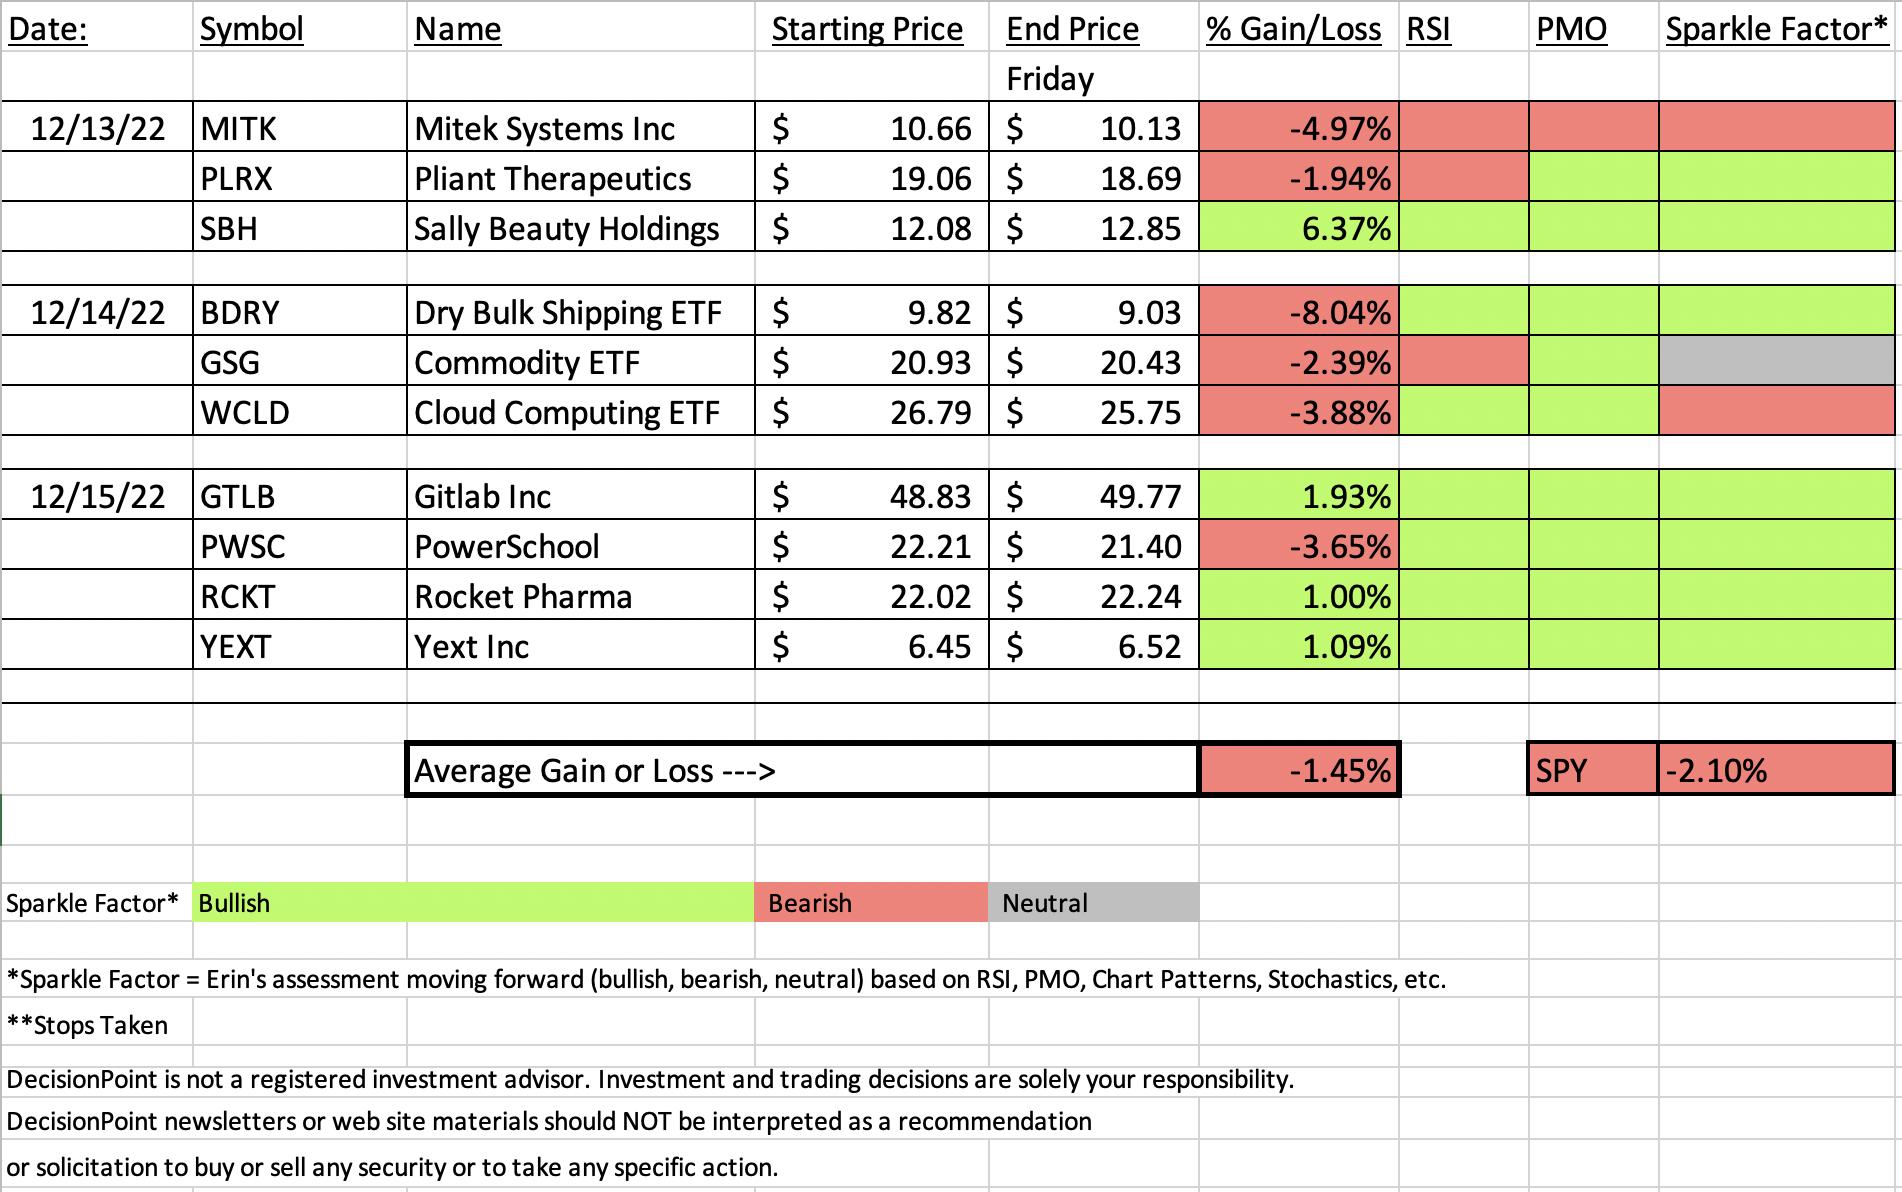
While overall we did beat the SPY, the average was negative. The good news is that of the ten picks presented this week, only two don't look good moving forward. There was also one that has an uncertain future. The rest still have merit.
Trying to find a "Sector to Watch" and "Industry Group to Watch" this week was nearly impossible. All of the sectors show negative momentum and nearly every industry group has the same predicament. Therefore, we had to mix our sector and industry group. I try to pick symbols and groups from the "Sector to Watch", but we didn't find a good group.
The "Darling" this week was clearly Sally Beauty (SBH). The chart looked great to begin and we saw incredible follow-through this week.
The "Dud" was of course the one trade I took this week for myself. Despite a terrible week, the Dry Bulk Shipping ETF (BDRY) still shows rising momentum and a positive RSI so I believe it still has merit, but we do need to bail if momentum fails.
Thank you for your patience this week as I published later than planned. We bought a new car finally (replacing a car from 2008). We picked it up Friday and it took awhile to get out of there only to face 2 hours and 45 minutes of traffic home. Exhaustion set in and we had family here this weekend so I opted to delay publishing. I try not to do this often, but my goal is always to get you your reports in time for the open on Monday.
Good Luck & Good Trading,
Erin

RECORDING LINK (12/16/2022):
Topic: DecisionPoint Diamond Mine (12/16/2022) LIVE Trading Room
Start Time: Dec 16, 2022 09:00 AM
Recording Link HERE
Passcode: Dec#16th
REGISTRATION for 12/22/2022:
When: Dec 23, 2022 09:00 AM Pacific Time (US and Canada)
Topic: DecisionPoint Diamond Mine (12/23/2022) LIVE Trading Room
Register in advance for this webinar HERE
After registering, you will receive a confirmation email containing information about joining the webinar.

Our latest DecisionPoint Trading Room recording:
A few items about the spreadsheet: I've put on the spreadsheet whether the RSI is positive (green) or negative (red). The PMO column tells you if it is rising (green) or falling (red). Finally I've added my own "Sparkle Factor" that gives you my assessment going forward, bullish (green), bearish (red) or neutral (gray). The Sparkle Factor is basically my thoughts on whether I expect it to rise or fall. A neutral means it could really go either way so it could be added to a watch list. If you're in a stock I consider "neutral" going forward, the ball is in your court.
Darling:
Sally Beauty Holdings Inc. (SBH)
EARNINGS: 02/01/2023 (BMO)
Sally Beauty Holdings, Inc. is an international retailer and distributor of professional beauty supplies. It operates through the Sally Beauty Supply (SBS) and Beauty Systems Group (BSG) segments. The SBS segment offers domestic and international chain of retail stores and a consumer-facing e-commerce website that offers professional beauty supplies to both salon professionals and retail customers primarily in North America, Puerto Rico, and parts of Europe and South America. The BSG segment includes franchise-based business Armstrong McCall, a full service distributor of beauty products and supplies that offers professional beauty products directly to salons and salon professionals through its professional-only stores, e-commerce platforms and its own sales force in partially exclusive geographical territories in the United States and Canada. The company was founded in 1964 and is headquartered in Denton, TX.
Predefined Scans Triggered: Parabolic SAR Buy Signals, P&F Double Bottom Breakout and Hanging Man.
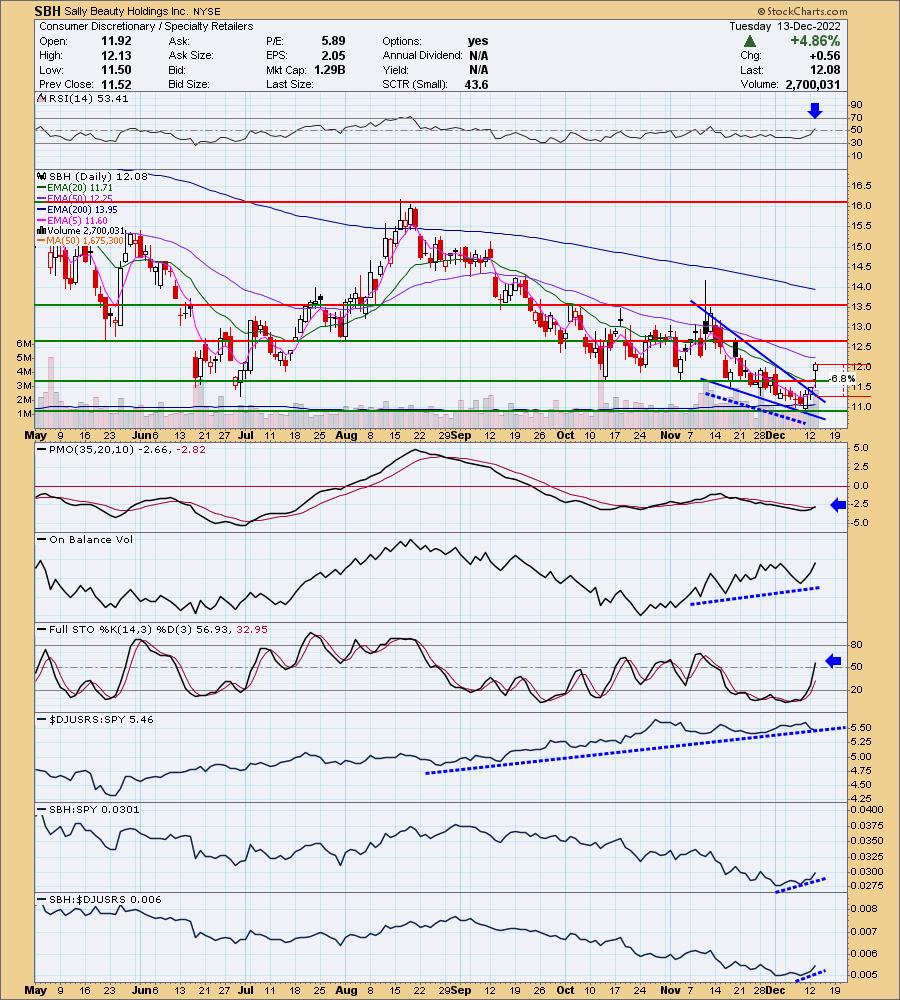
Here are the commentary and chart from 12/13:
"SBH is unchanged in after hours trading. Today was a strong breakout. Unlike many of its brethren, it doesn't have a filled black candlestick. Price has now confirmed a bullish falling wedge and closed well above the 20-day EMA. Next up is the 50-day EMA. The RSI just entered positive territory and the PMO just triggered a crossover BUY signal. There is a strong OBV positive divergence that suggests a prolonged rally ahead. Stochastics are rising toward 80. The group has performed well, but SBH doesn't always participate. Currently it is beginning to outperform the group and the SPY. The stop is set at 6.8% (a little more than halfway down the prior trading range) around $11.26."
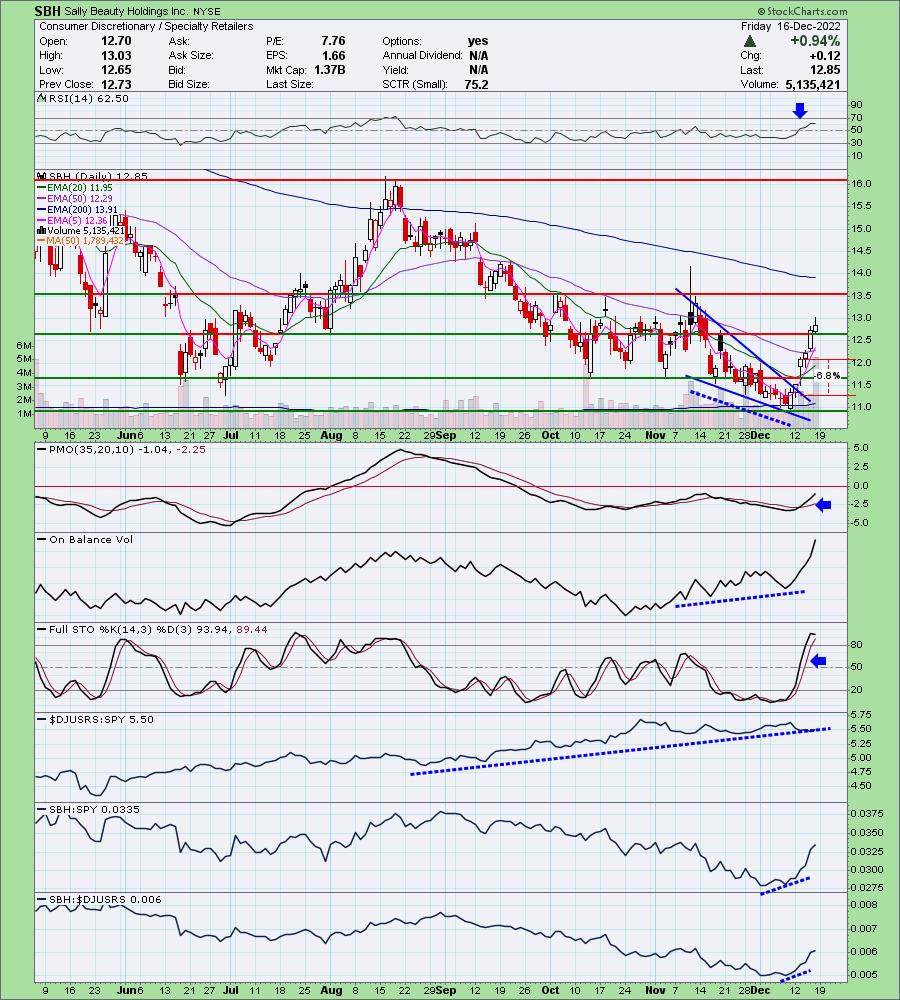
Here is today's chart:
As noted in the opening, this chart is very strong and thankfully we presented it in time for you to get in to enjoy the upside continuation. I really like that the RSI is not overbought and the Price Momentum Oscillator (PMO) is rising strongly on an oversold crossover BUY signal. Check out the volume that poured into this stock last week. Stochastics are very strong. This one could use a bit of a pullback, but with Friday's breakout, I believe we could see more upside first.
Don't forget, on Thursdays I look at reader-requested symbols, so shoot me an email at erin@decisionpoint.com. I read every email I receive and try to answer them all!
Dud:
Breakwave Dry Bulk Shipping ETF (BDRY)
EARNINGS: N/A
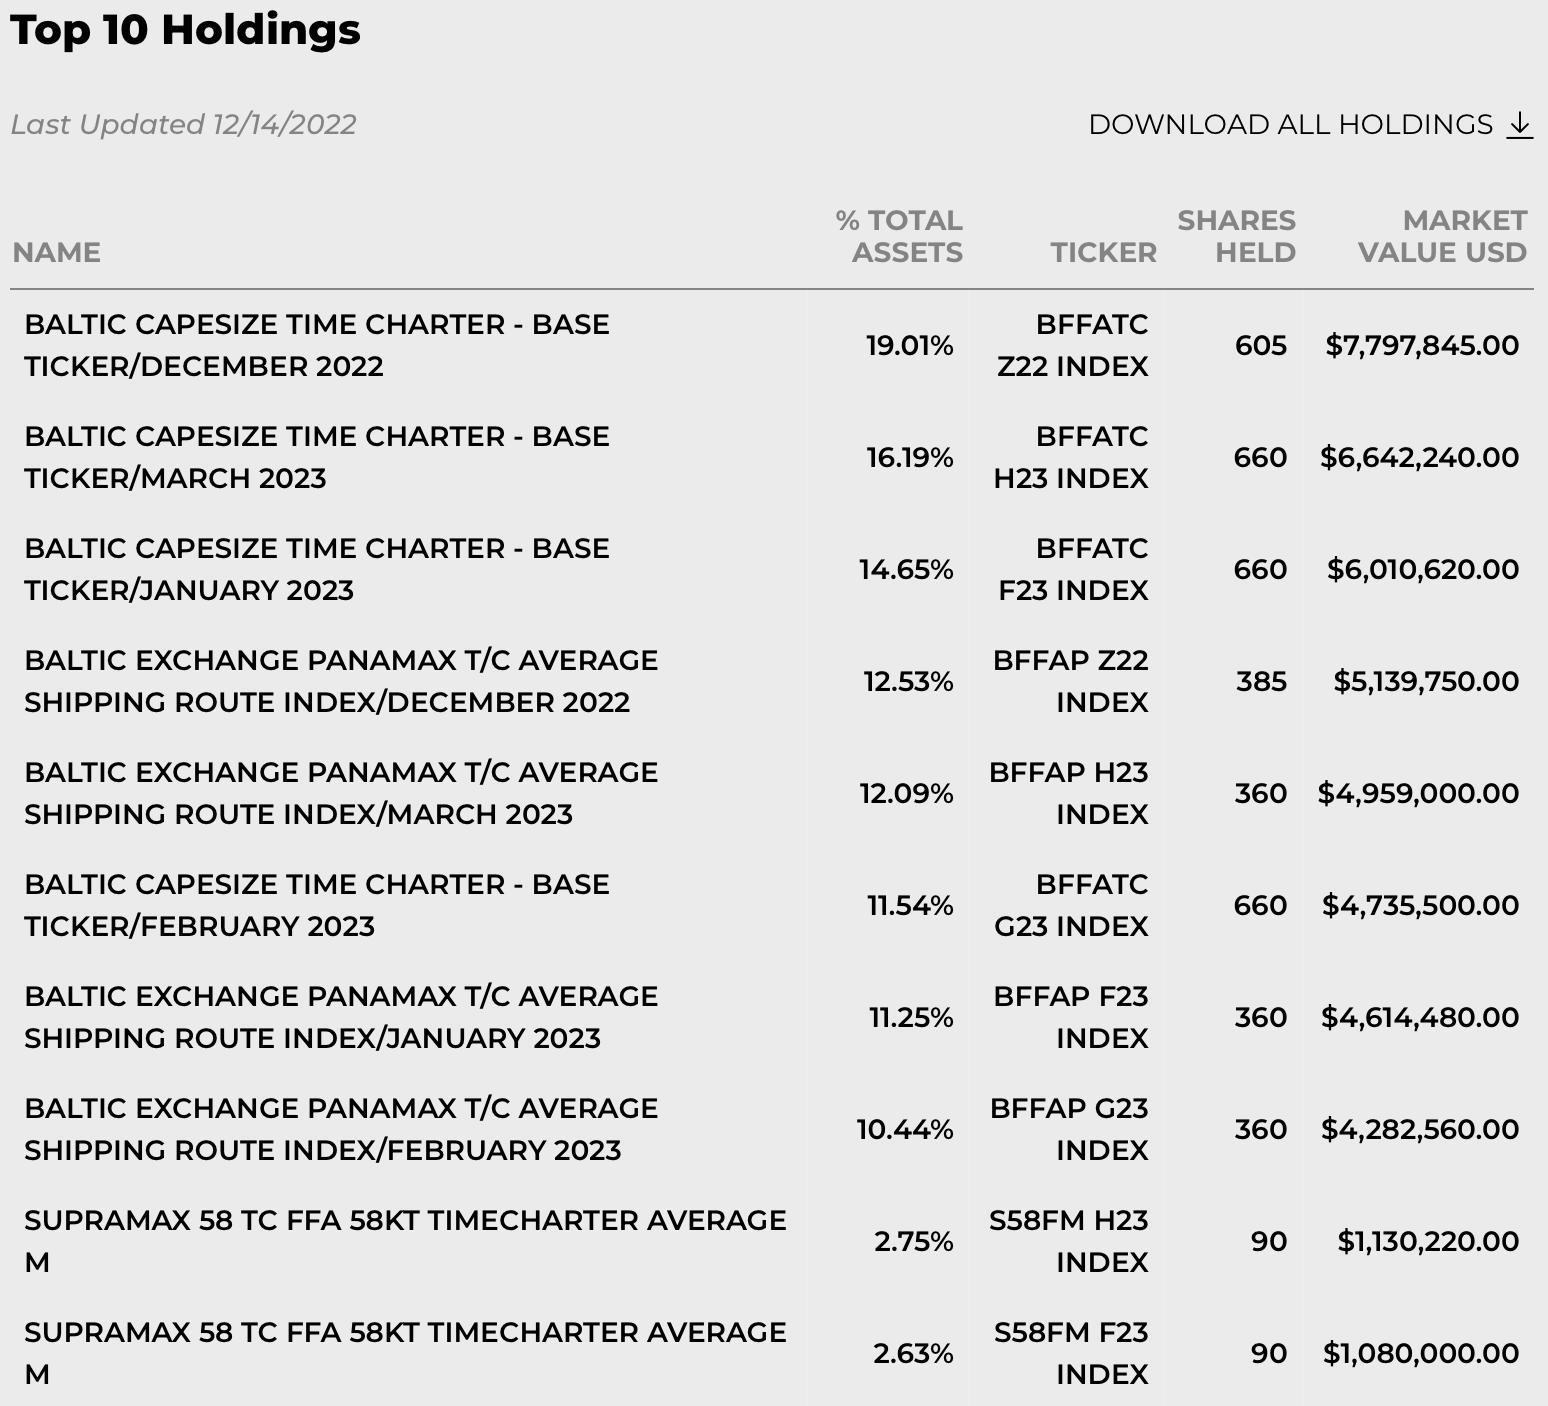
BDRY tracks an index of long-only exposure to the nearest calendar quarter of dry bulk freight futures contracts on specified indexes. For more information click HERE.
Predefined Scans Triggered: Gap Ups, Moved Above Upper Price Channel and Runaway Gap Ups.
Here are the commentary and chart from 12/14:
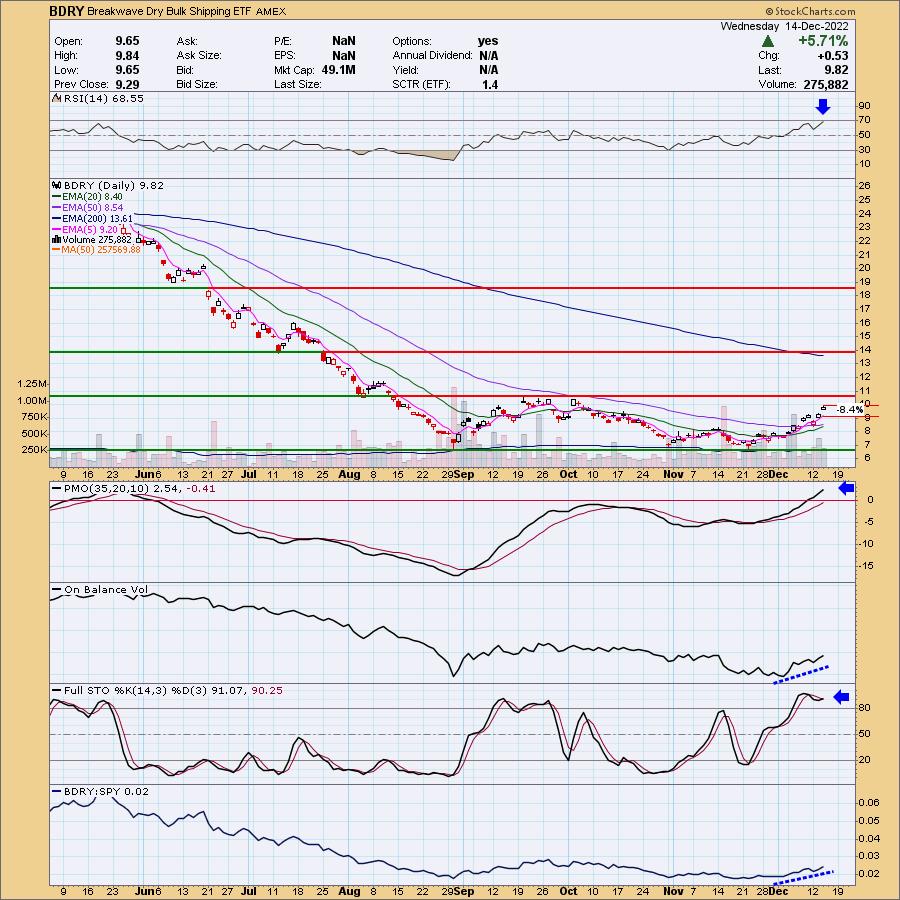
"BDRY is down -4.07% in after hours trading so a better entry than today's price is highly likely. This is my favorite chart of the day. It is on the risky side given its low price point so position size wisely. Price has formed a double-bottom in November and it appears to be executing as expected. It technically has reached the minimum upside target of the pattern, but I think we've got more upside to go based on the indicators. The RSI is positive and not yet overbought. The PMO recently moved above the zero line and is not overbought. Stochastics are oscillating above 80 just like we want. The stop is definitely deep, but given today's big rally, it is necessary. You can thin it out if you get in at a lower price. The stop is set at 8.4% around $8.99."
Here is today's chart:
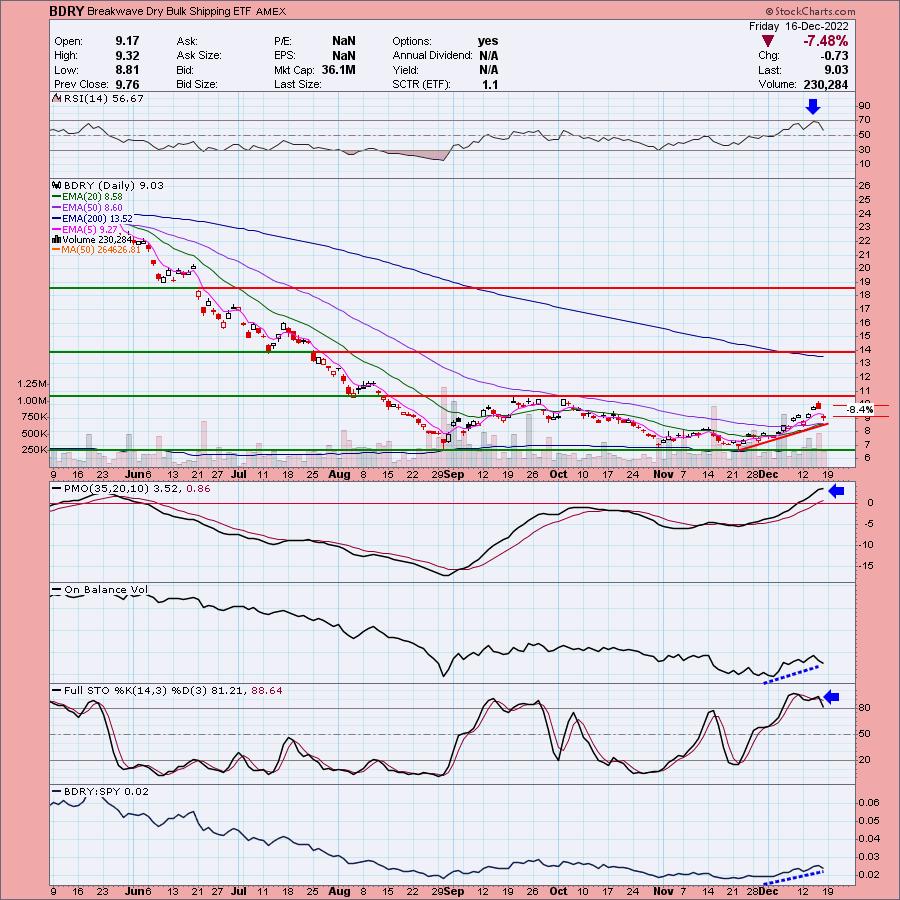
This wasn't a "juiced" or leveraged ETF and barely missed being stopped out. This pullback to the rising trend doesn't bother me too much, but the forceful nature of the decline Friday does bother me. However, in spite of this terrible decline, the RSI and PMO are still rising and Stochastics remain above 80. I believe this one will still move higher and this could offer a better entry with this pullback. You could add this to a watchlist if you aren't in and watch to see if the rising trend will be broken. If it is, it won't be a good place to be as a breakdown would indicate a likely trip to support at around $8.
THIS WEEK's Sector Performance:

DecisionPoint Sector Scoreboard (Mechanical Trend Model Signals):

Click Here to view Carl's annotated Sector ChartList!
Sector to Watch: Utilities (XLU)
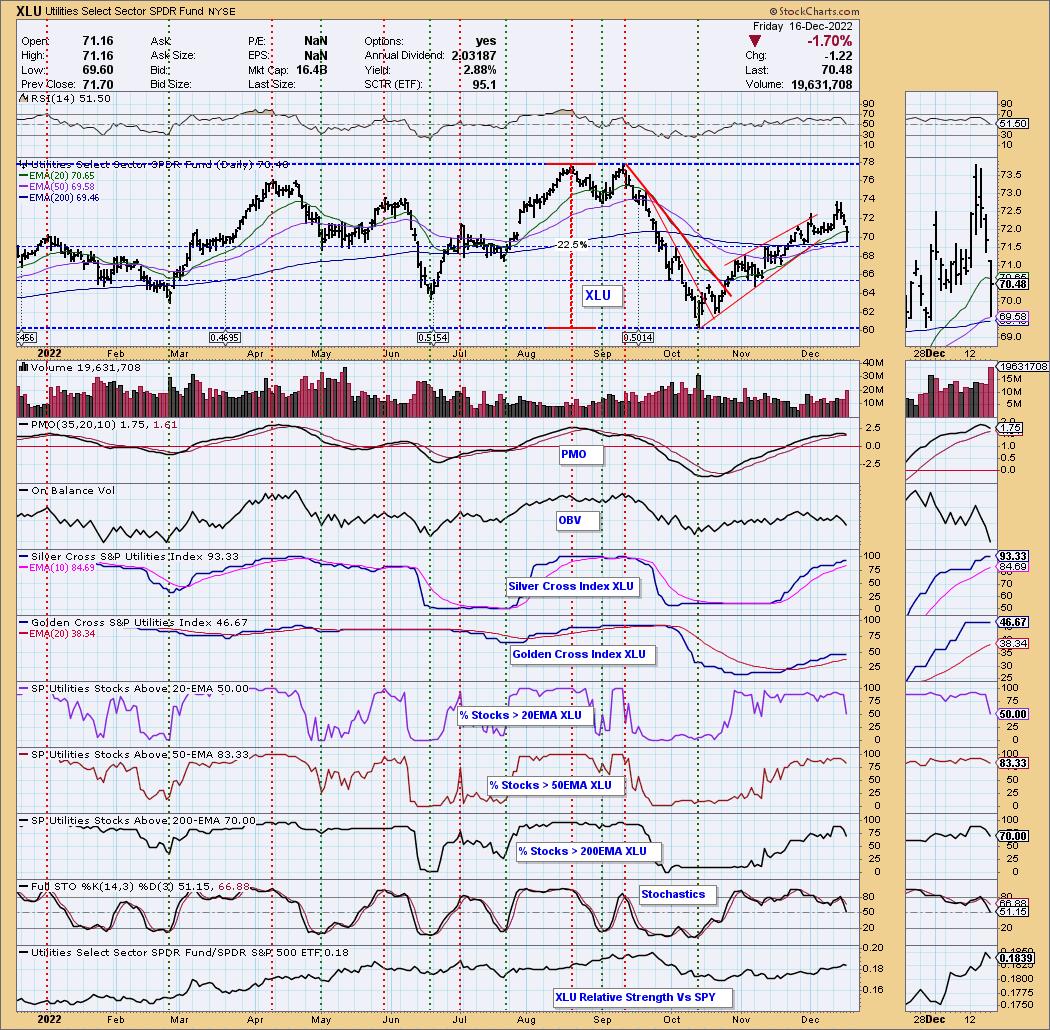
This sector was damaged last week with the breakdown of the rising short-term trend and a loss of rising momentum. Still, participation, while weakening is still broad. Any positive action out of the market and this sector should recuperate first. A bottom coming off this decline would put XLU in a rising trend channel versus the bearish rising wedge that was confirmed with this breakdown. I am not suggesting you should expand your exposure, mainly I want you to keep an eye on this sector moving forward.
Industry Group to Watch: Home Builders ($DJUSHB)
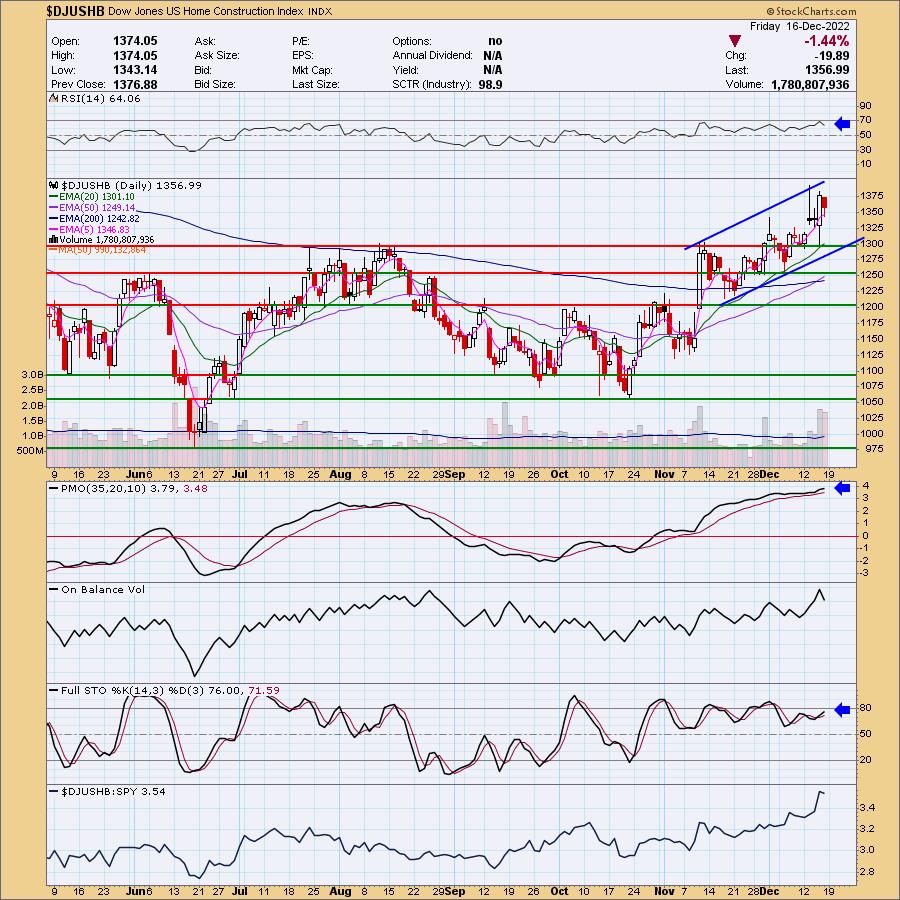
This was one of the few industry groups that looked fairly positive. I will tell you that I looked up XBH, the SPDR Homebuilders ETF and it looked far more bearish than the DJUS version so be careful. We do see a rising trend channel (although it could be time for it to test the rising trend again). The PMO is still rising and the RSI is in positive territory. Stochastics look encouraging. We did look for a few symbols in this group to watch next week: DHI, LEGH and LEN.
Go to our Sector ChartList on DecisionPoint.com to get an in-depth view of all the sectors. On StockCharts.com you can find the Industry Summary.
Good Luck & Good Trading!
- Erin
erin@decisionpoint.com
Full Disclosure: I'm 10% exposed with a 5% hedge.
Watch the latest episode of theDecisionPoint Trading Room with Carl & Erin Swenlin on Mondays 3:00p EST!
Technical Analysis is a windsock, not a crystal ball. --Carl Swenlin
NOTE: The stocks reported herein are from mechanical trading model scans that are based upon moving average relationships, momentum and volume. DecisionPoint analysis is then applied to get five selections from the scans. The selections given should prompt readers to do a chart review using their own analysis process. This letter is not a call for a specific action to buy, sell or short any of the stocks provided. There are NO sure things or guaranteed returns on the daily selection of "diamonds in the rough."
Helpful DecisionPoint Links:
DecisionPoint Shared ChartList and DecisionPoint Chart Gallery
Price Momentum Oscillator (PMO)
Swenlin Trading Oscillators (STO-B and STO-V)
(c) Copyright 2022 DecisionPoint.com